


Features
- 6 Unique Slides
- Fully editable and easy to edit in Microsoft Powerpoint, Keynote and Google Slides
- 16:9 widescreen layout
- Clean and professional designs
- Export to JPG, PDF or send by email


Do you have any questions?
Recommend


10 slides
Financial Investment Portfolio Presentation
The "Financial Investment Portfolio" templates use a visually appealing mix of arrow and coin icons to represent different aspects of financial portfolios. Each slide varies slightly in color palette and layout but maintains a consistent theme that effectively uses symbols to emphasize key financial concepts or data points. These designs are excellent for presentations aimed at illustrating investment strategies, portfolio distributions, or financial growth, providing both clarity and aesthetic appeal to the information presented.


7 slides
North America Language Map Infographic
Embark on a visual odyssey across the vast terrains of North America with our expertly crafted map infographic. Painted in the expansive blue, the lush green, the vibrant yellow, and the warm orange, our template captures the essence of North America's diverse geographies and cultures. Adorned with accurate infographics, distinct icons, and region-specific image placeholders, it provides a panoramic view of the continent's multifaceted landscape. Flawlessly tailored for Powerpoint, Keynote, or Google Slides. An indispensable tool for educators, travelers, geographers, or businesses targeting the North American market. Navigate with purpose; let every slide be a step into North America's captivating expanse.


5 slides
Startup Business Plan Presentation
Launch your ideas with clarity using this Startup Business Plan slide template. The rocket-inspired visual guides your audience through five strategic stages, each labeled with editable icons and titles—perfect for pitching goals, financials, timelines, or key operations. Ideal for entrepreneurs and early-stage companies, this slide is easy to customize in PowerPoint, Keynote, or Google Slides.


22 slides
Starlit Agency Portfolio Presentation
The Starlit Agency Portfolio template is a sophisticated way to highlight your agency's expertise, achievements, and creative vision! Perfect for presenting to potential clients or partners, this template starts with a polished introduction and an "About Us" section that clearly defines your agency's mission and vision. Showcase your team's skills and services in an organized manner, making it easy for clients to understand what you offer. With slides dedicated to client success stories, case studies, and market analysis, you can build trust by displaying your proven track record. Highlight industry trends and your agency's approach to creative processes to demonstrate your strategic thinking. The template also includes sections for strategy development, campaign execution, and measurement analytics, ensuring you cover all aspects of your services. Close with client testimonials, partnership opportunities, and a future outlook, leaving your audience impressed. This template is fully compatible with PowerPoint, Keynote, and Google Slides, making it versatile and easy to use for any presentation.


5 slides
Competitor Comparison Infographics
A Comparison Infographic is a type of visual representation that displays the similarities and differences between two or more items, concepts, or ideas. This template is perfect to help viewers easily make informed decisions based on the comparison. These infographics are visual representations of data that are used to compare two or more things. These infographics can be used to highlight the differences or similarities between different products, services, companies, or any other entities that can be compared. Included are charts, graphs, tables, and other visual elements to help present information in a clear manner.


21 slides
Techne Strategic Planning Report Presentation
Streamline your strategic planning process with this meticulously crafted presentation template, designed for professionals seeking clarity and structure. Featuring slides dedicated to market trends, SWOT analysis, target audience profiling, and competitive insights, this template ensures your strategy is well-rounded and impactful. The clean and modern design accommodates sections for defining objectives, key challenges, and resource allocation, allowing your team to focus on actionable solutions. Performance metrics and risk management slides help you track progress and address uncertainties effectively. Whether presenting to stakeholders or internal teams, this tool simplifies complex data into easily digestible visuals. Fully editable and compatible with PowerPoint, Google Slides, and Keynote, this template provides the flexibility to adapt to various needs. Perfect for organizations aiming to communicate strategic initiatives and actionable plans with precision and professionalism. Take your strategic planning reports to the next level with this essential template.


20 slides
Fenrir Investor Pitch Presentation
Deliver a compelling and persuasive pitch with this sleek and professional investor pitch deck! It covers essential sections like problem and solution, market opportunity, business model, financials, and growth strategy to ensure your vision is clearly communicated. Ideal for startup fundraising or business presentations, this template is fully compatible with PowerPoint, Keynote, and Google Slides.


5 slides
RAPID Decision-Making Model
Take the guesswork out of group decisions with this bold and clear template. It’s designed around the RAPID framework—Recommend, Agree, Perform, Input, Decide—to help teams define roles and make faster, more accountable choices. Perfect for leadership, strategy, and project planning sessions. Fully compatible with PowerPoint, Keynote, and Google Slides.


6 slides
Responsive Design Display with Devices Presentation
Highlight your multi-device experience with the Responsive Design Display with Devices Presentation. This clean and modern layout features a central monitor and mobile phone illustration, surrounded by five customizable text points—ideal for showing key features or compatibility. Fully editable in Canva, PowerPoint, Keynote, and Google Slides.


12 slides
Customer Support Common Questions Presentation
Enhance customer support efficiency with this modern and structured presentation slide. Featuring a head silhouette with question marks, this template effectively represents customer inquiries and problem-solving processes. Perfect for help desk teams, customer service training, and support workflow presentations, it is fully editable, allowing you to customize text, colors, and layout for a tailored experience. Compatible with PowerPoint, Keynote, and Google Slides for seamless integration.


5 slides
Climate Change Awareness Presentation
Deliver impactful environmental messages with this thermometer-style infographic layout. Ideal for visualizing temperature rise, emissions levels, or awareness metrics, each slide segment represents a stage of climate impact. Perfect for educators, NGOs, sustainability experts, or policy presentations. Fully customizable in PowerPoint, Keynote, and Google Slides.


5 slides
Oil Industry Revenue Infographics
The oil industry, also known as the petroleum industry, is a global sector that involves the exploration, production, refining, transportation, and marketing of petroleum products. These vertical infographics present key statistics and insights about the revenue generated by the oil industry. This infographic provides an overview of the financial aspects of the oil industry, including revenue sources, market trends, and economic impact. The template showcases the revenue trends of the oil industry over a specific period. It utilizes line graphs, bar charts, or other visual elements to illustrate the growth or fluctuations in revenue over time.


23 slides
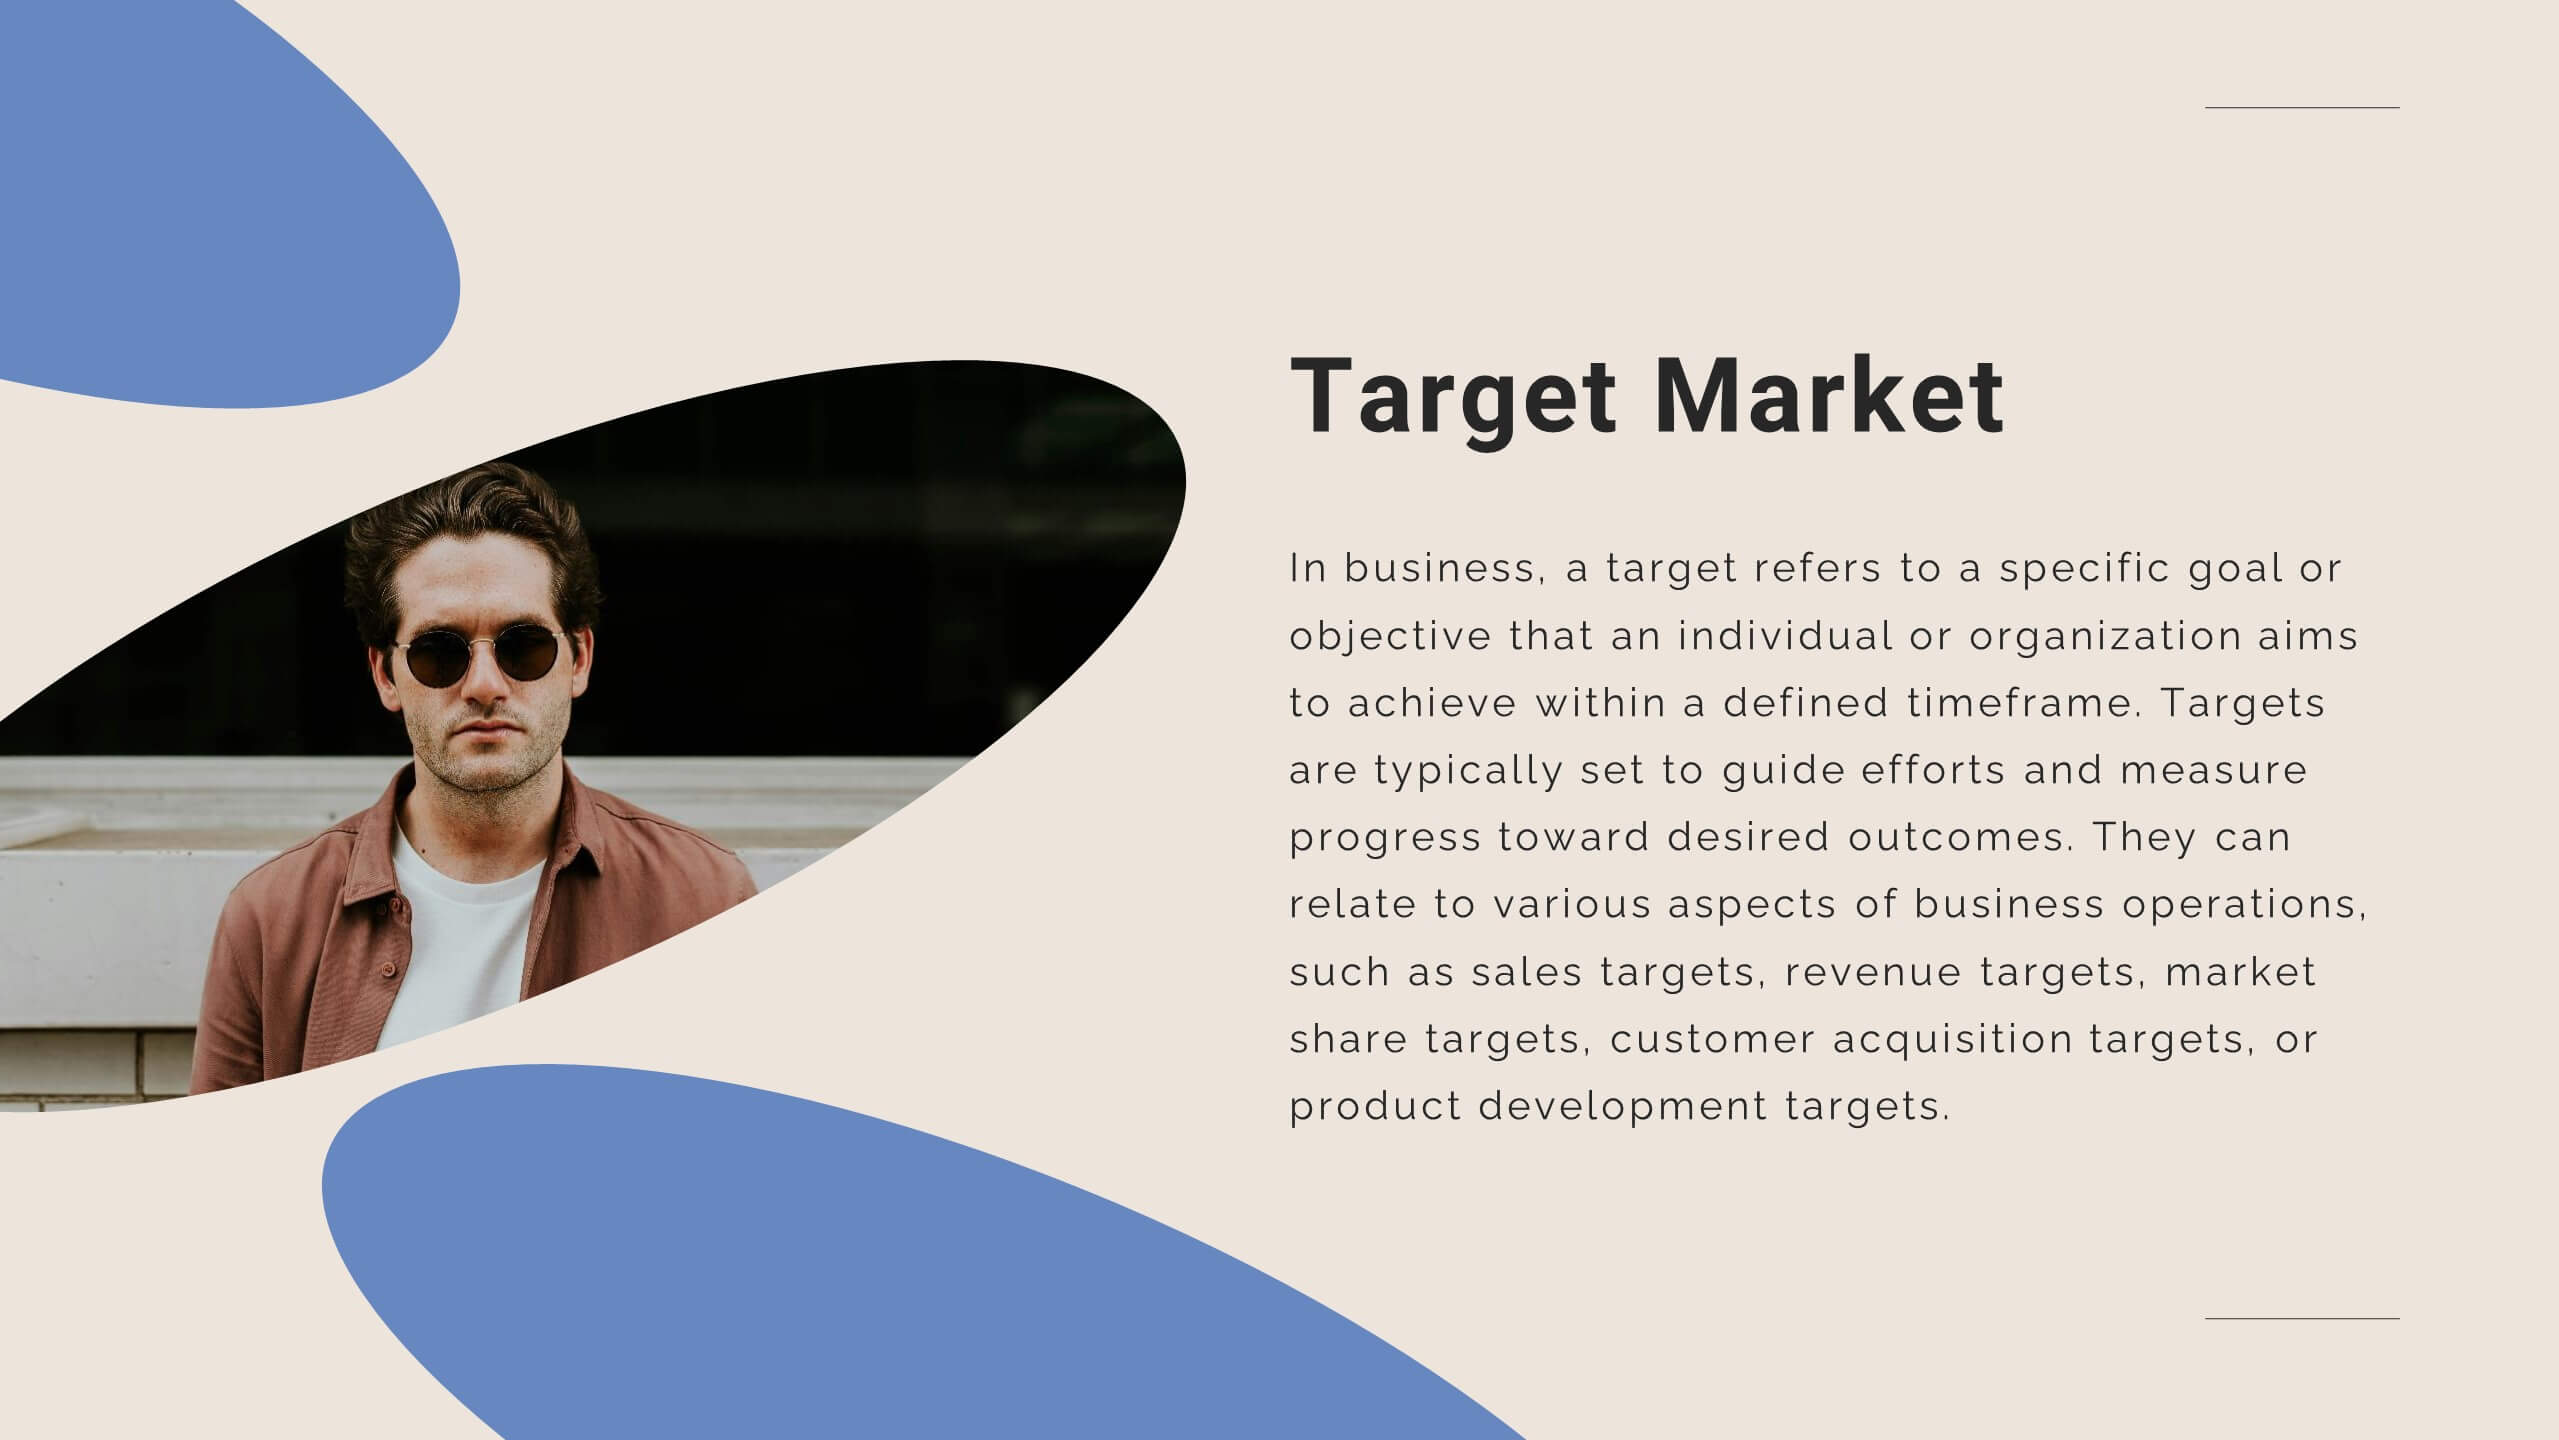
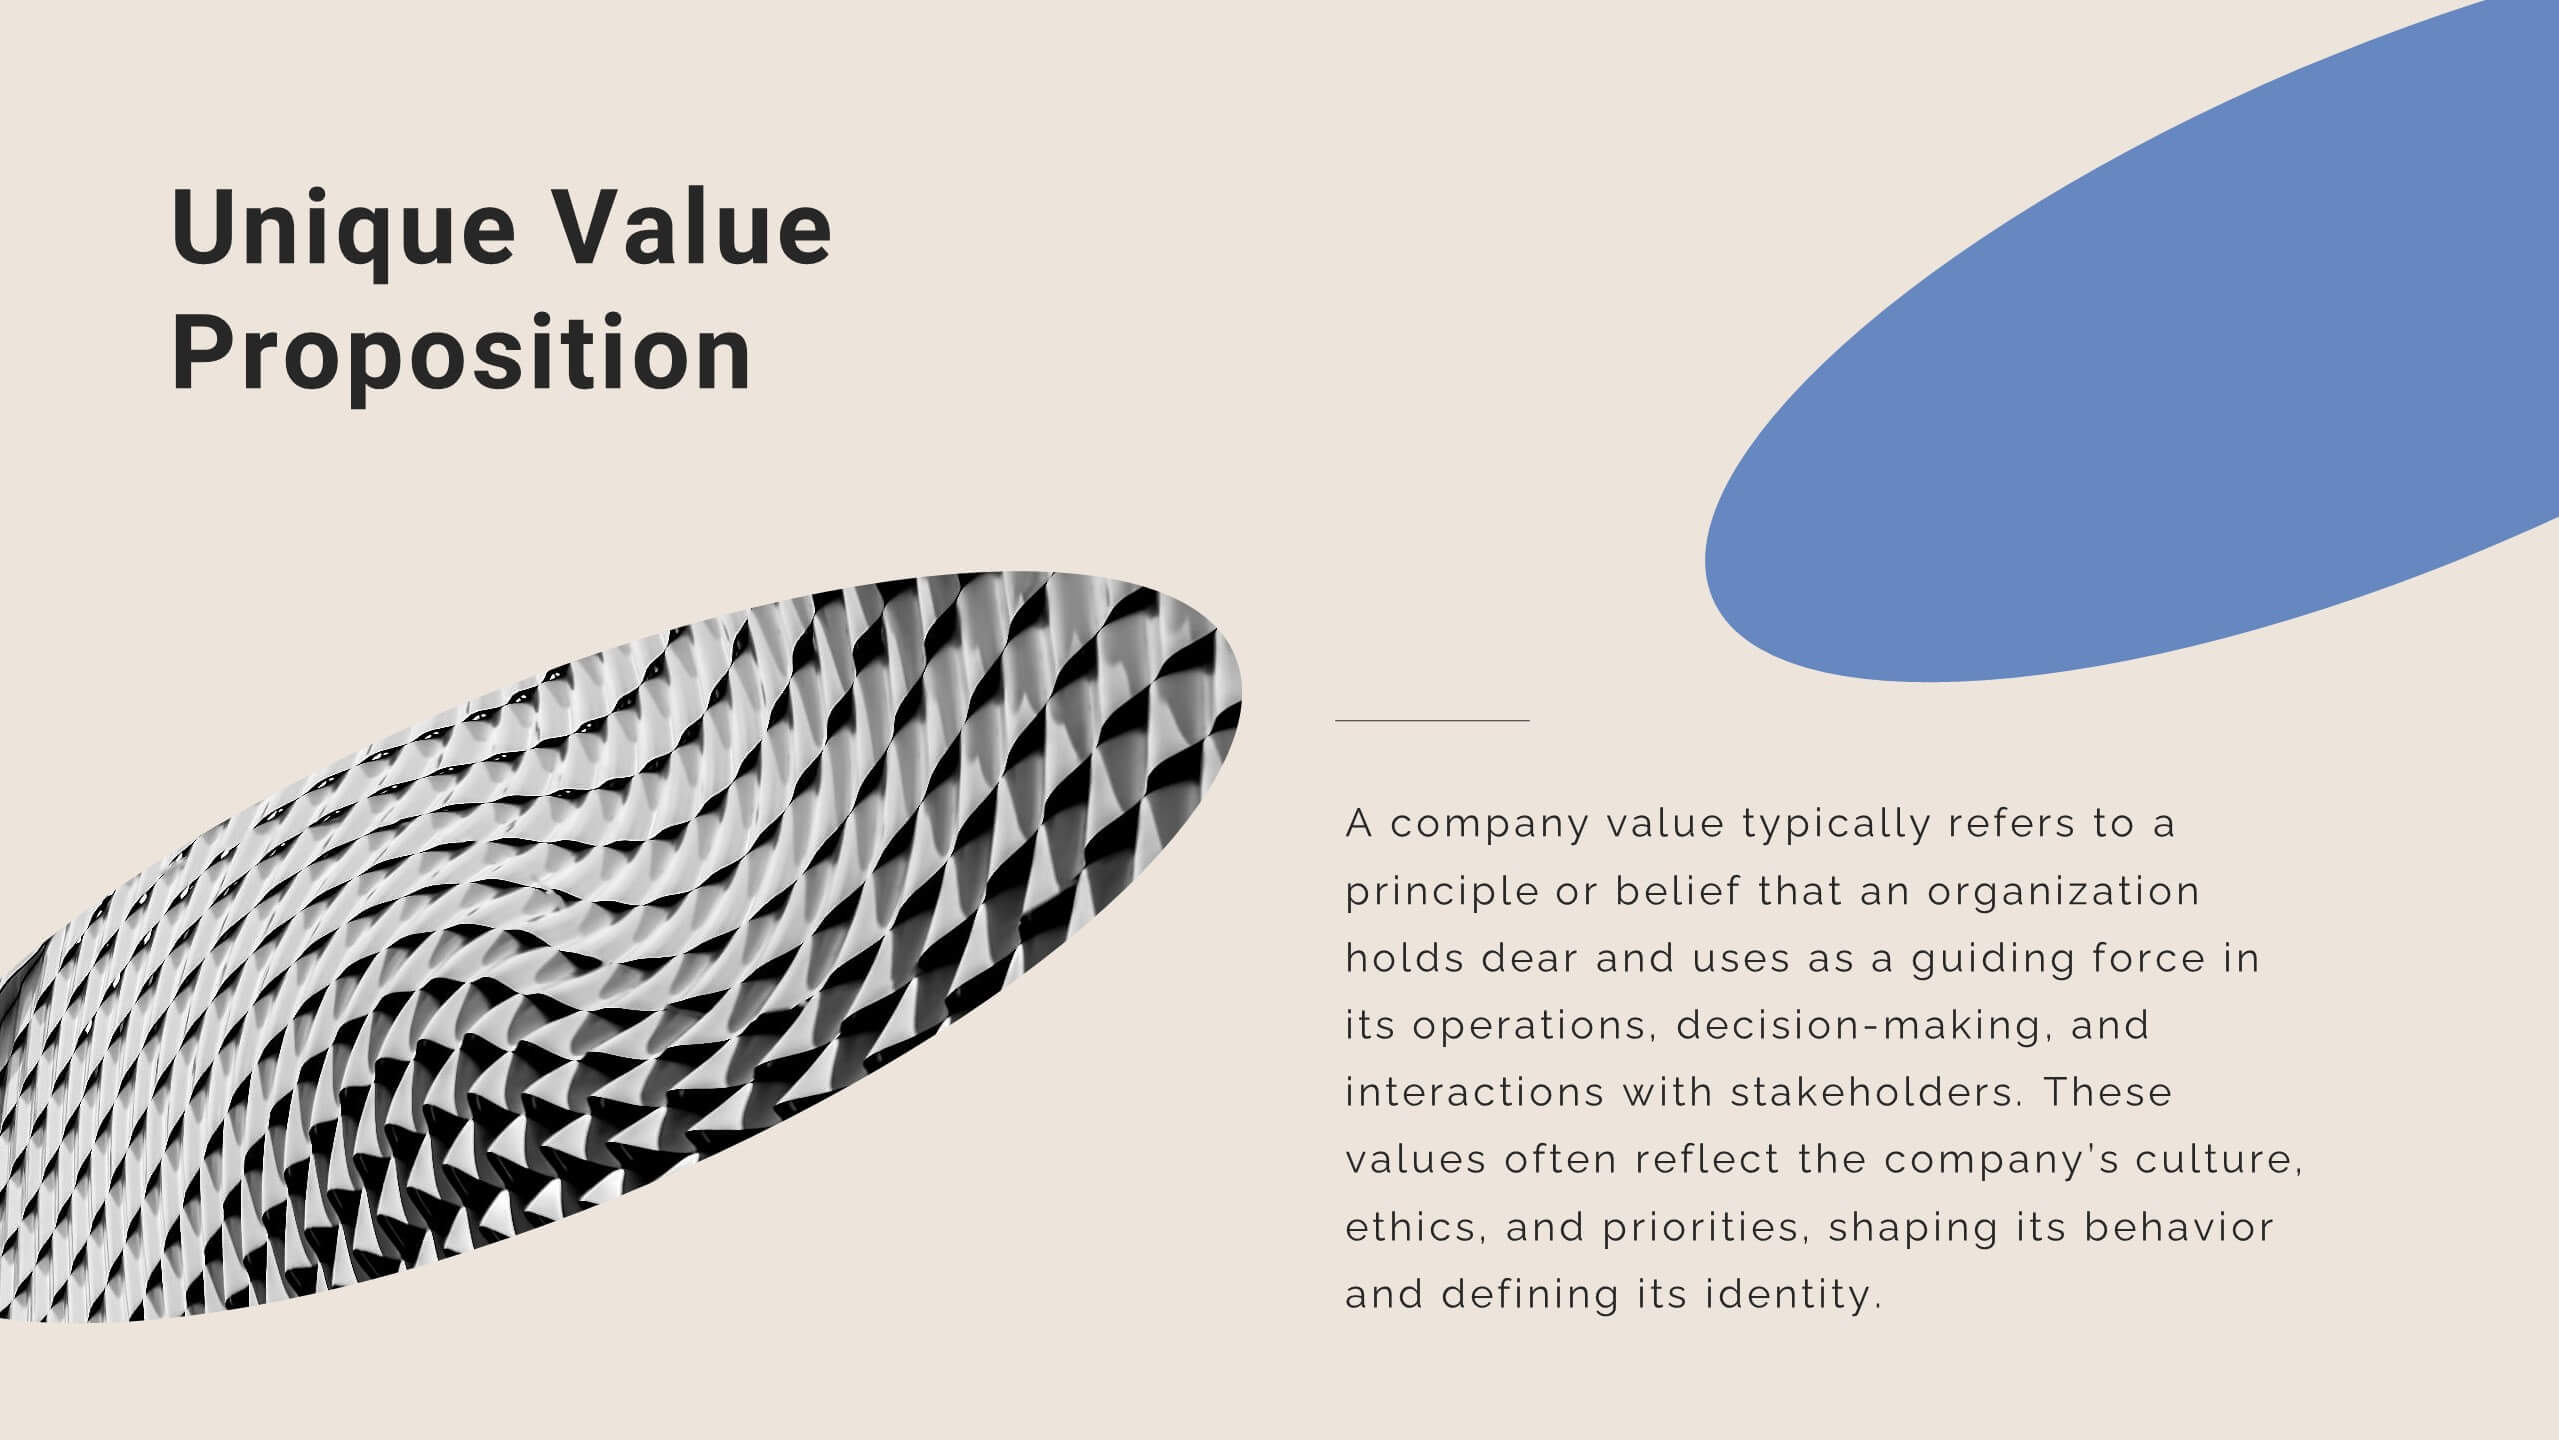
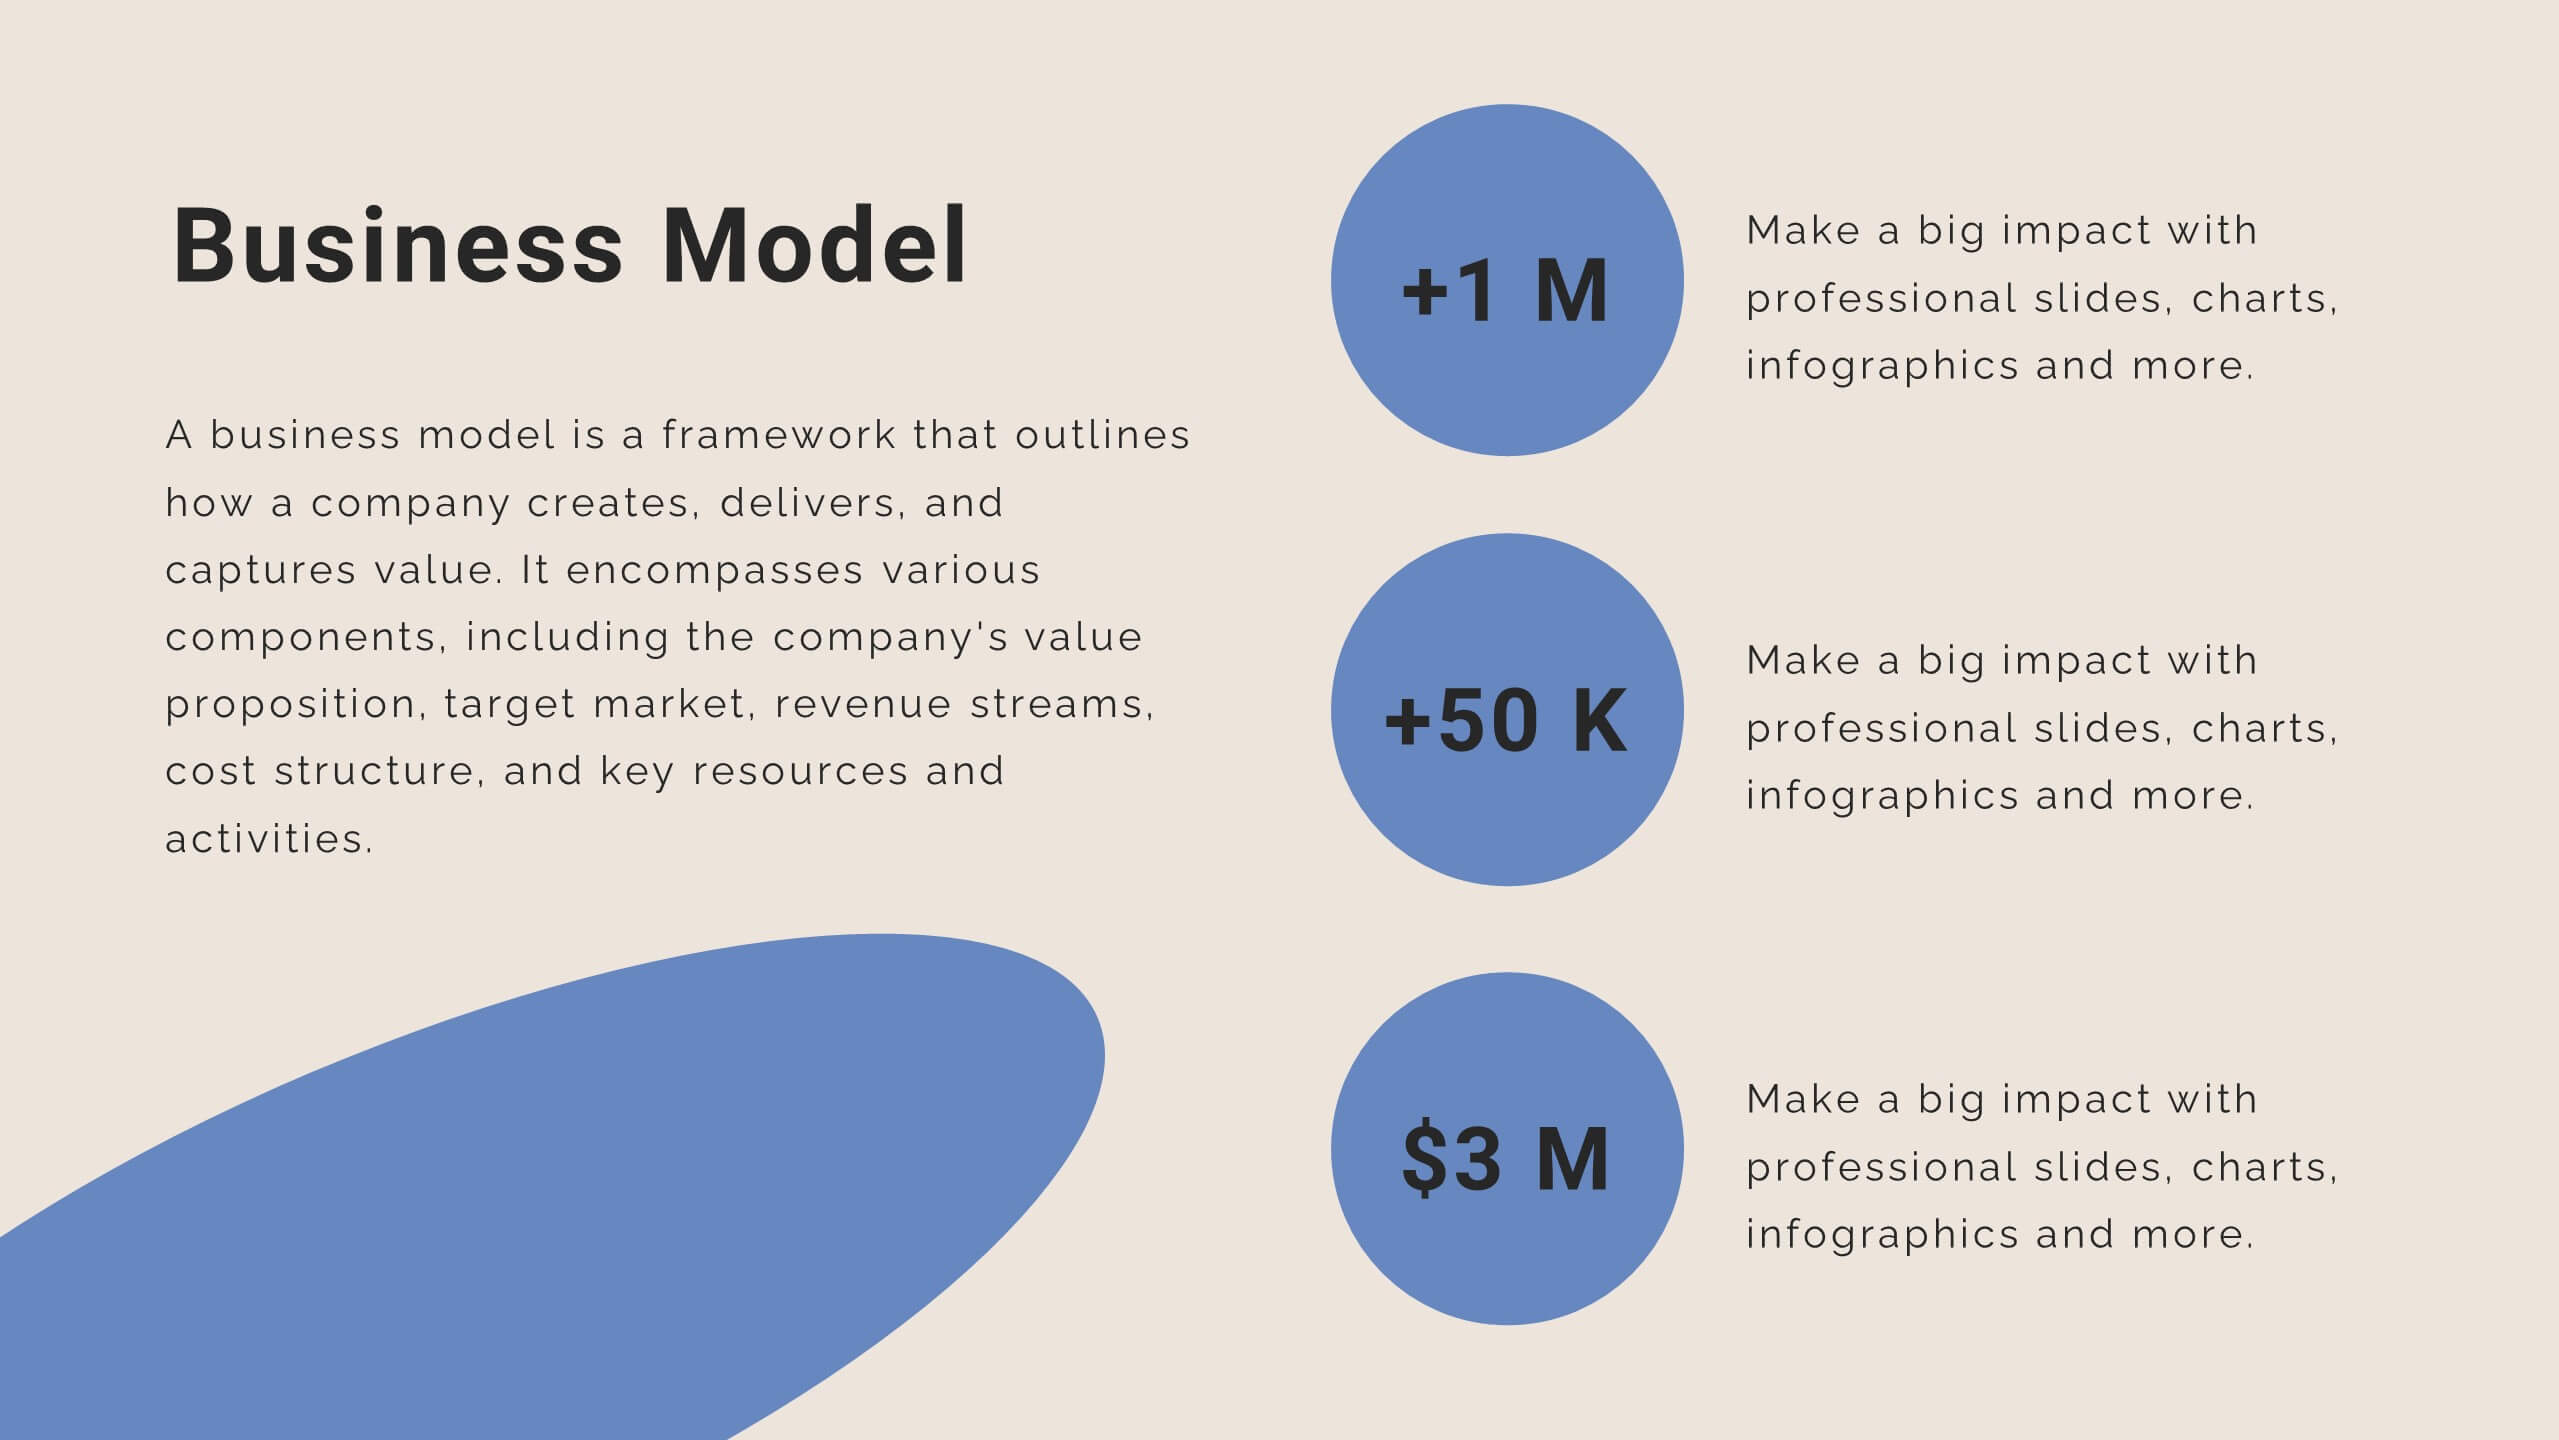
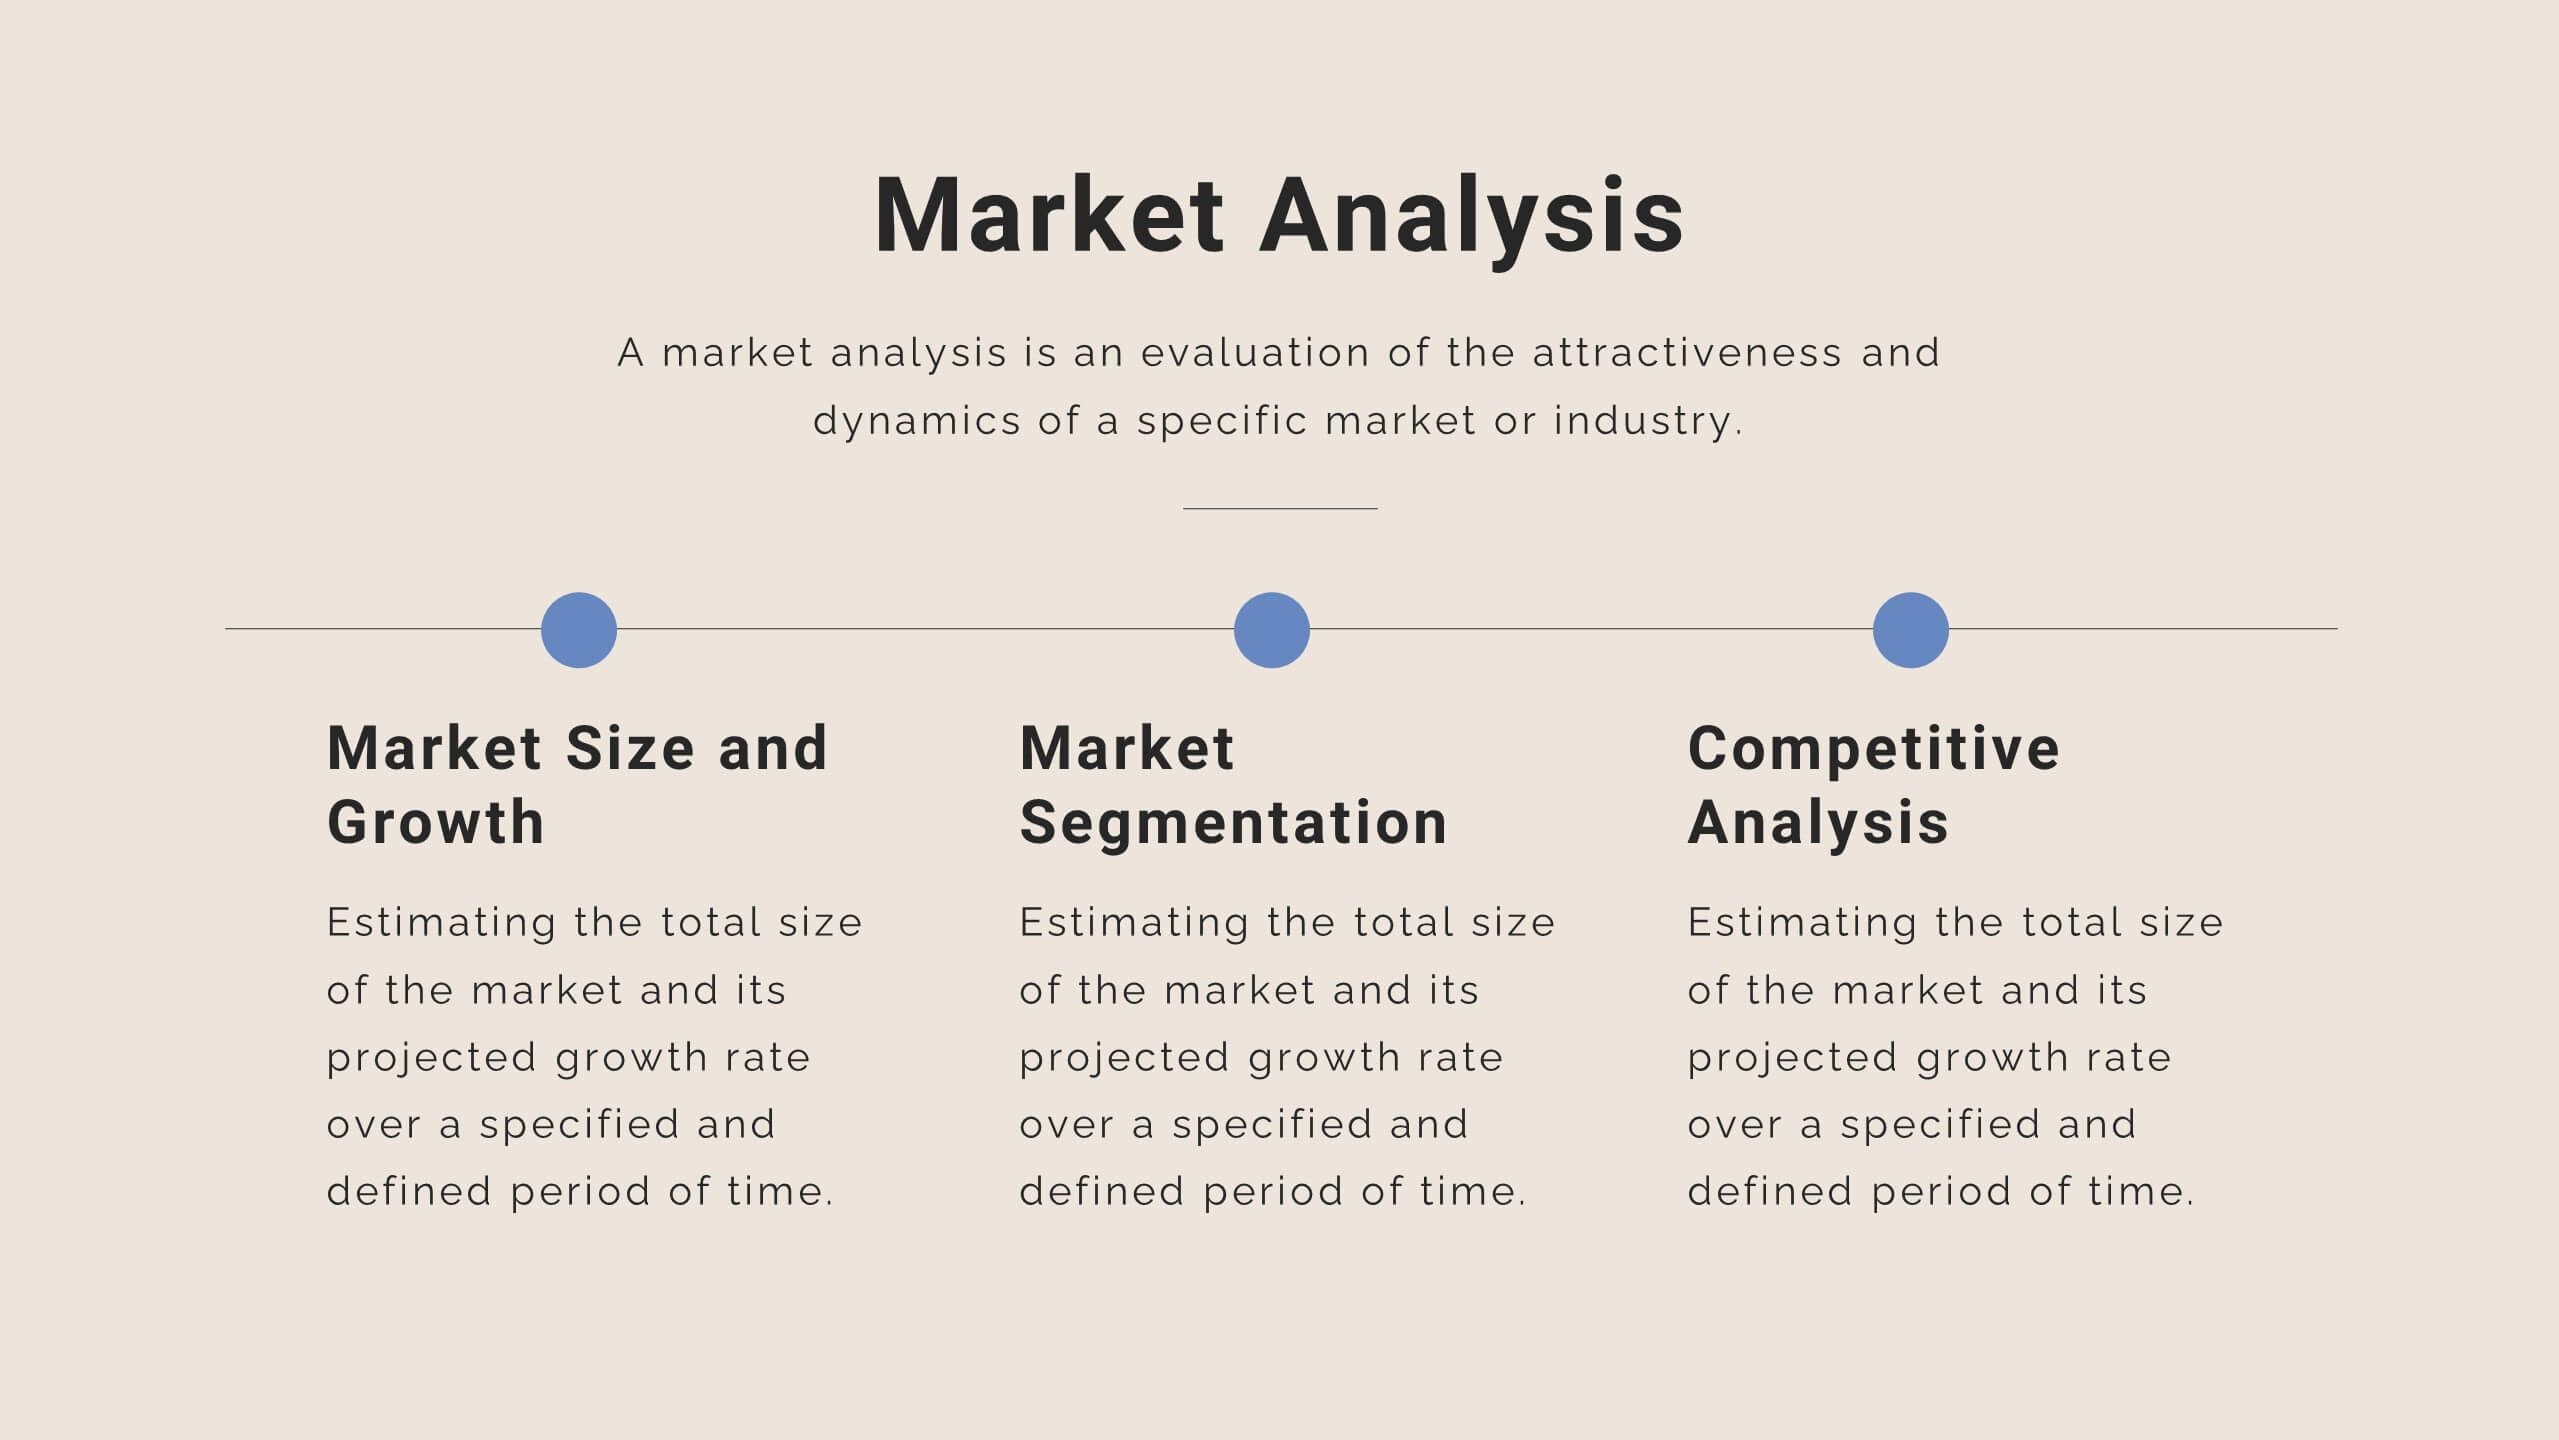
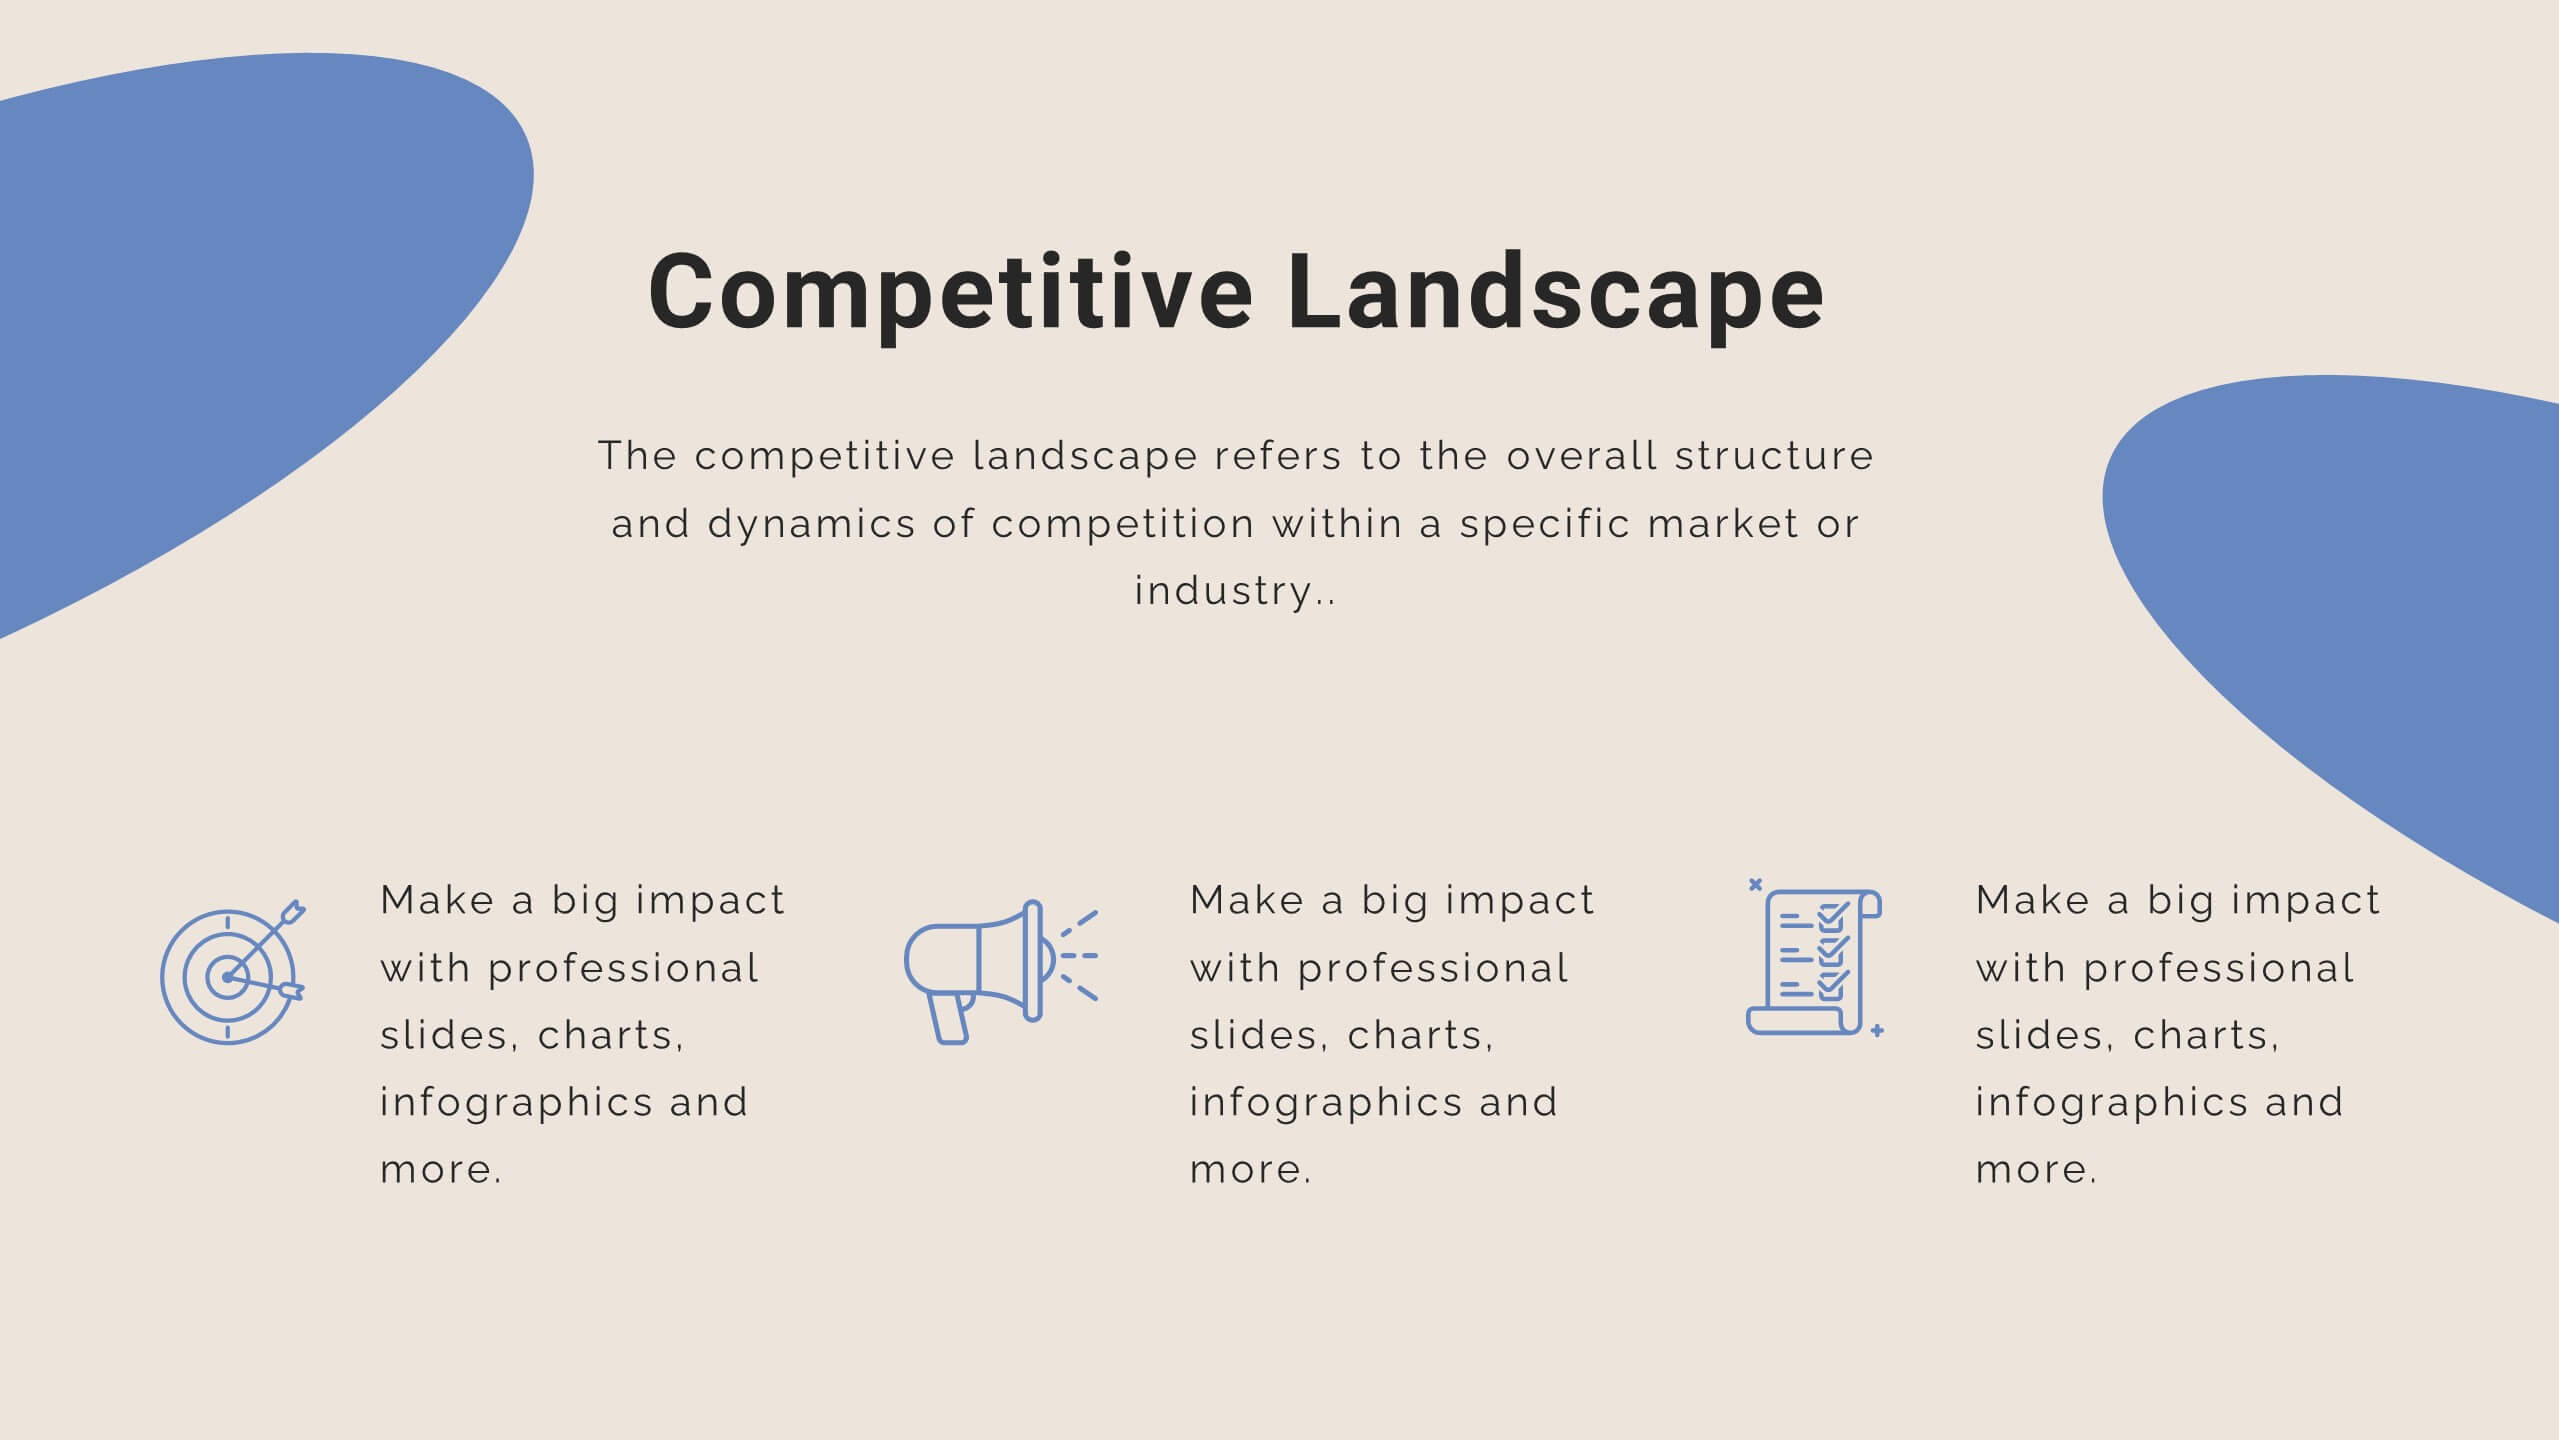
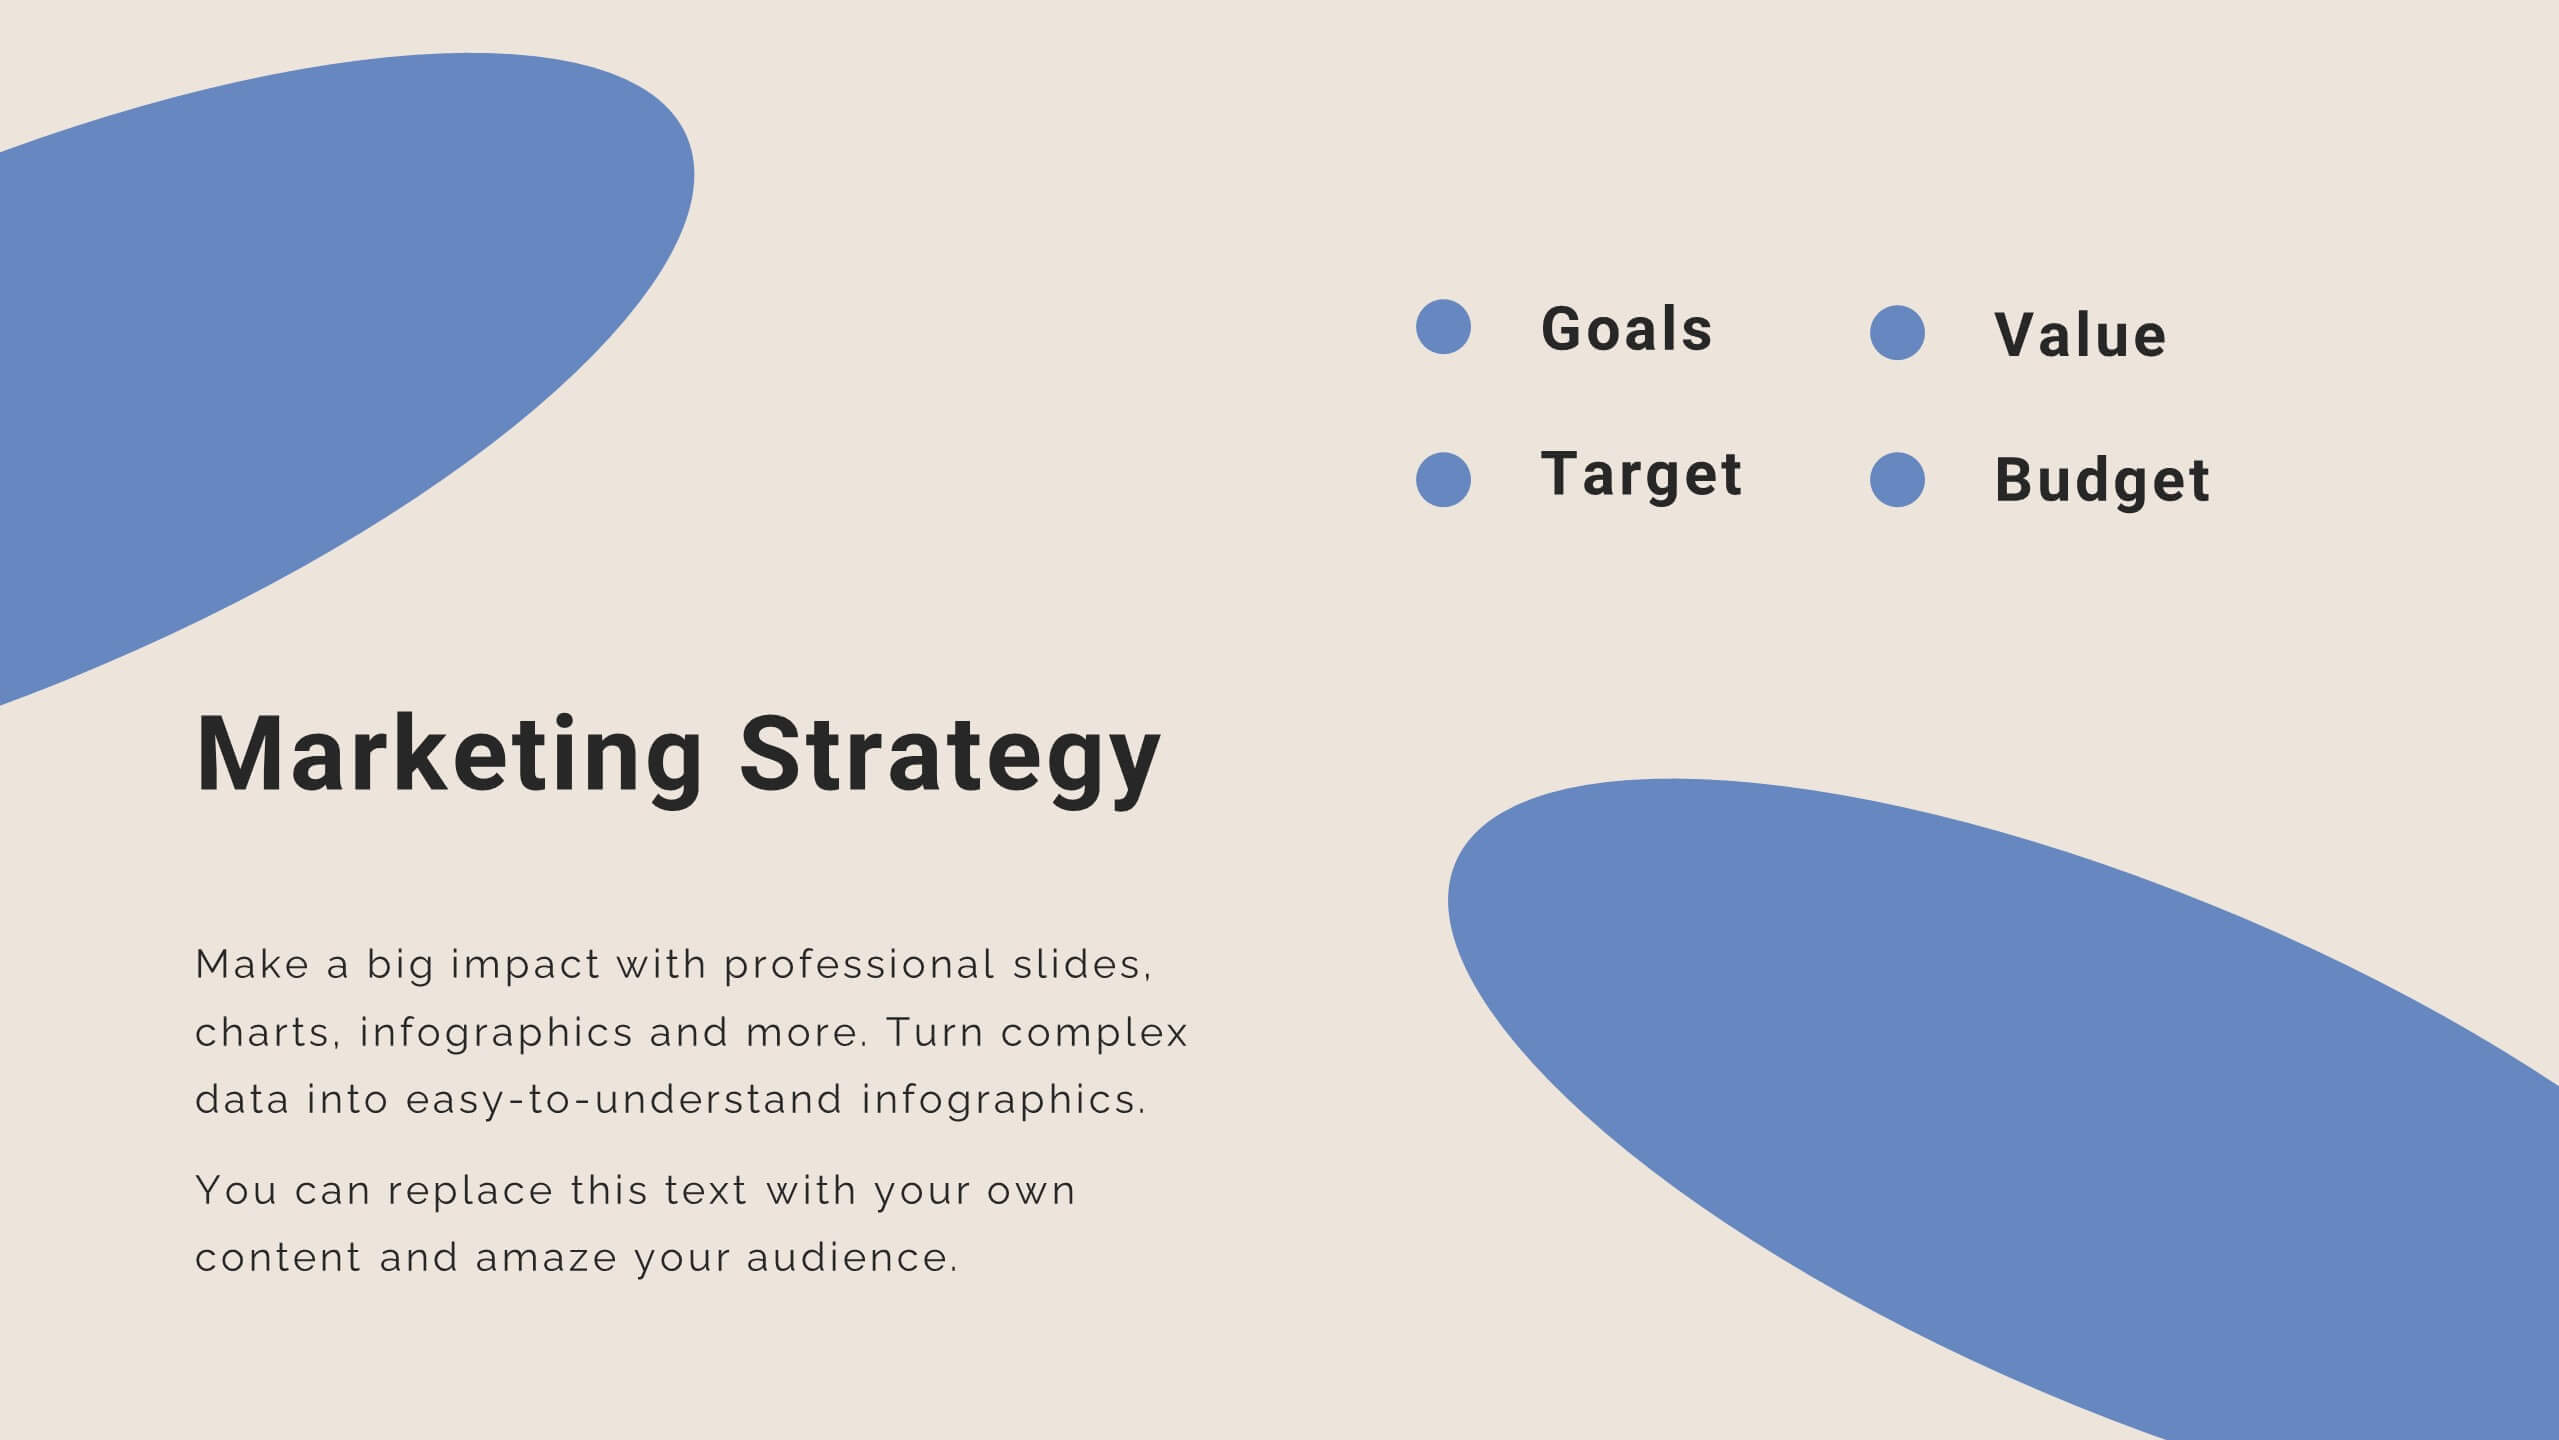
Kitsune Startup Strategy Presentation
This startup strategy template is designed for clear communication of business vision, target market, and unique value proposition. It also includes slides for marketing strategies, team introduction, and financial overview. Its clean, professional layout makes it ideal for investors or stakeholders. Compatible with PowerPoint, Keynote, and Google Slides for easy customization.


26 slides
Understanding the Stock Market Presentation
Step into the exciting world of finance with our dynamic and sleek presentation template, perfect for understanding the stock market! This comprehensive guide simplifies complex financial concepts, making it an ideal resource for beginners, students, and professionals. Featuring a sophisticated collection of slides, this template covers key topics such as market trends, investment strategies, and financial analysis. The design integrates bold colors, sharp graphics, and well-organized layouts to keep your audience engaged and informed. Infographics and charts break down intricate data, while mockups offer realistic previews of stock market tools. Fully customizable and versatile, this template can be adapted to suit various presentation needs and styles. It is compatible with PowerPoint, Keynote, and Google Slides, ensuring smooth and professional presentations across different platforms. Perfect for financial workshops, educational seminars, or anyone looking to deepen their understanding of the stock market.


22 slides
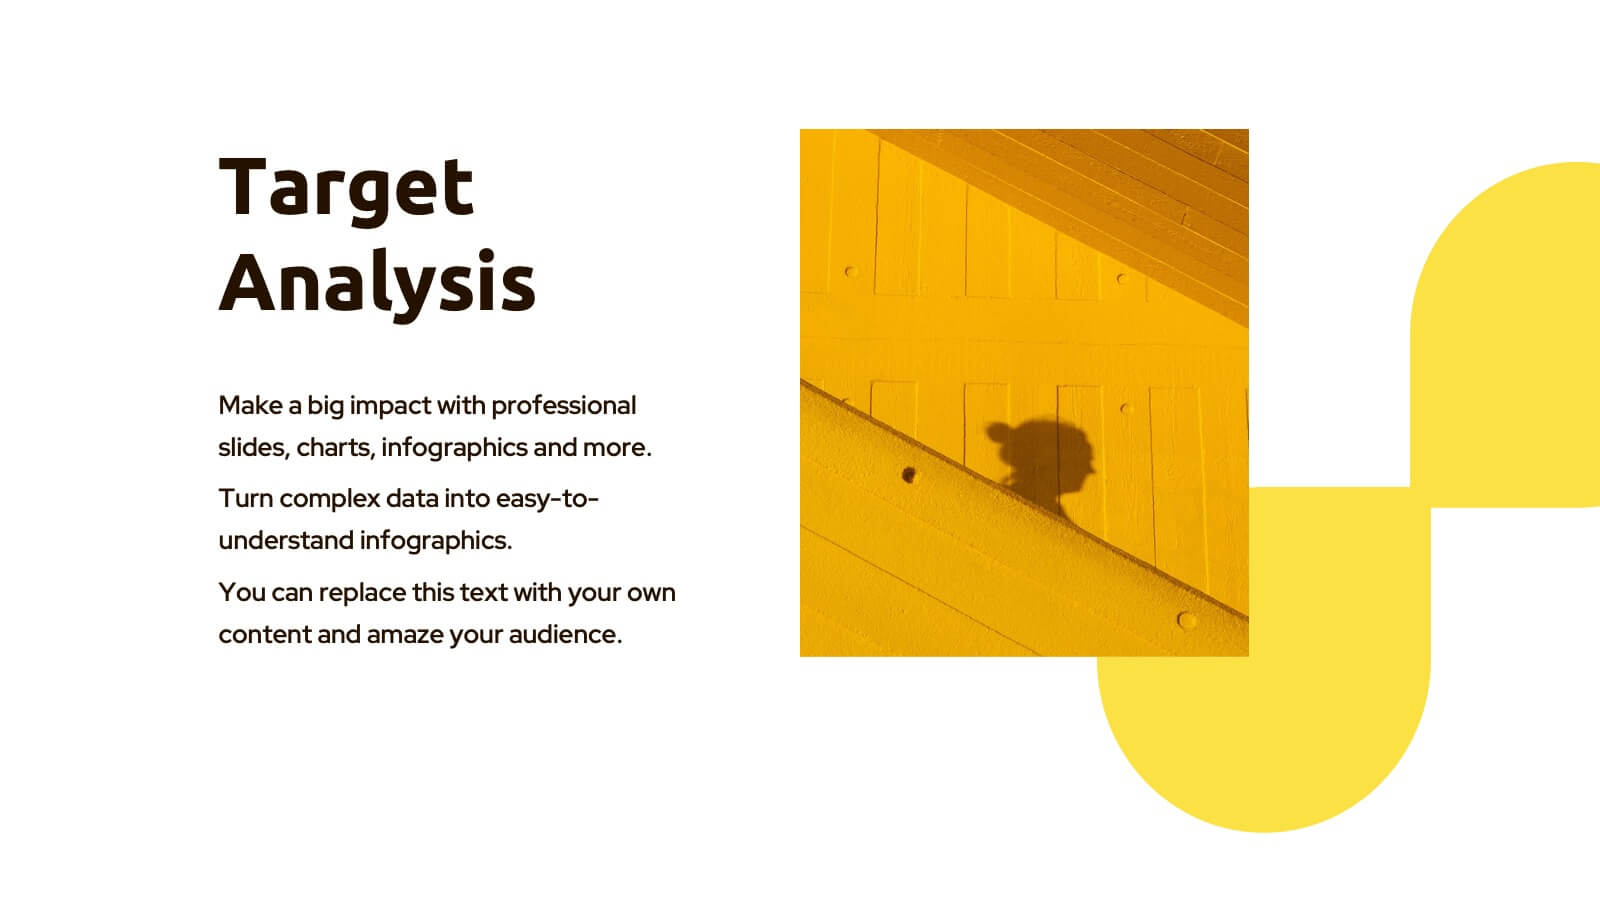
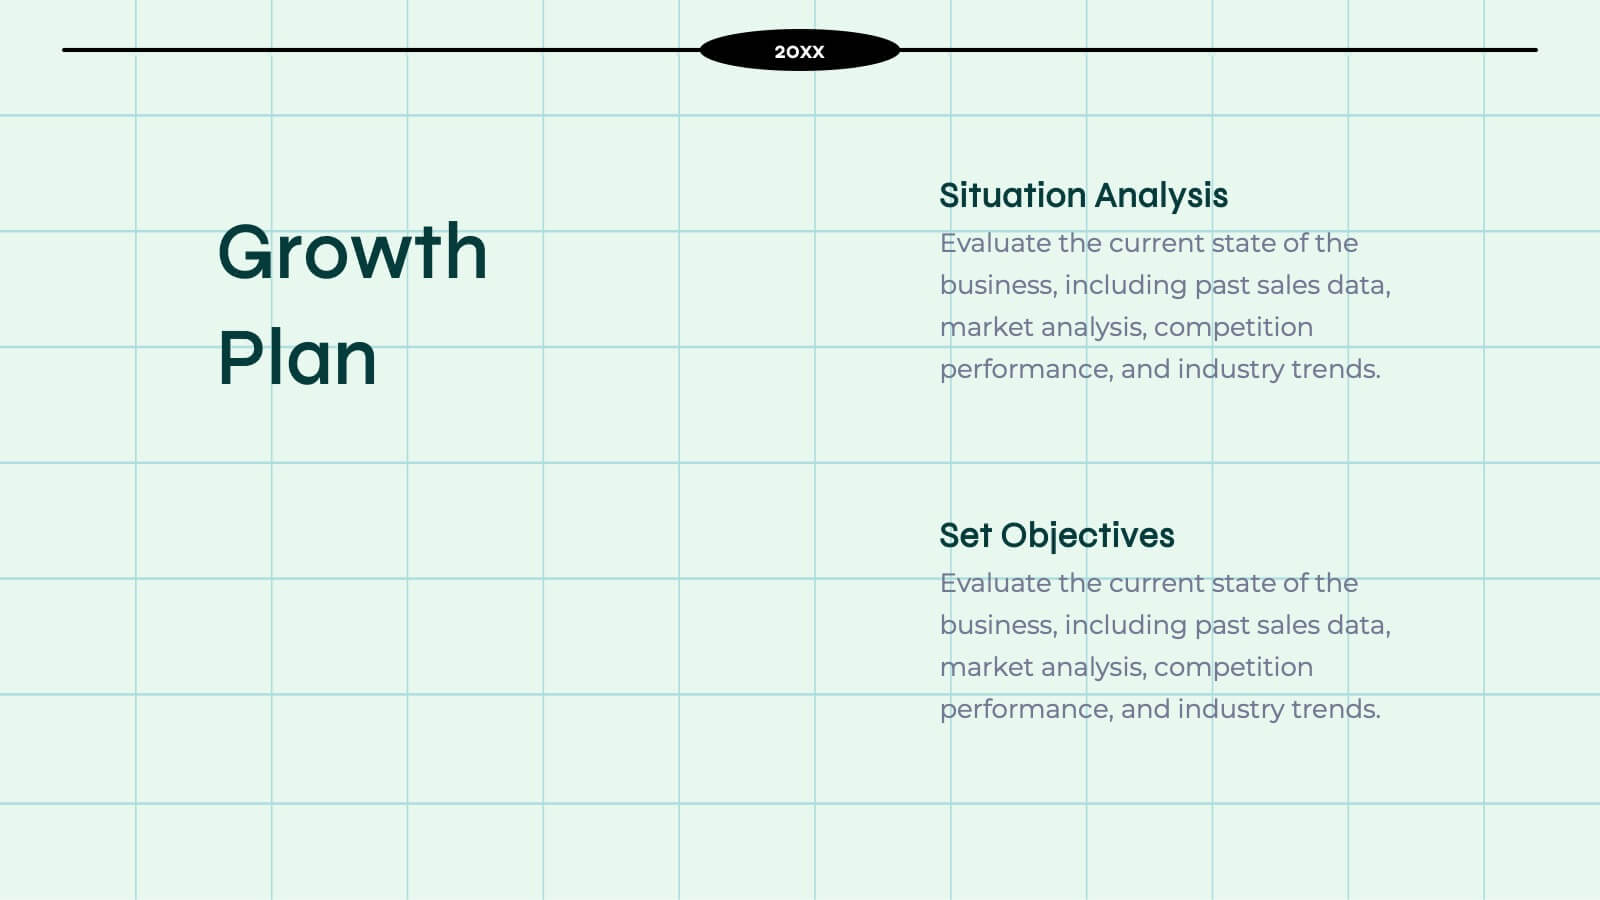
Mystic Startup Strategy Presentation
Launch your startup with confidence using this comprehensive funding proposal template! Perfect for showcasing your mission, vision, and business model to potential investors. Highlight your unique value proposition and growth plan with style. Compatible with PowerPoint, Keynote, and Google Slides, this template ensures your pitch stands out and secures the funding you need.


20 slides
Syntax Creative Design Report Presentation
The Design Presentation Template empowers you to deliver visually stunning and organized presentations. With 20 fully editable slides, it includes sections like design briefs, elements, processes, mood boards, prototypes, and timelines. Tailored for designers and creative teams, it's compatible with PowerPoint, Keynote, and Google Slides for seamless customization and impact.


6 slides
IT Architecture Enterprise Infographics
Gain insights into Enterprise IT Architecture with our customizable infographic template. This template is fully compatible with popular presentation software like PowerPoint, Keynote, and Google Slides, allowing you to easily customize it to illustrate and communicate various aspects of enterprise IT architecture. The Enterprise IT Architecture infographic template offers a visually engaging platform to explore and explain the architectural components, frameworks, and strategies used in large organizations. Whether you're an IT professional, business leader, or simply interested in enterprise technology, this template provides a user-friendly canvas to create informative presentations and educational materials. Enhance your knowledge of Enterprise IT Architecture with this SEO-optimized infographic template, thoughtfully designed for clarity and ease of use. Customize it to highlight key principles, architectural layers, integration strategies, and best practices, ensuring that your audience gains a comprehensive understanding of this critical field. Start crafting your personalized infographic today to delve into the world of Enterprise IT Architecture.