


Features
- 5 Unique slides
- Fully editable and easy to edit in Microsoft Powerpoint, Keynote and Google Slides
- 16:9 widescreen layout
- Clean and professional designs
- Export to JPG, PDF or send by email


Do you have any questions?
Recommend


8 slides
Restaurant Menu Design Presentation
Showcase your menu items with style using this bold, modern restaurant menu infographic. Designed to highlight pricing, meal categories, and featured items, this layout is perfect for restaurant presentations, promotions, or digital signage. Includes editable text areas and food-themed icons. Works seamlessly in PowerPoint, Keynote, and Google Slides.


4 slides
Business Information Security Compliance Presentation
Ensure your systems meet security standards with the Business Information Security Compliance presentation slide. Designed with a central cloud and laptop graphic surrounded by icons representing data, user access, encryption, and compliance checks, this layout is perfect for illustrating IT governance, risk management, and data protection protocols. Fully customizable in PowerPoint, Keynote, and Google Slides.


7 slides
Annual Report Infographics Presentation Template
Annual reports are comprehensive documents designed to provide readers with information about a company's performance in the preceding year with a focus on all major aspects of its operations. They help investors, competitors and other stakeholders understand how well a business is performing. This template is designed to help users produce annual reports for their company. Annual reports provide insights into the company's direction in the preceding year. This template includes many features to make your document as professional as possible and includes various charts and graphs.


20 slides
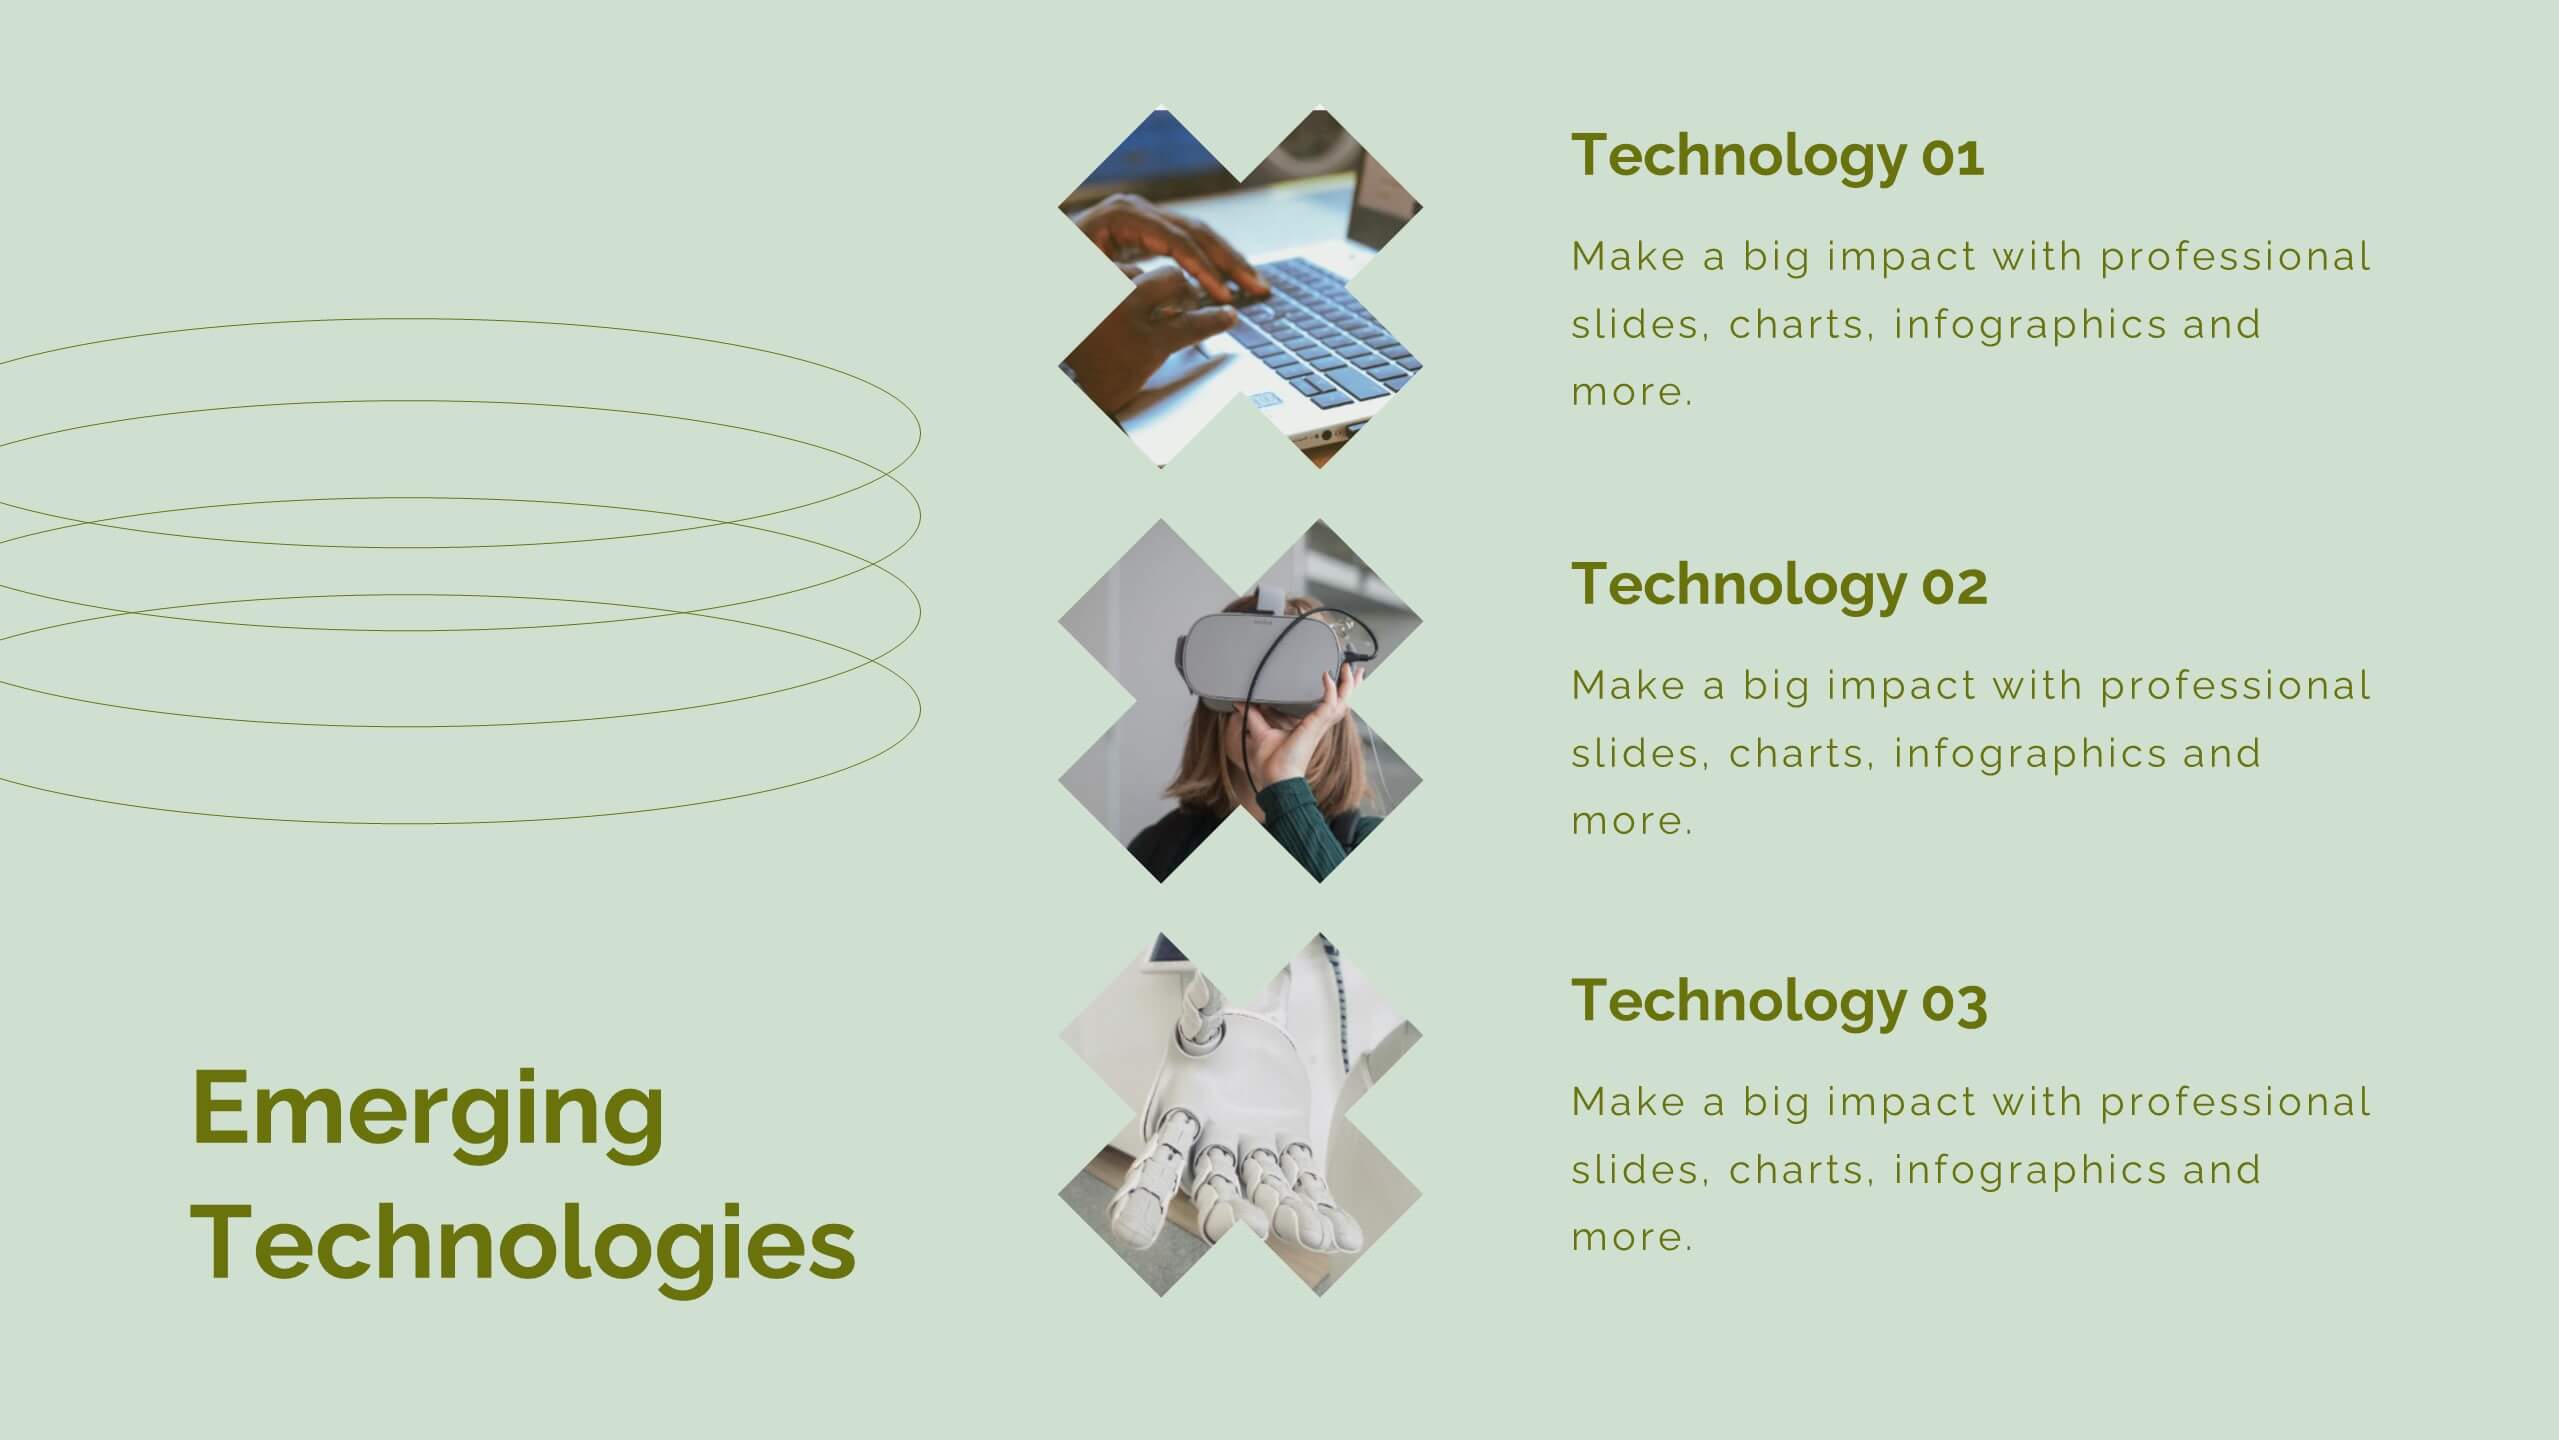
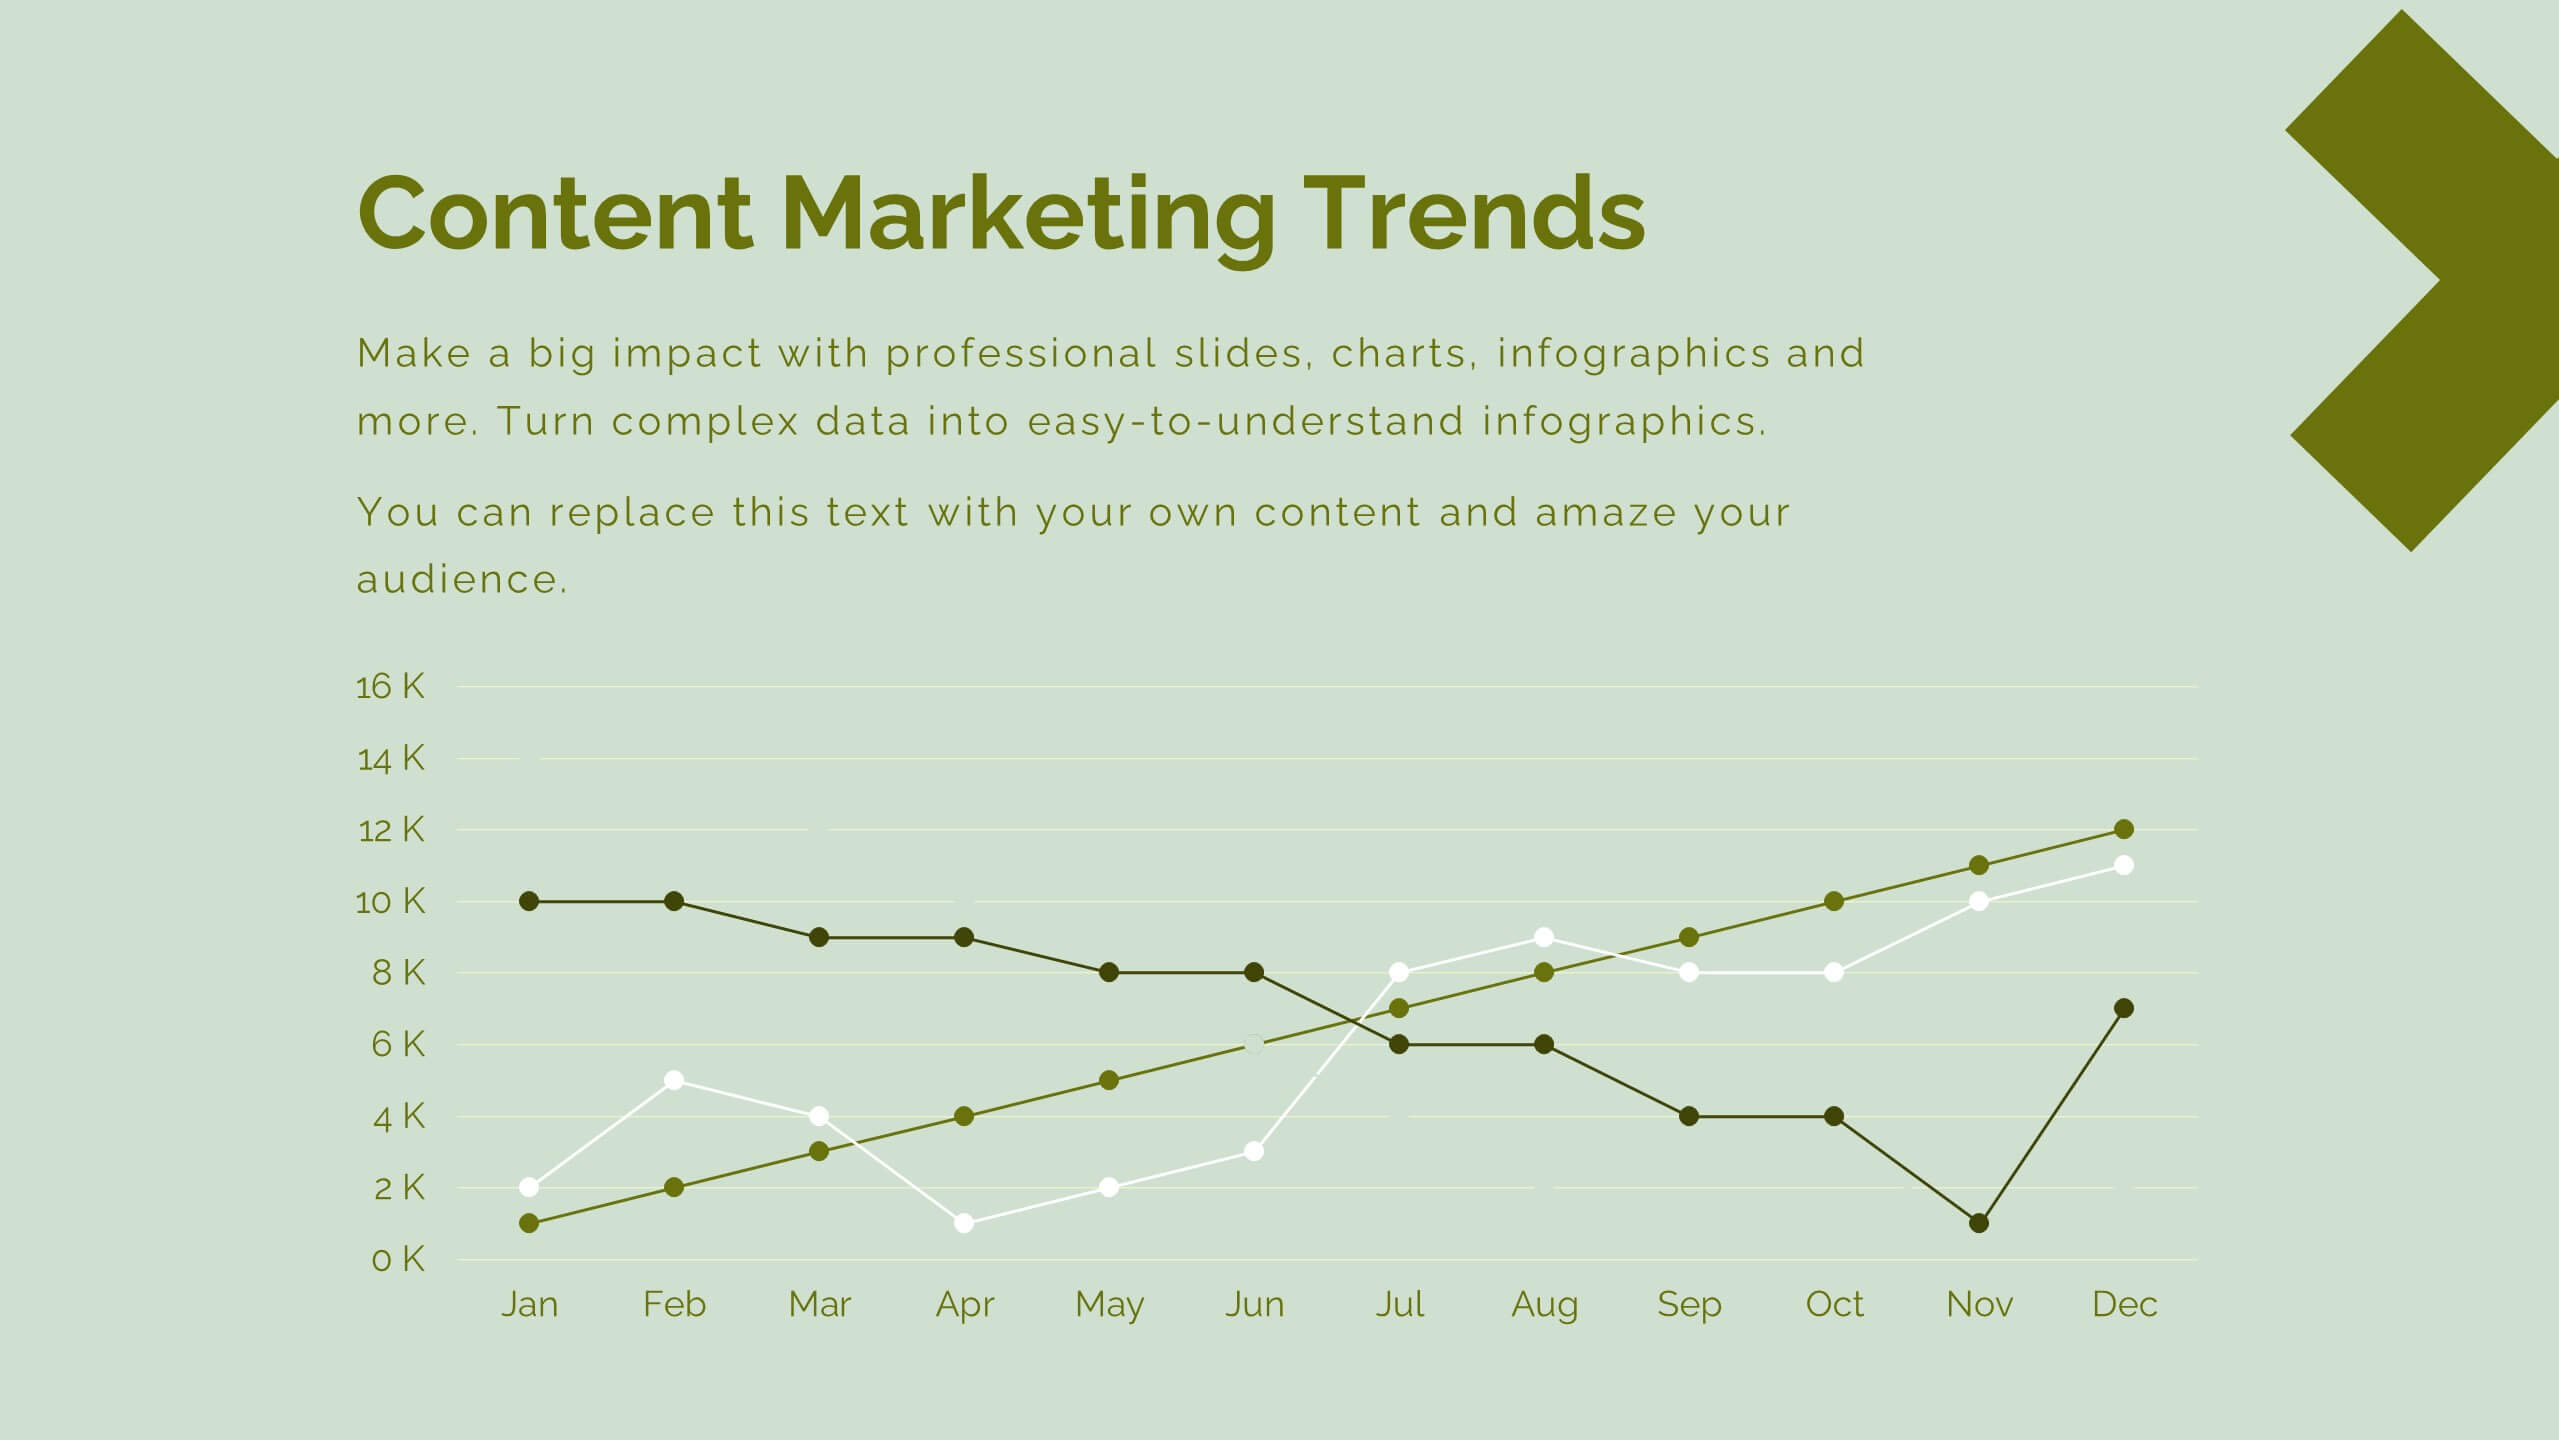
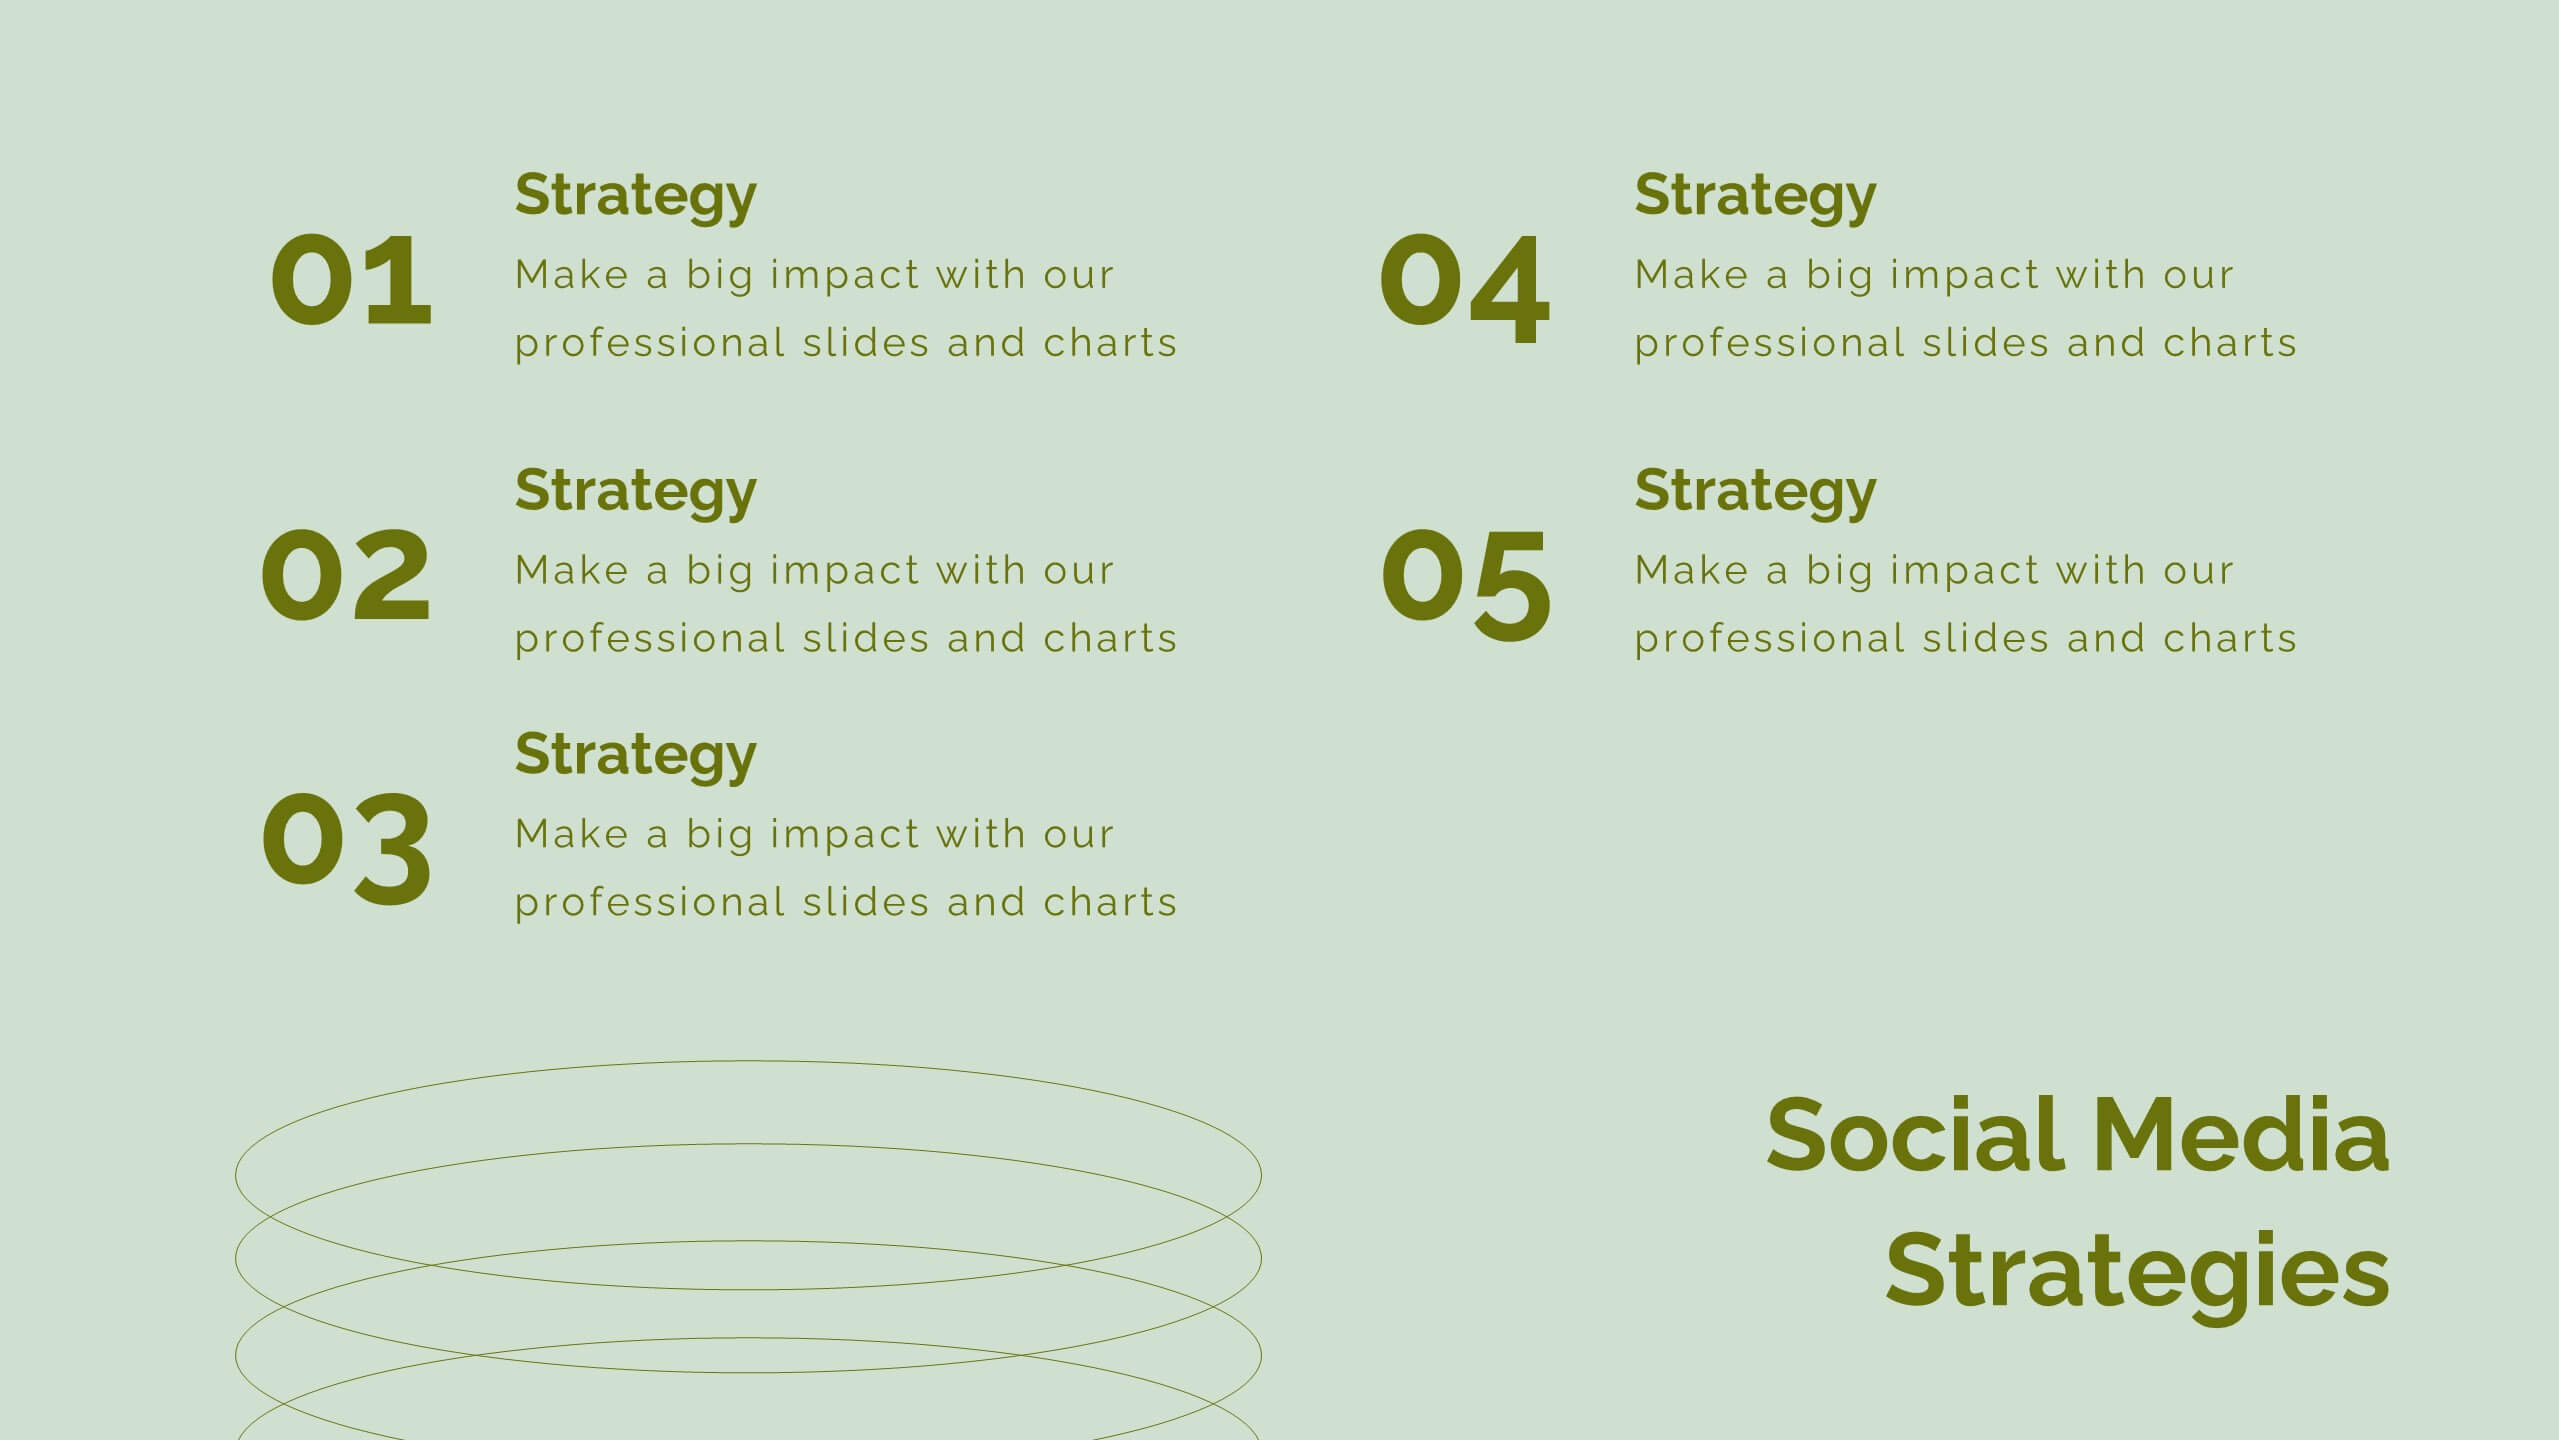
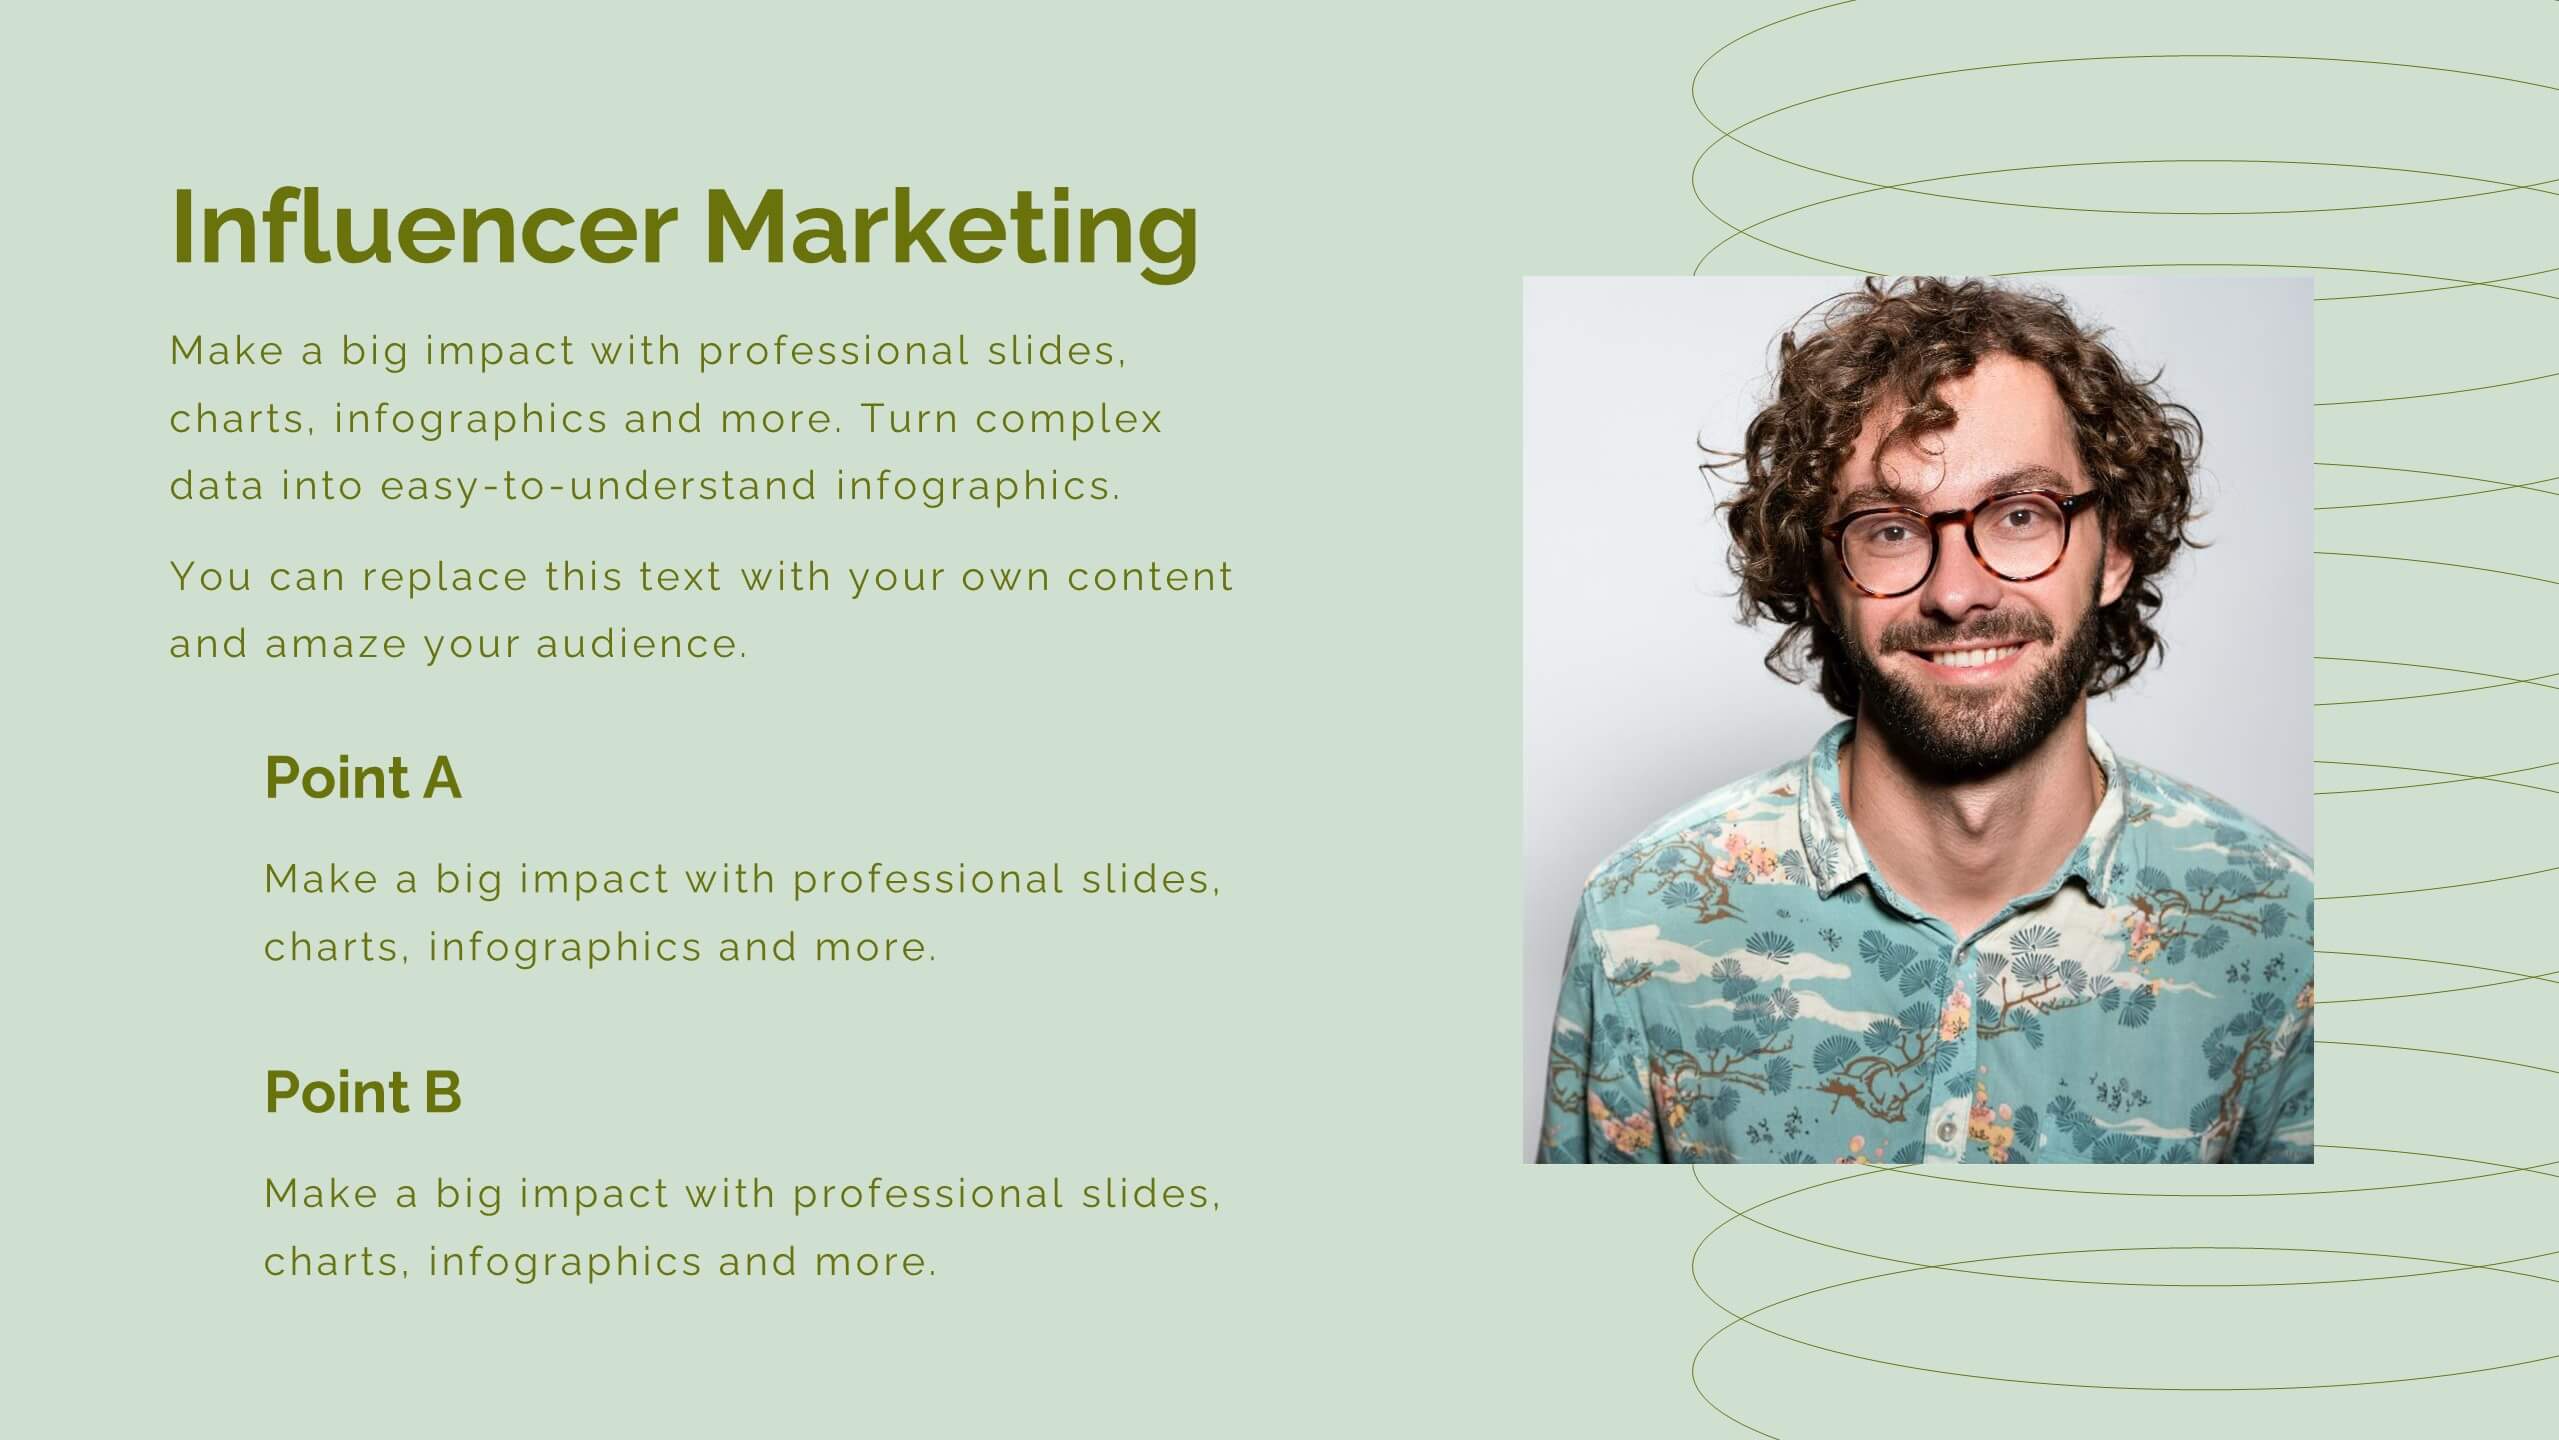
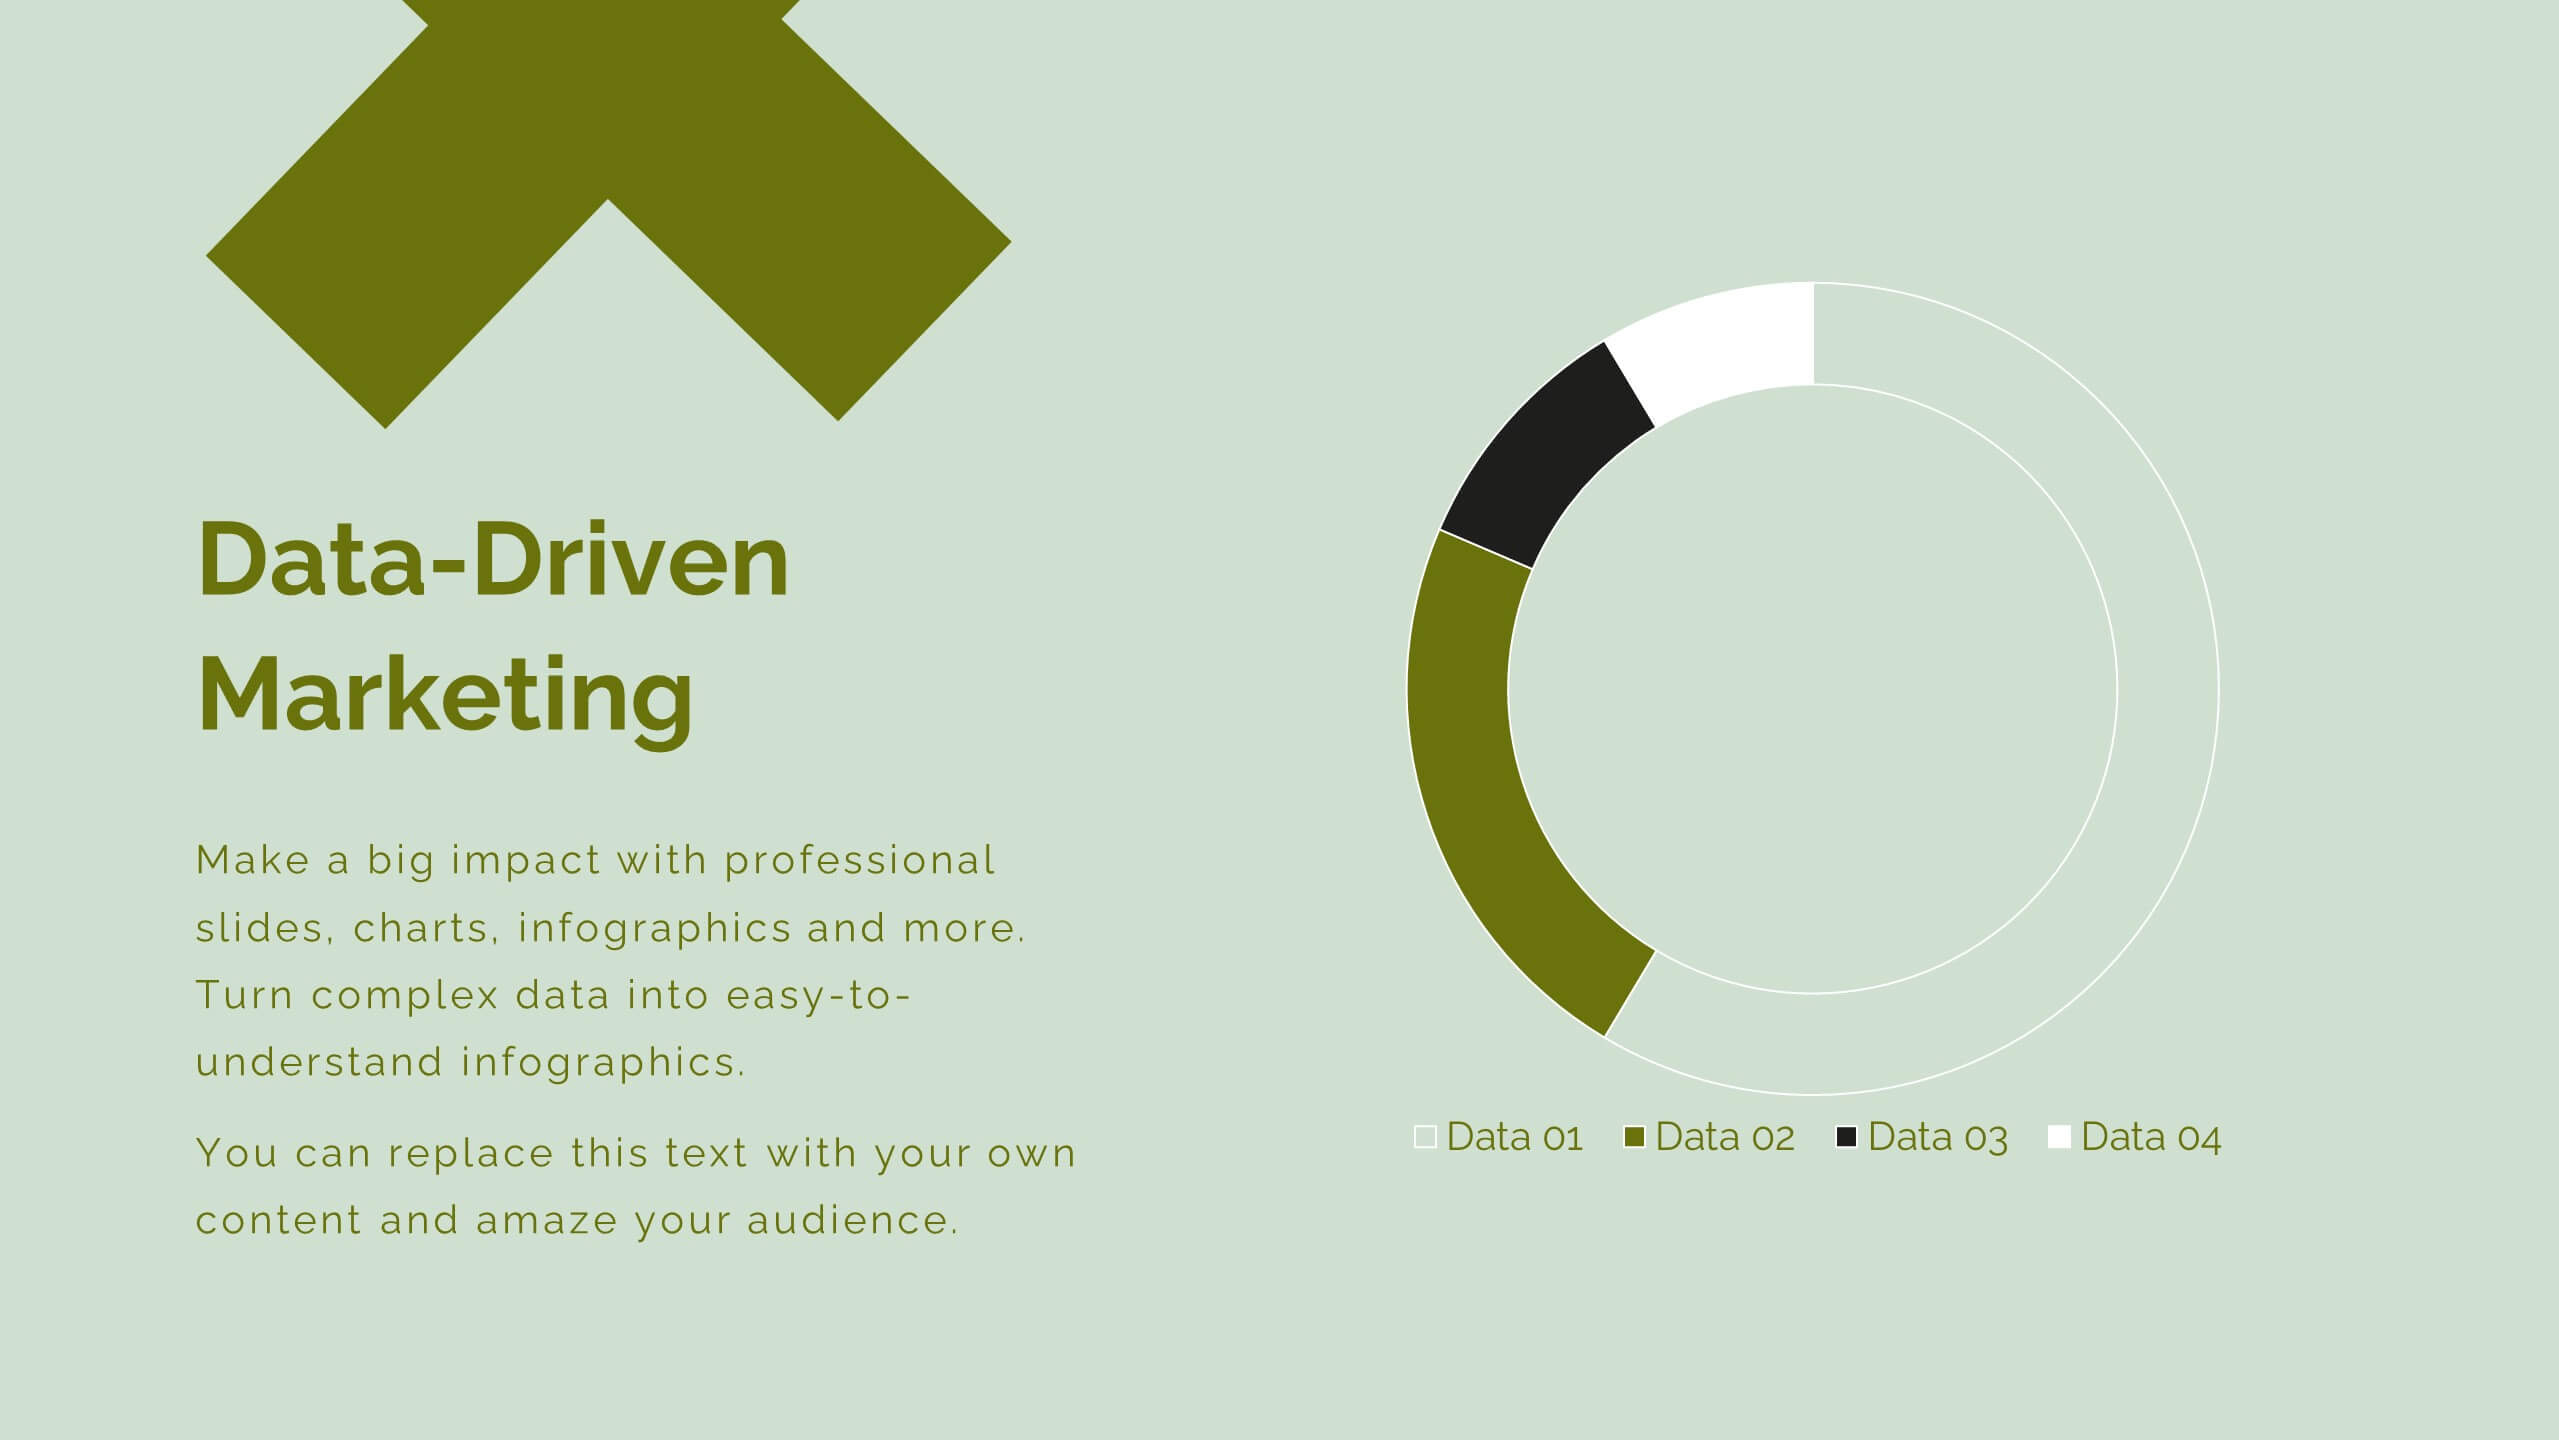
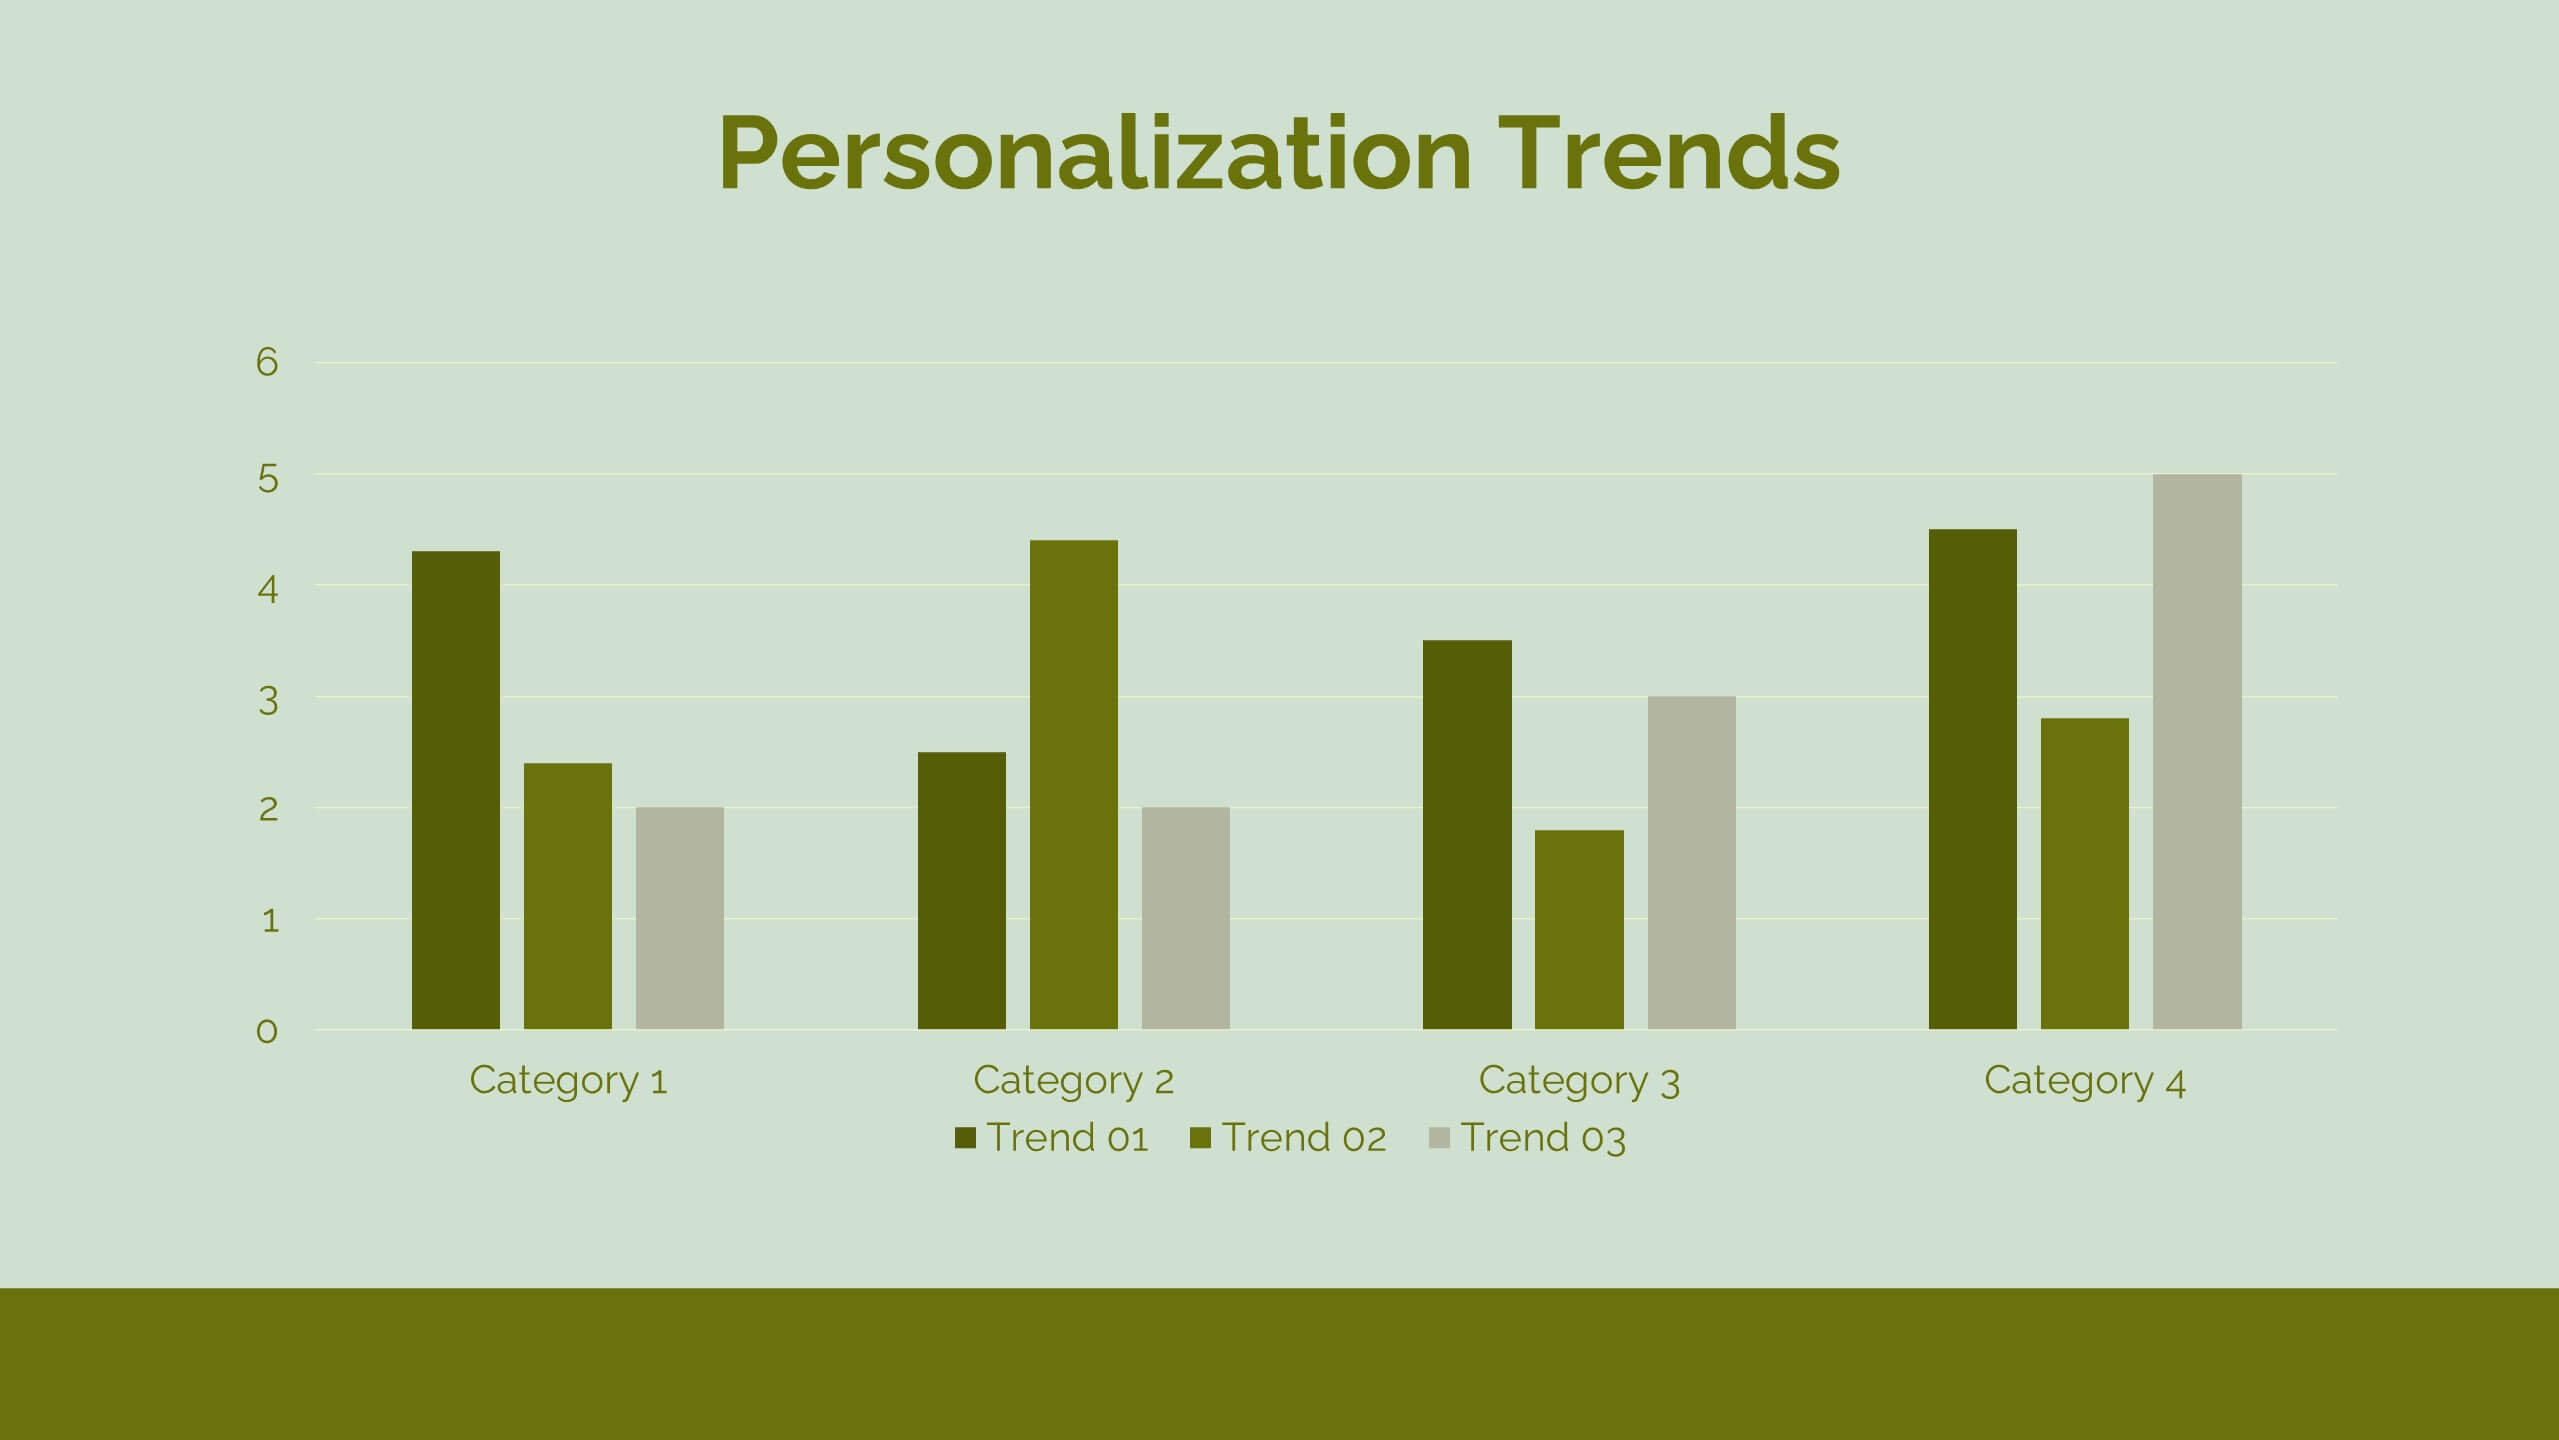
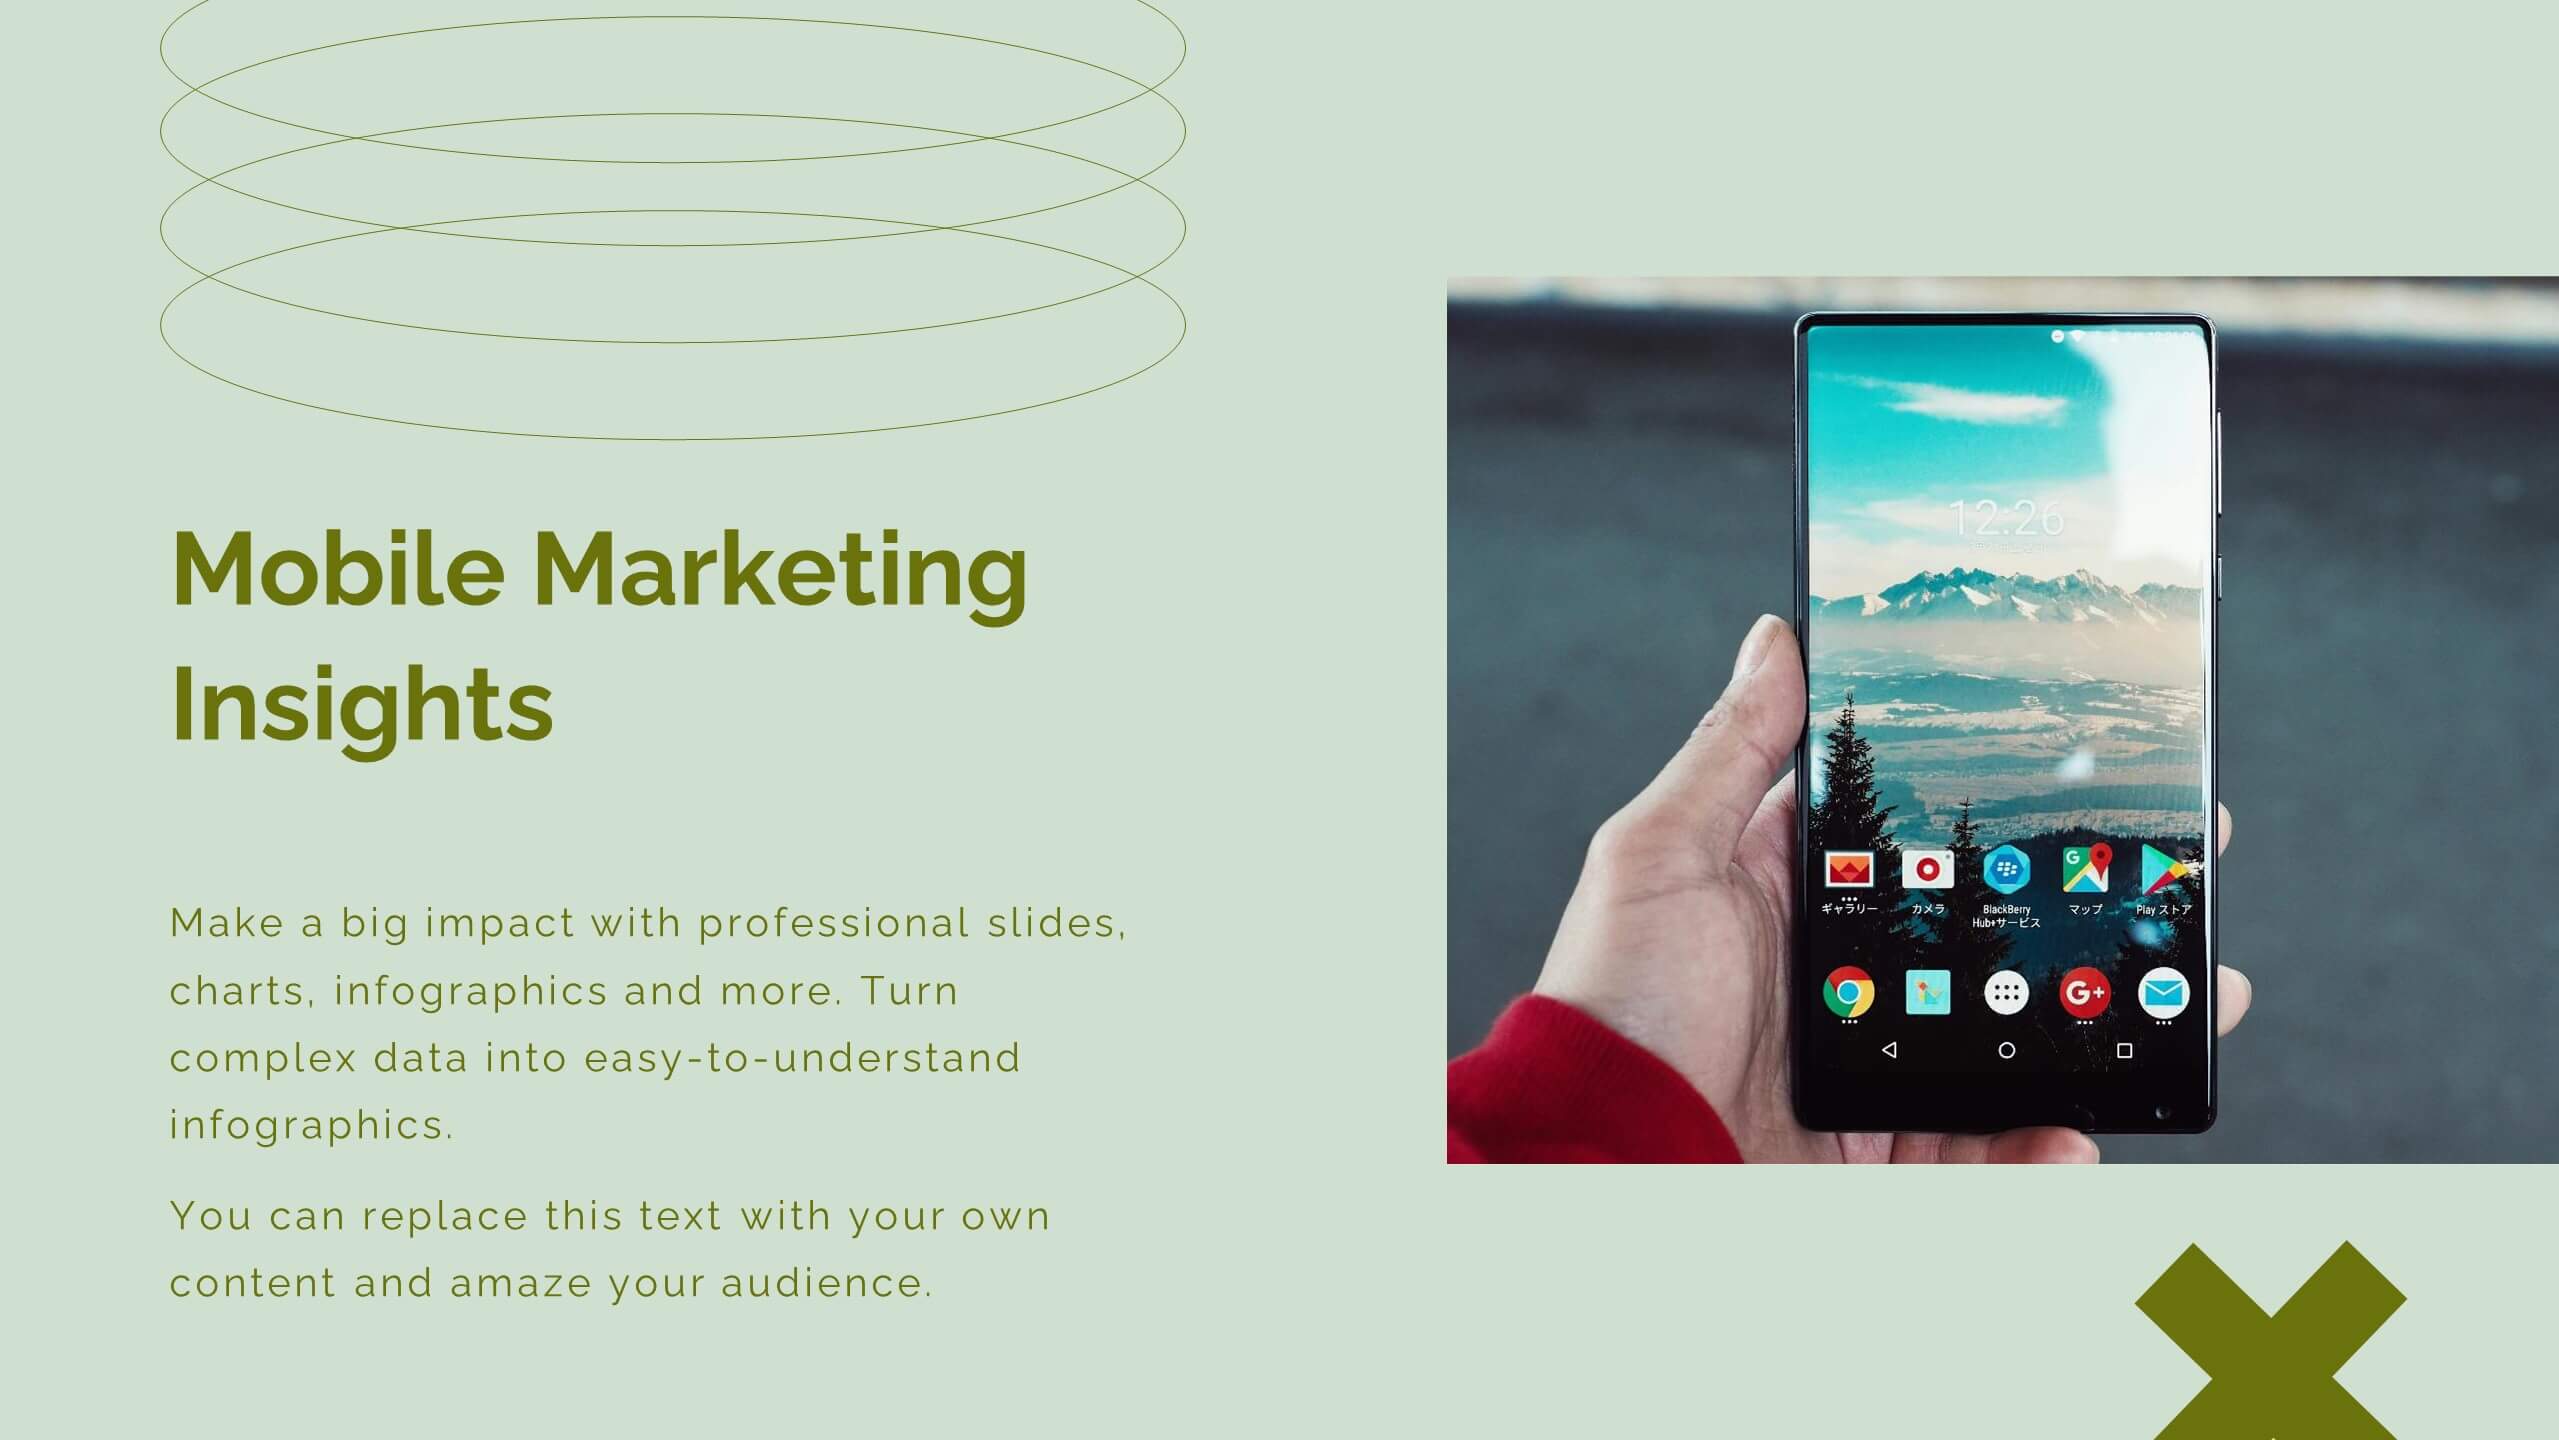
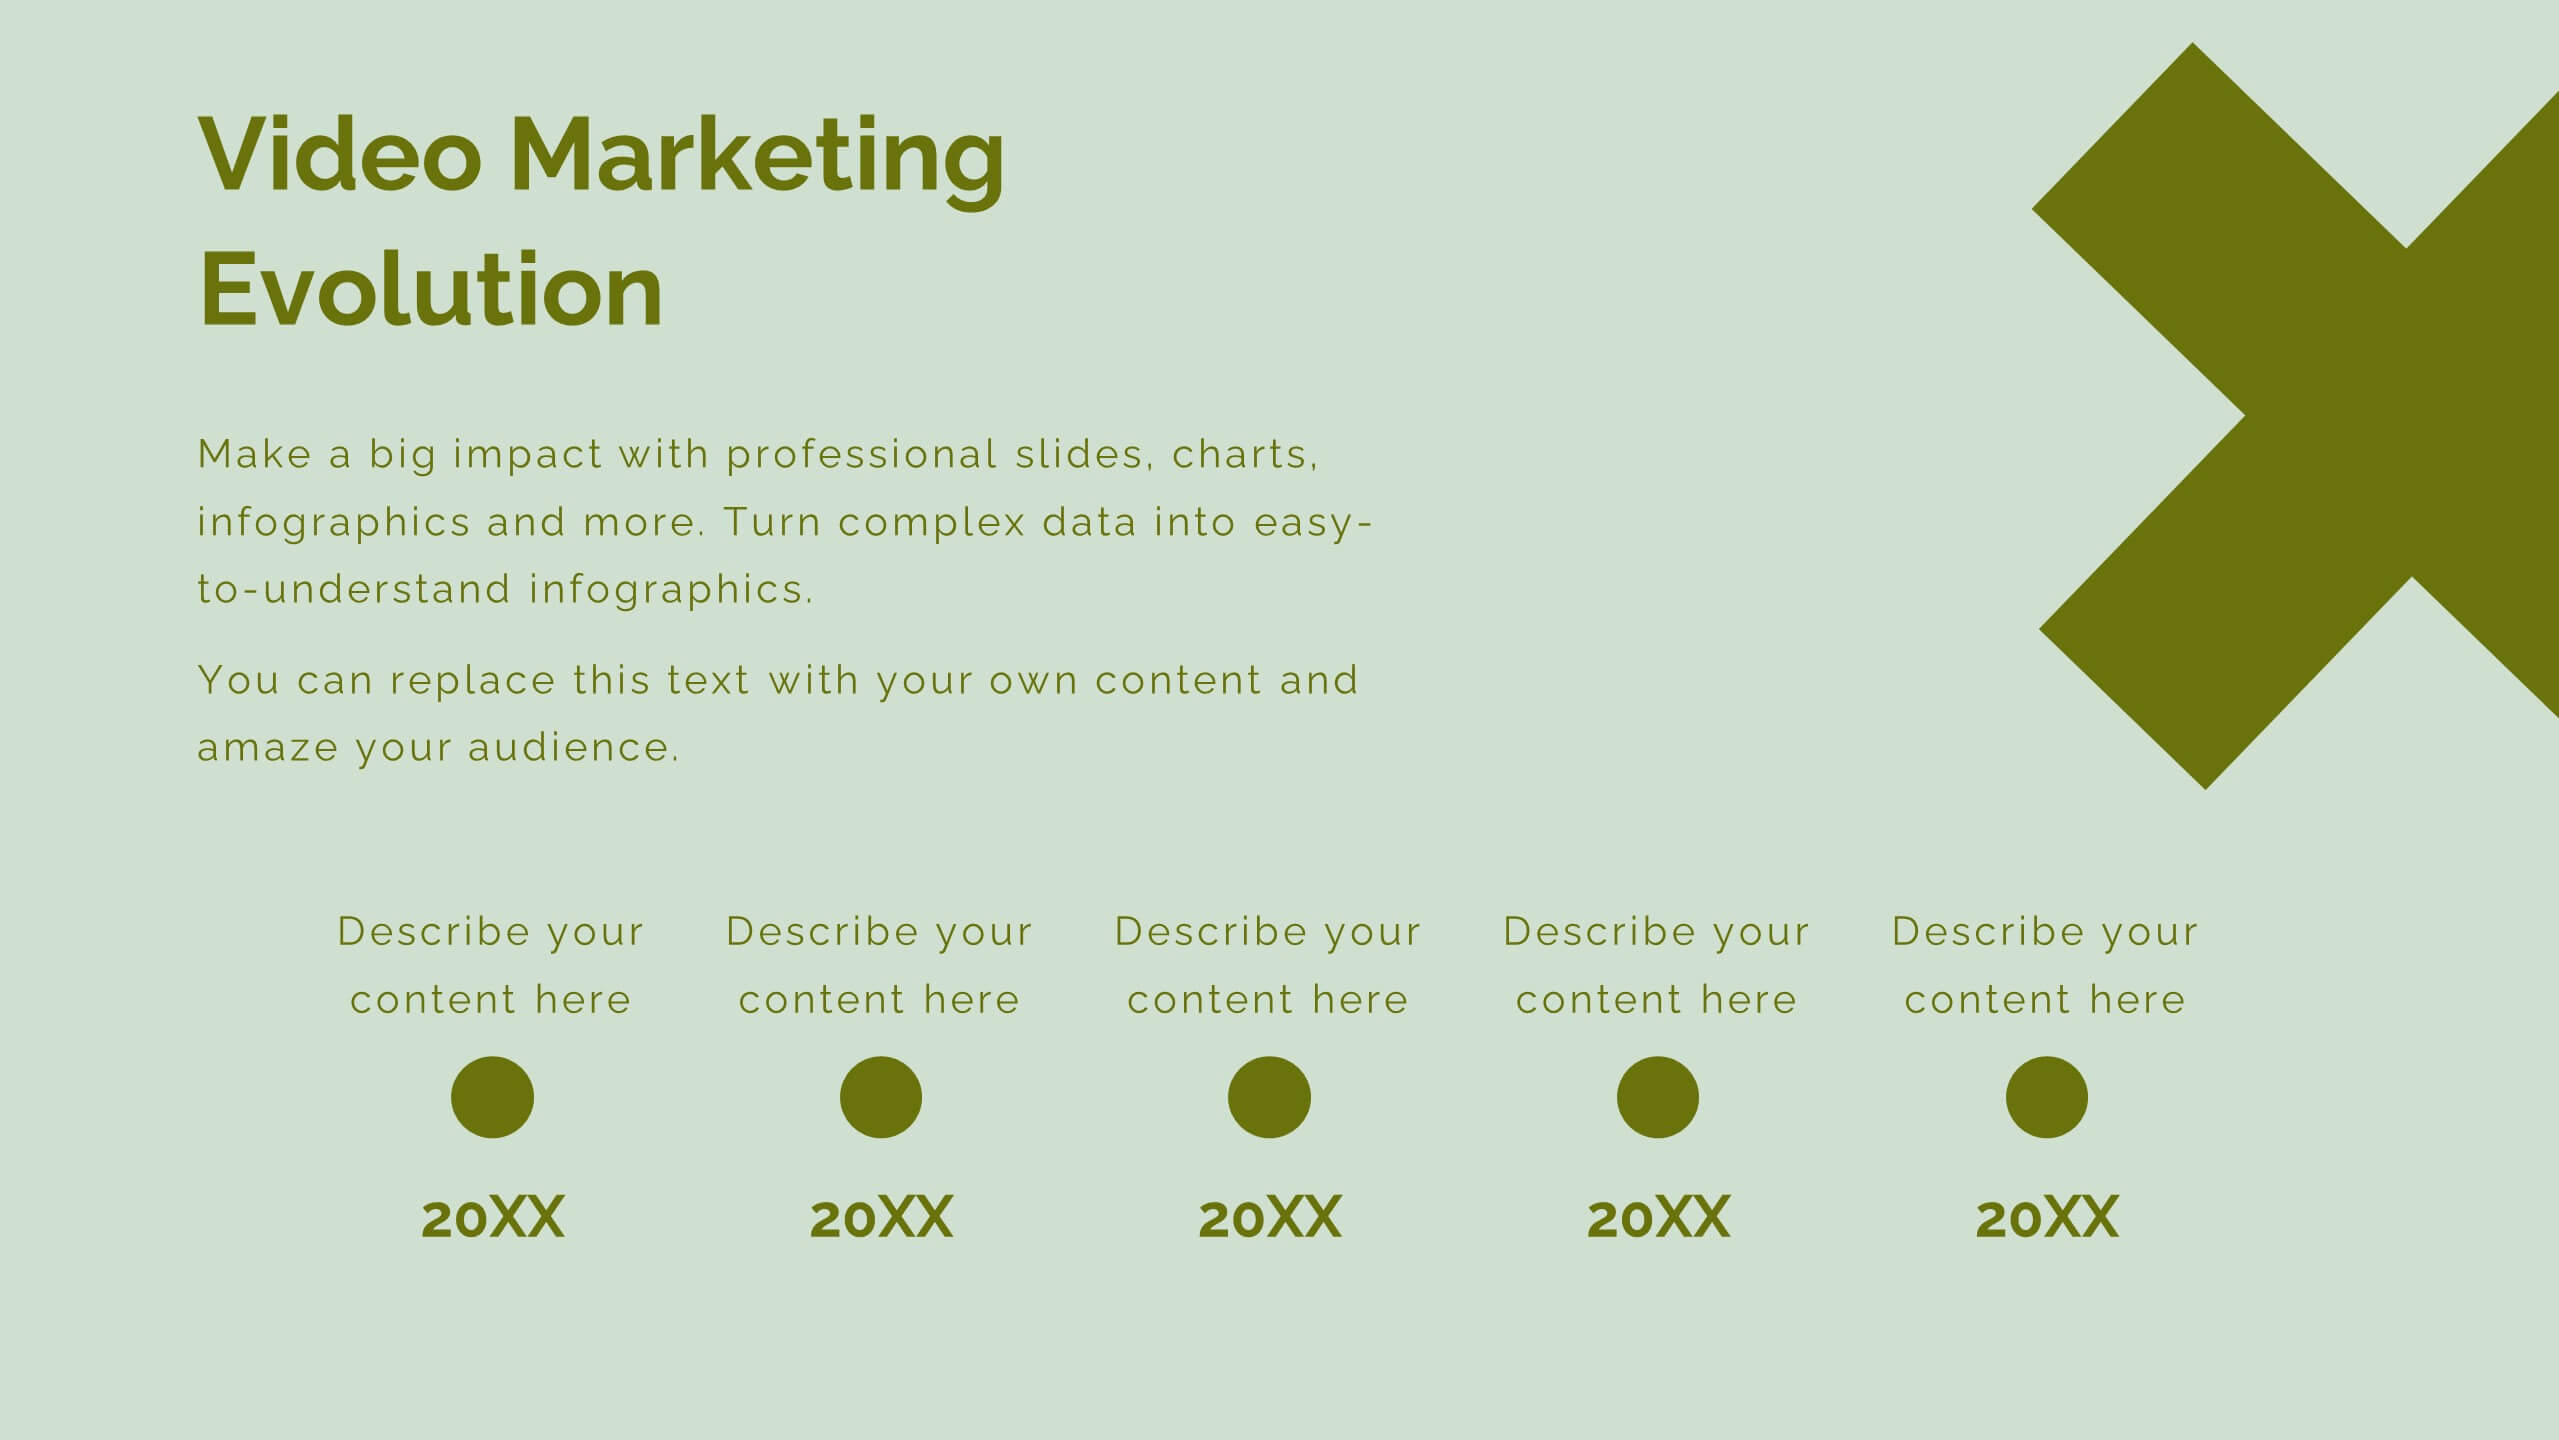
Aura Digital Marketing Strategy Plan Presentation
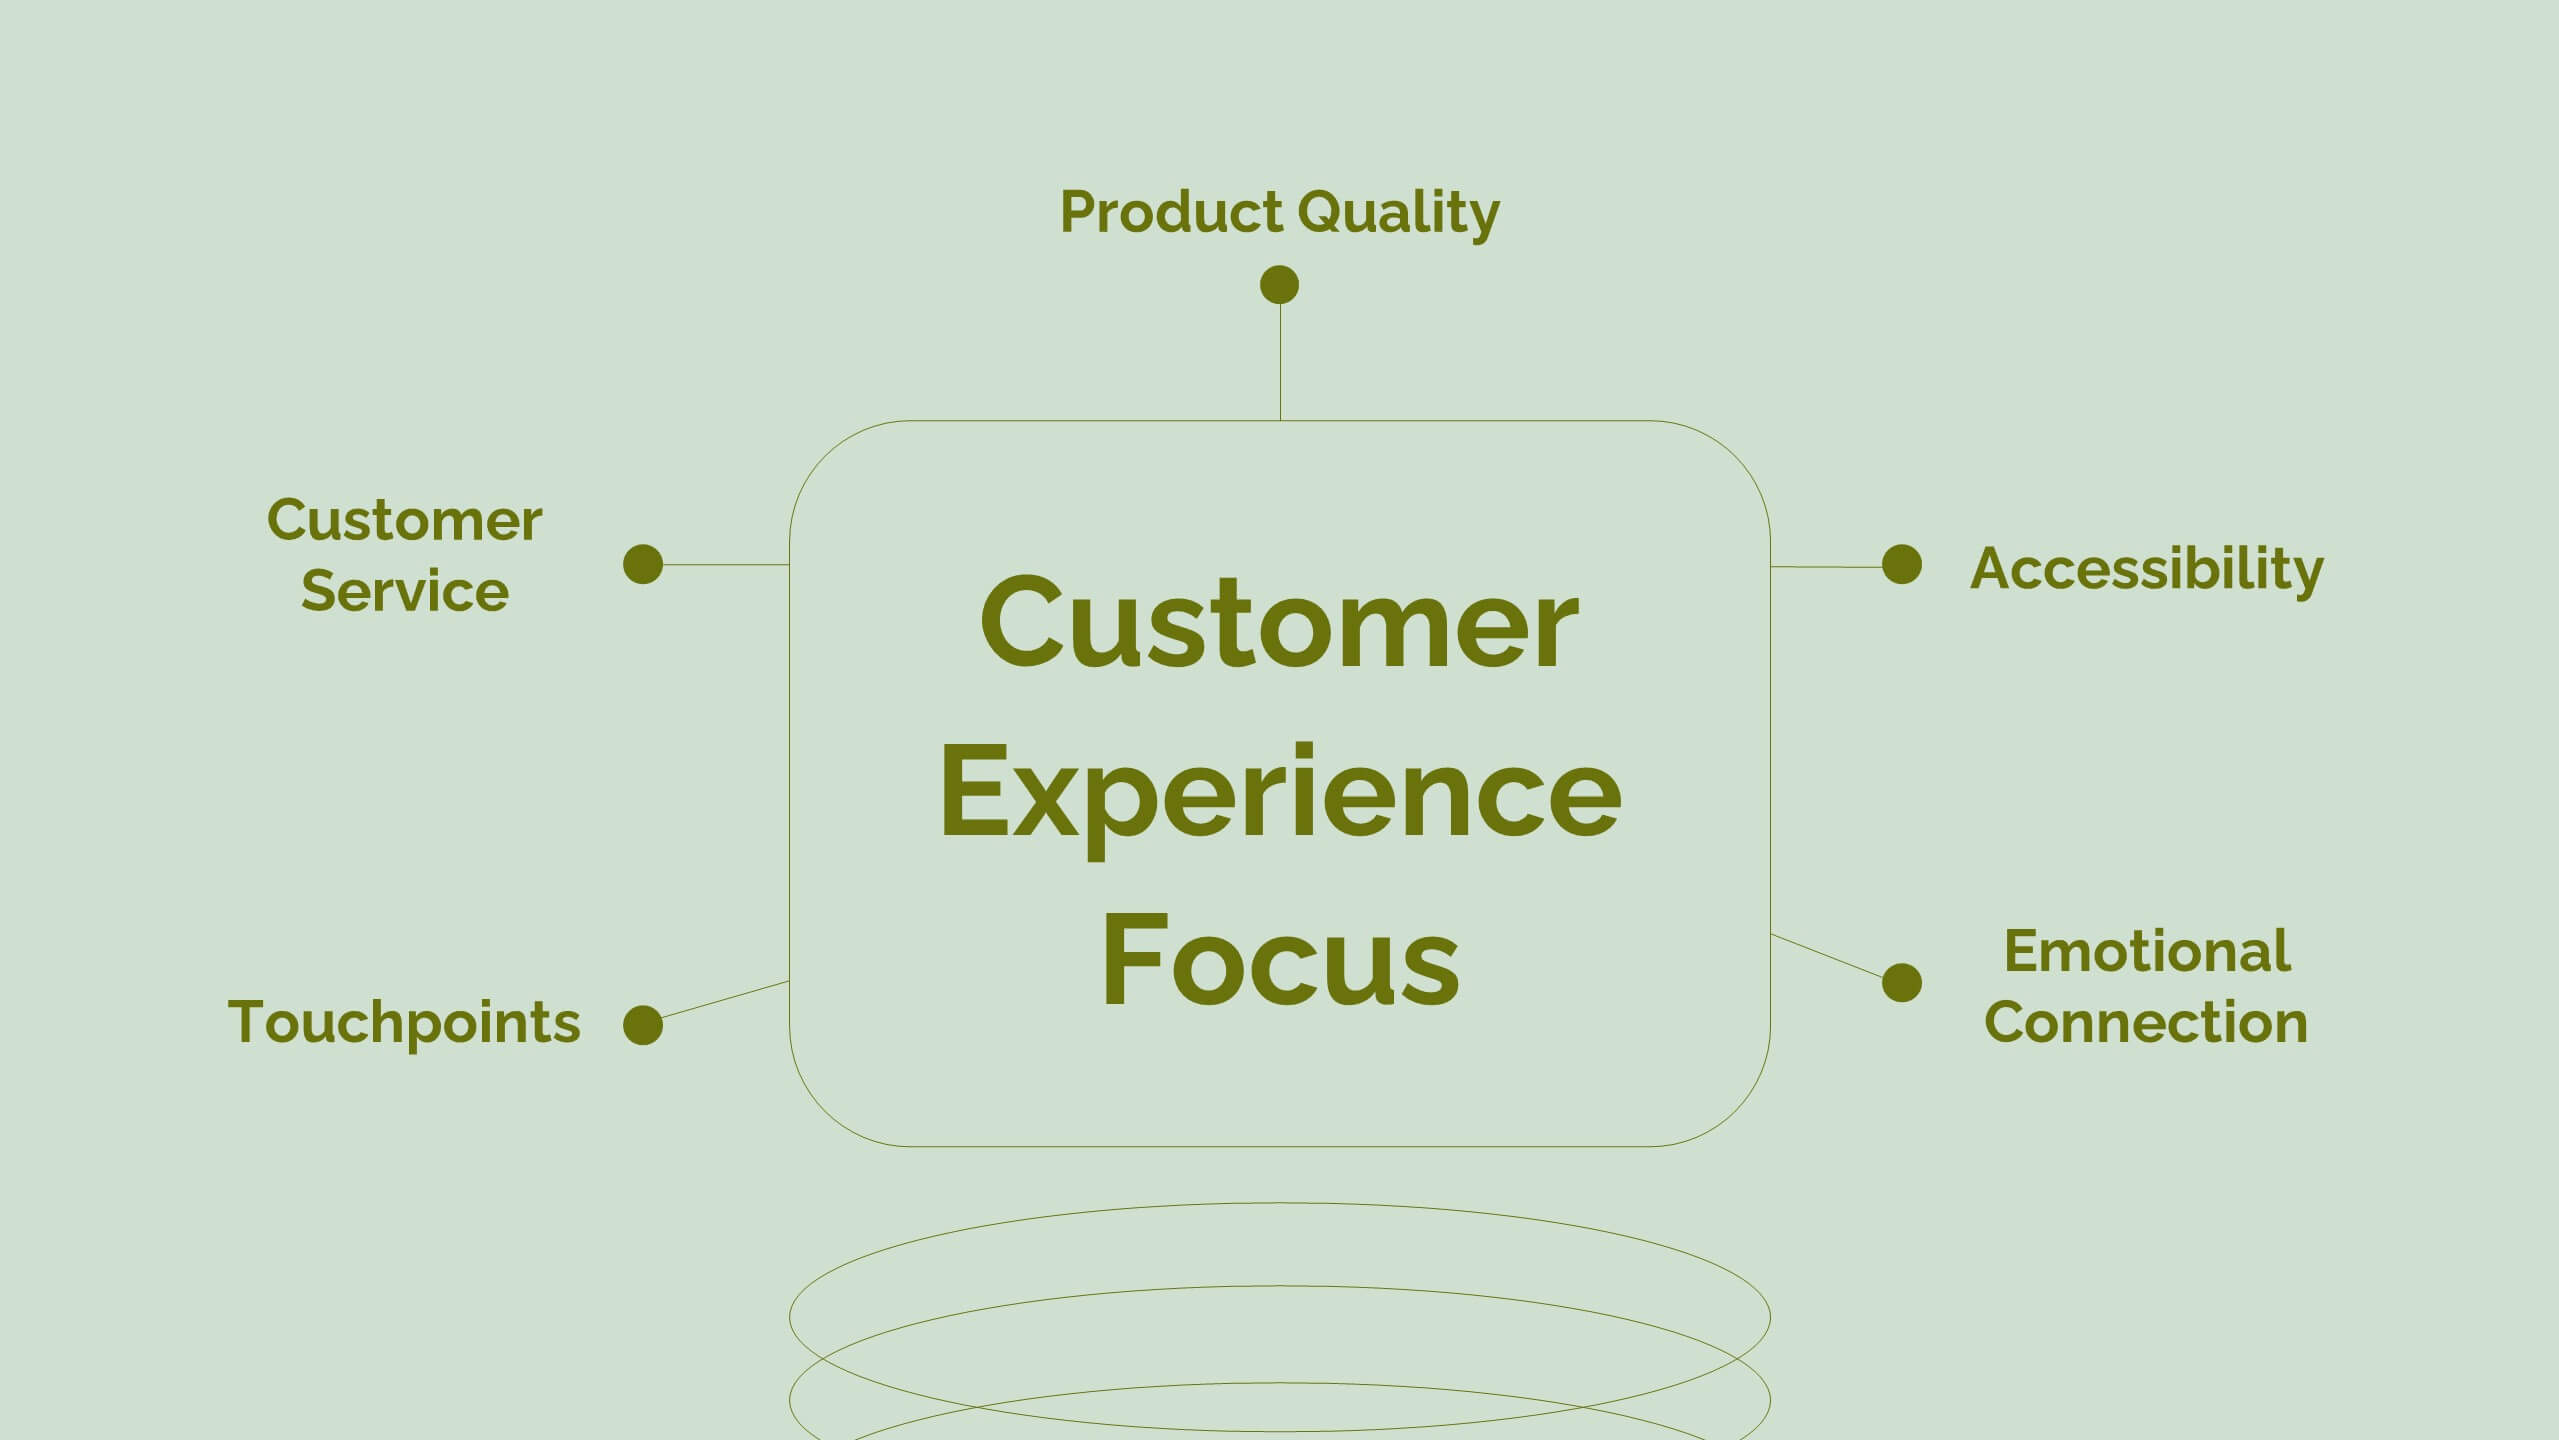
Revamp your digital marketing strategies with this dynamic template! Covering everything from industry overviews and consumer behavior analysis to emerging technologies and social media strategies, this template has it all. Perfect for creating compelling presentations that highlight data-driven marketing and brand storytelling. Compatible with PowerPoint, Keynote, and Google Slides.


6 slides
Editable Puzzle Infographic
Piece together complex data with our Editable Puzzle Infographic, compatible with Powerpoint, Google Slides, and Keynote. This engaging infographic is designed to help presenters visually connect different pieces of information in a cohesive and understandable way. The puzzle pieces are a metaphor for how individual components fit into a larger strategy or concept, making it perfect for collaborative projects or educational models. The infographic is fully customizable, allowing you to adapt the colors, text, and arrangement to fit your specific needs. With this puzzle infographic, you can make your presentations more interactive ensuring your audience can see the big picture every time.


7 slides
Concentric Circles Model Infographic Presentation
A Concentric Circle Infographic is a visual tool that represents information, data or ideas in a circular format, where each circle is centered inside the next larger circle. In this template you can use the circles to show the relationships between different elements or components, with the innermost circle representing the most important or central idea, and the outer circles representing related or peripheral ideas. Designed in Powerpoint, Keynote, and Google slides the circles in the template can be easily customized with different colors, sizes, and designs to fit your needs.


7 slides
Digital Marketing Infographic
Digital marketing refers to the use of digital channels, such as the internet, social media, search engines, email, and mobile devices, to promote products, services, and brands. This infographic showcases key concepts and strategies in the field of digital marketing. It is designed to help businesses and marketers effectively communicate and educate their audience about the various aspects of digital marketing. This template can be used to cover a wide range of digital marketing topics, including social media marketing, search engine optimization, content marketing, email marketing, paid advertising, analytics, and more.


4 slides
Effective Team Communication
Break down communication impact with this data-driven walkie-talkie infographic. Perfect for showing percentage-based contributions, roles, or workflow efficiency across teams. Fully customizable in PowerPoint, Keynote, and Google Slides.


5 slides
Body System Overview Presentation
Visually explain key human body systems with this clean and modern slide. Each section highlights a different organ with labeled points (A–D) for easy reference. Ideal for health education, medical briefings, or anatomy lessons. Fully editable in PowerPoint, Keynote, or Google Slides to suit any professional or academic need.


7 slides
Security Framework Infographic
A security framework, also known as a cybersecurity framework, is a structured set of guidelines, best practices, standards, and processes that help organizations design, implement, monitor, and manage robust security measures to protect their information systems and resources. This infographic template is a fortress of knowledge, guiding you through the pillars of a robust security infrastructure that safeguards your digital realm. Compatible with Powerpoint, Keynote, and Google Sides. Every element in this infographic embodies a facet of a comprehensive security framework.


6 slides
Process Cycle Wheel Slide Presentation
Give your workflow a visual rhythm with this clean, circular layout designed to highlight every stage of a process with clarity and style. Perfect for showcasing cycles, systems, or strategies, it keeps your message organized and engaging. Fully editable and compatible with PowerPoint, Keynote, and Google Slides.


5 slides
Travel Planning and Destination Guide Presentation
Highlight your itinerary or destination comparisons with this suitcase-stacked infographic slide. Each luggage icon aligns with a percentage label and text box, helping you present travel data, tips, or packing categories in an engaging and visually organized way. Perfect for travel agencies, bloggers, and vacation planners. Fully editable in PowerPoint, Keynote, and Google Slides.


6 slides
International Breast Cancer Day Infographics
Celebrate International Breast Cancer Day with our customizable infographic template, designed to raise awareness and share vital information about breast cancer. This template is fully compatible with popular presentation software such as PowerPoint, Keynote, and Google Slides, allowing you to easily personalize it to convey your unique message. The International Breast Cancer Day infographic template serves as a versatile canvas for displaying facts, statistics, prevention methods, and support resources related to breast cancer. Whether you're a healthcare professional, advocate, or someone passionate about promoting breast health, this template offers a user-friendly platform to create informative presentations and awareness materials. Make an impact with this SEO-optimized International Breast Cancer Day infographic template, meticulously crafted for clarity and ease of use. Customize it to share stories of survivors, highlight the importance of early detection, and spread the message of hope and support. Start creating your personalized infographic to contribute to the cause today!


5 slides
Online Digital Marketing Infographics
Online Digital Marketing refers to the promotion of products, services, or brands using digital channels and technologies. These infographic templates aims to educate and inspire the audience about the world of digital marketing and equip them with valuable insights and strategies to enhance their online presence. This is a valuable tool for presenting the intricacies of digital marketing in a clear and engaging manner. The templates provide slides that focus on analytics and measurement, emphasizing the importance of tracking and evaluating digital marketing efforts. You can customize the templates with your own branding to create a professional look.


5 slides
Human Resource Functions Infographics
Illuminate the complexities of people management with our human resource functions infographics template. Cast in the professional yet warm palette of black, orange, pink, and red, this template is an essential tool for HR professionals, corporate trainers, and business leaders. It elegantly dissects various HR realms with its sleek graphics, intuitive icons, and dedicated image placeholders, making it perfect for showcasing recruitment processes, employee engagement strategies, or organizational culture principles. Its creative, vertical style is designed to hold the attention and fuel the imagination, turning any HR presentation into a compelling narrative.


4 slides
Project Responsibility Assignment Matrix Presentation
Visualize team roles and task accountability at a glance with this Project Responsibility Assignment Matrix. This structured layout categorizes assignments using the RACI model—Responsible, Accountable, Consulted, and Informed—organized by team and position. Ideal for project managers, team leads, and operations planners, it helps ensure clarity, reduce overlap, and promote accountability across departments. Easily editable in PowerPoint, Keynote, and Google Slides for seamless customization and cross-platform use.


2 slides
Visual Resume and Project Gallery Presentation
Showcase your personality and creative work with the Visual Resume and Project Gallery Presentation. This vibrant layout blends a professional “About Me” section with a clean, image-focused gallery—ideal for designers, freelancers, or artists. Fully editable in Canva, PowerPoint, Keynote, and Google Slides for easy customization and seamless presentation.