


Features
- 5 Unique slides
- Fully editable and easy to edit in Microsoft Powerpoint, Keynote and Google Slides
- 16:9 widescreen layout
- Clean and professional designs
- Export to JPG, PDF or send by email


Do you have any questions?
Recommend
5 slides
Transportation Flow and Inventory Tracking Presentation
Track movement and stock like a pro with this clean shipping infographic layout. Featuring a cargo ship graphic and segmented titles, it's perfect for illustrating supply chain progress, delivery checkpoints, or inventory updates. Use it to present logistics insights with clarity. Fully compatible with PowerPoint, Keynote, and Google Slides.


4 slides
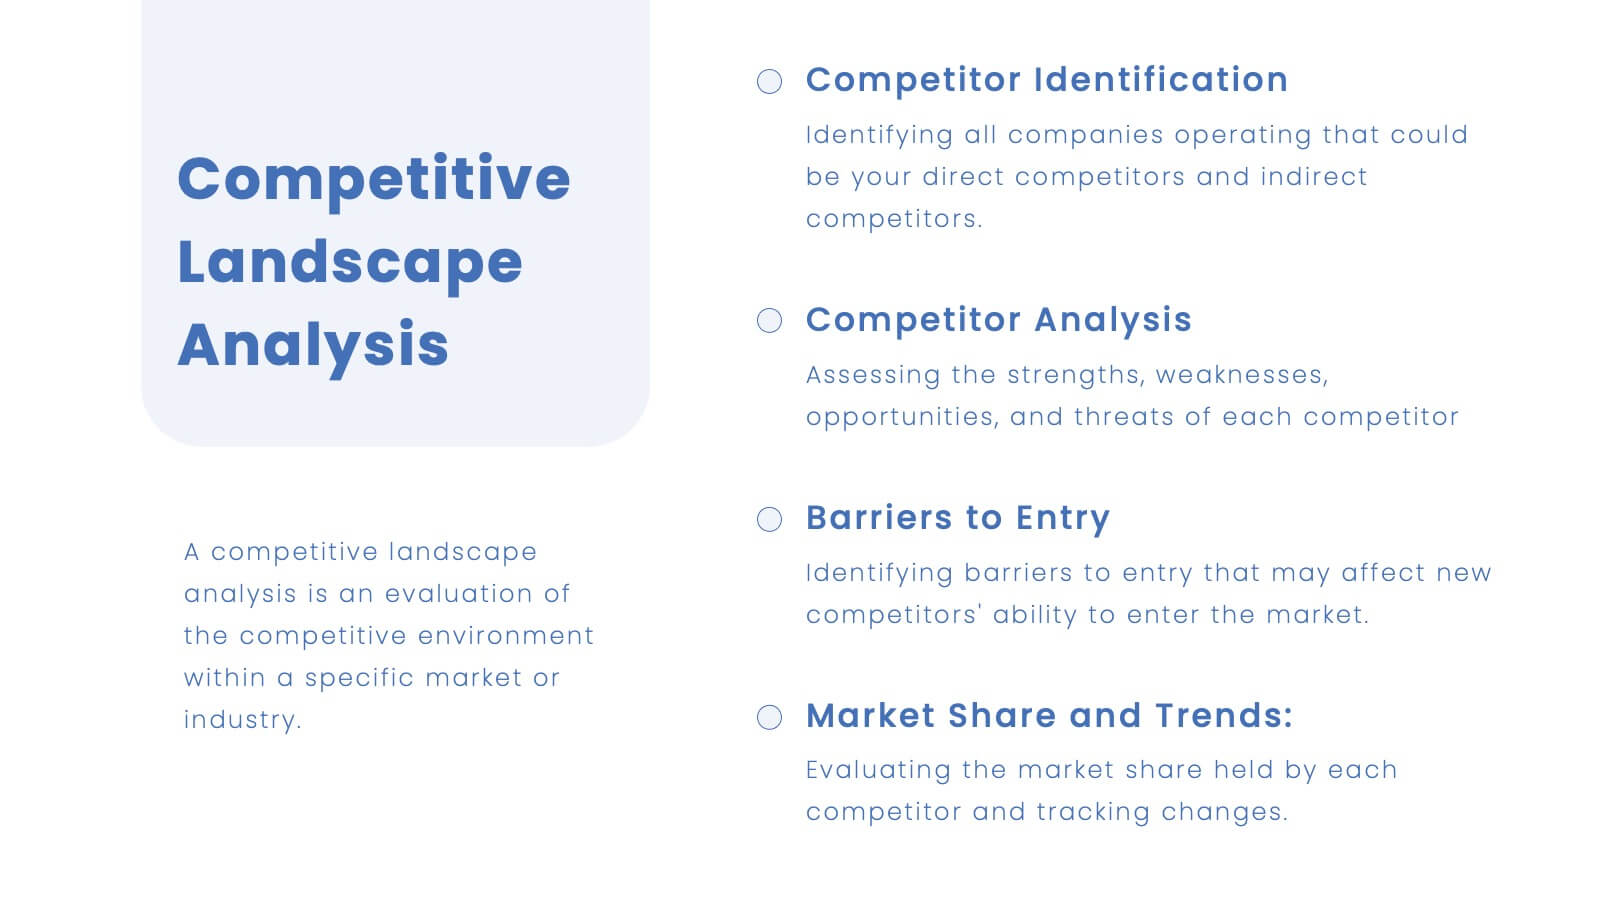
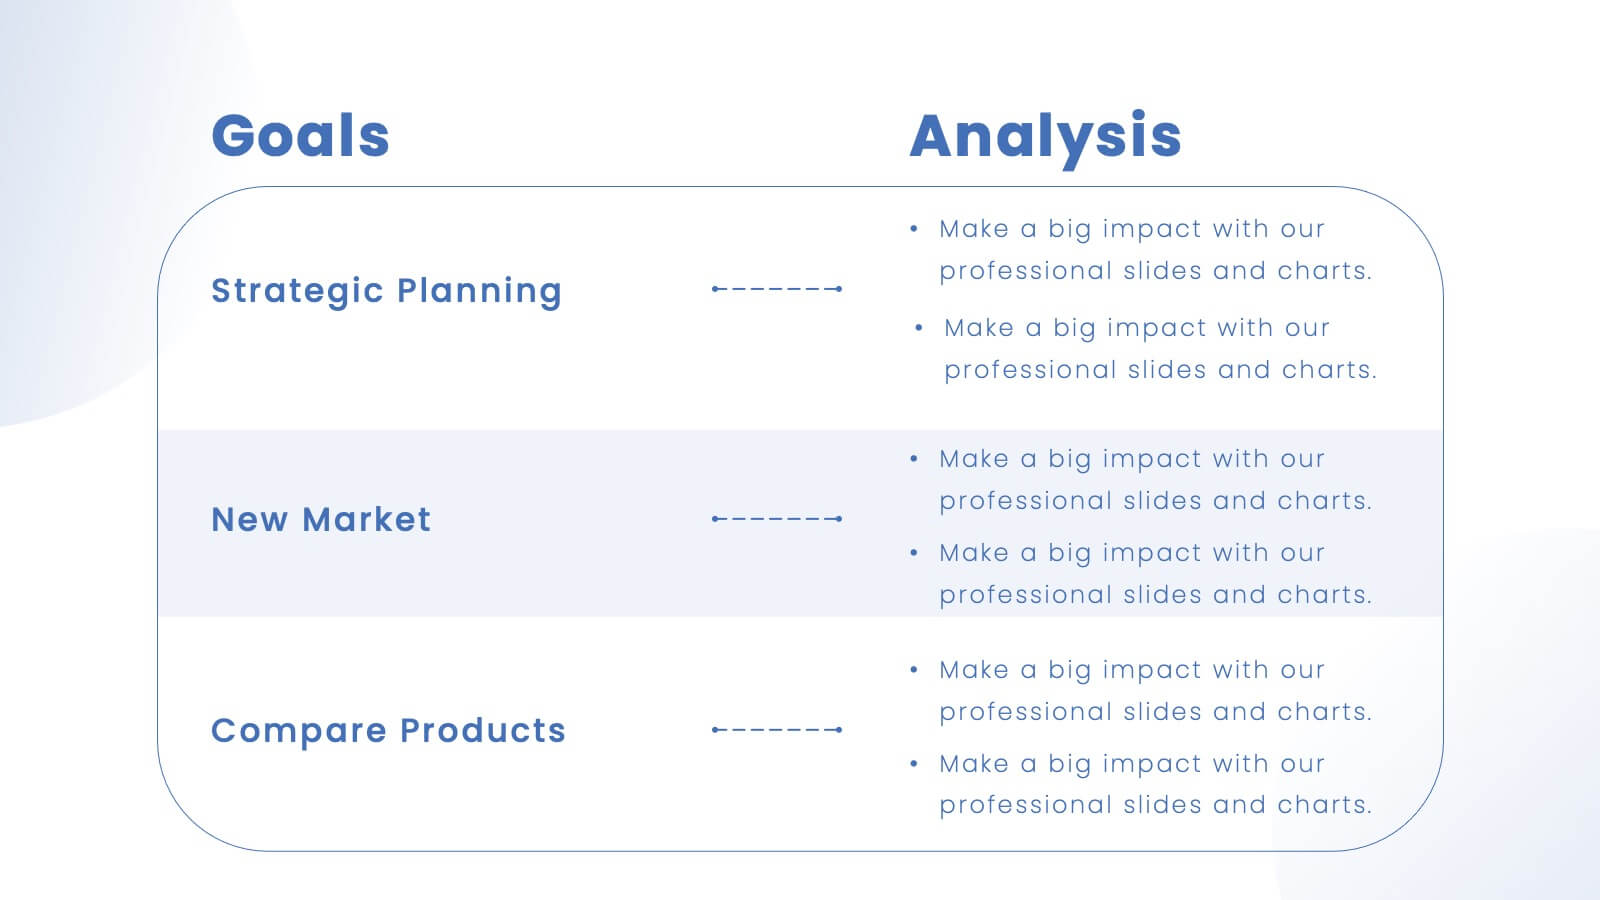
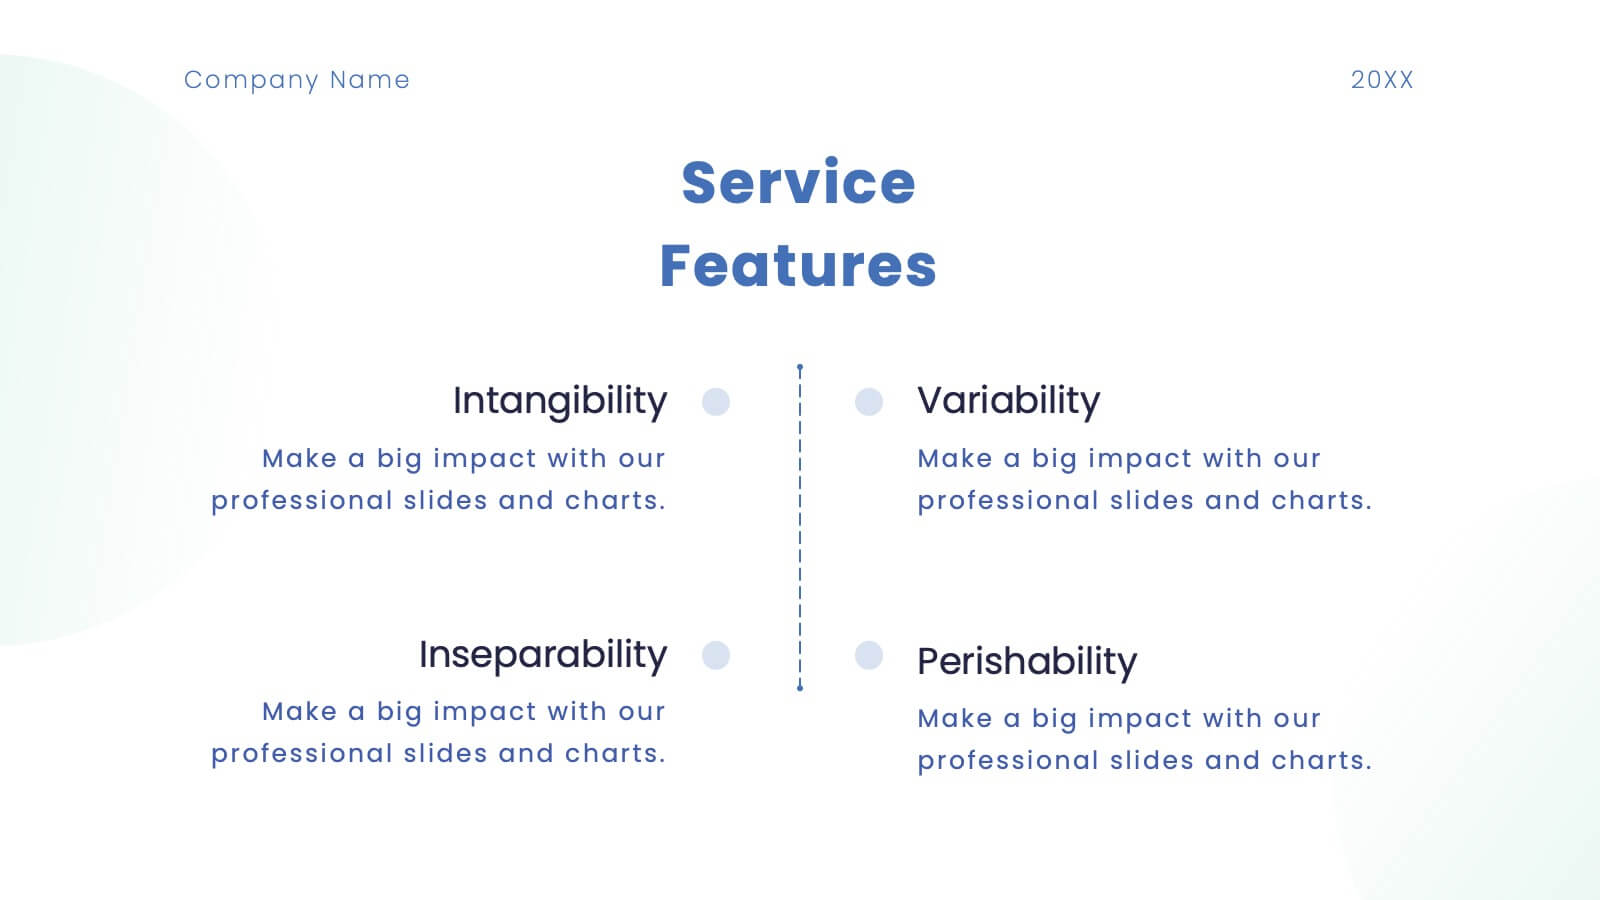
Client Proposal Overview Presentation
Present your ideas with confidence using a sleek and structured layout that turns client insights into a compelling story. Ideal for outlining project goals, value propositions, or proposal summaries, this template keeps every detail polished and professional. Fully compatible with PowerPoint, Keynote, and Google Slides for effortless customization.


4 slides
Investor-Ready Pitch for New Ventures Presentation
Make a lasting impression with the Investor-Ready Pitch for New Ventures Presentation. Designed to balance visuals with key stats, this template helps startups clearly communicate value to potential investors. Highlight milestones, team credibility, and market opportunity using bold typography and high-impact imagery. Fully editable in PowerPoint, Keynote, Google Slides, and Canva.


7 slides
Digital Marketing Services Infographic
A Digital Marketing Services Infographic is a visual representation of information and data related to digital marketing services. This template is a type of graphic design that presents complex or large amounts of information in a simple and informative way. This infographic includes statistics, charts, graphs, and other visual elements to convey your information about various aspects of digital marketing, such as social media marketing, content marketing, search engine optimization, email marketing, and paid advertising. Compatible with Powerpoint, Keynote and Google Slides.


6 slides
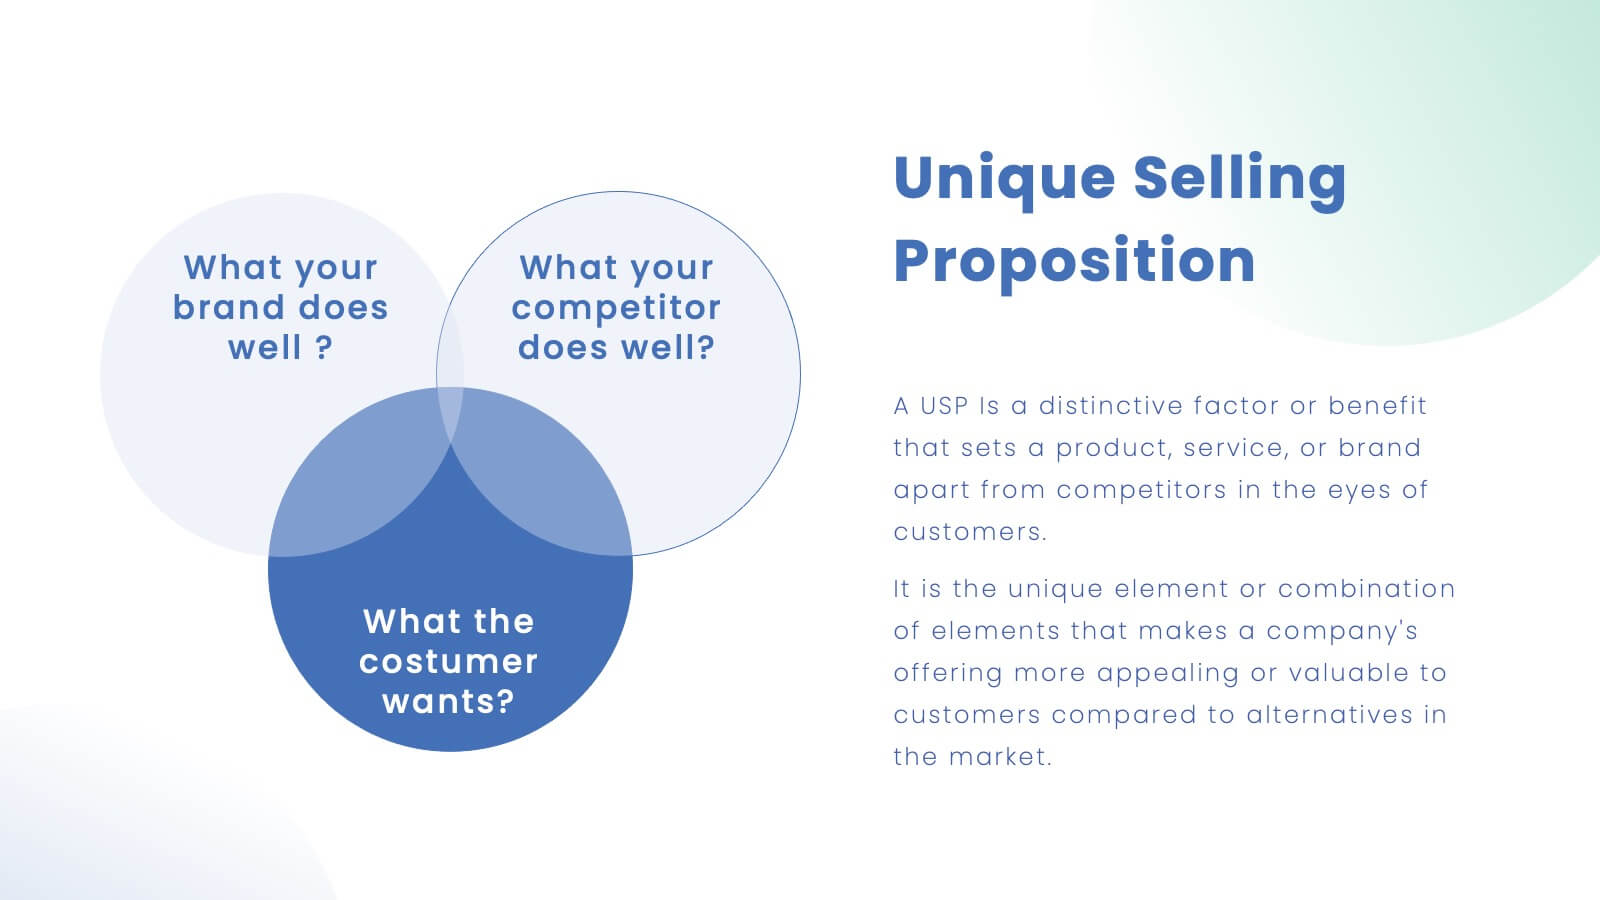
Venn Diagram
A Venn diagram is a visual representation of the relationships between different sets or groups. This infographic template consists of overlapping circles, each representing a specific set, and the overlapping parts indicates the elements that belong to multiple sets. Use this infographic to illustrate the relationships between different sets of data or concepts. The main components of the infographic are the circles or ellipses that represent the sets being compared. The size and position of the circles can be adjusted to reflect the data accurately. This infographic is fully customizable and compatible with Powerpoint, Keynote, and Google Slides.

21 slides
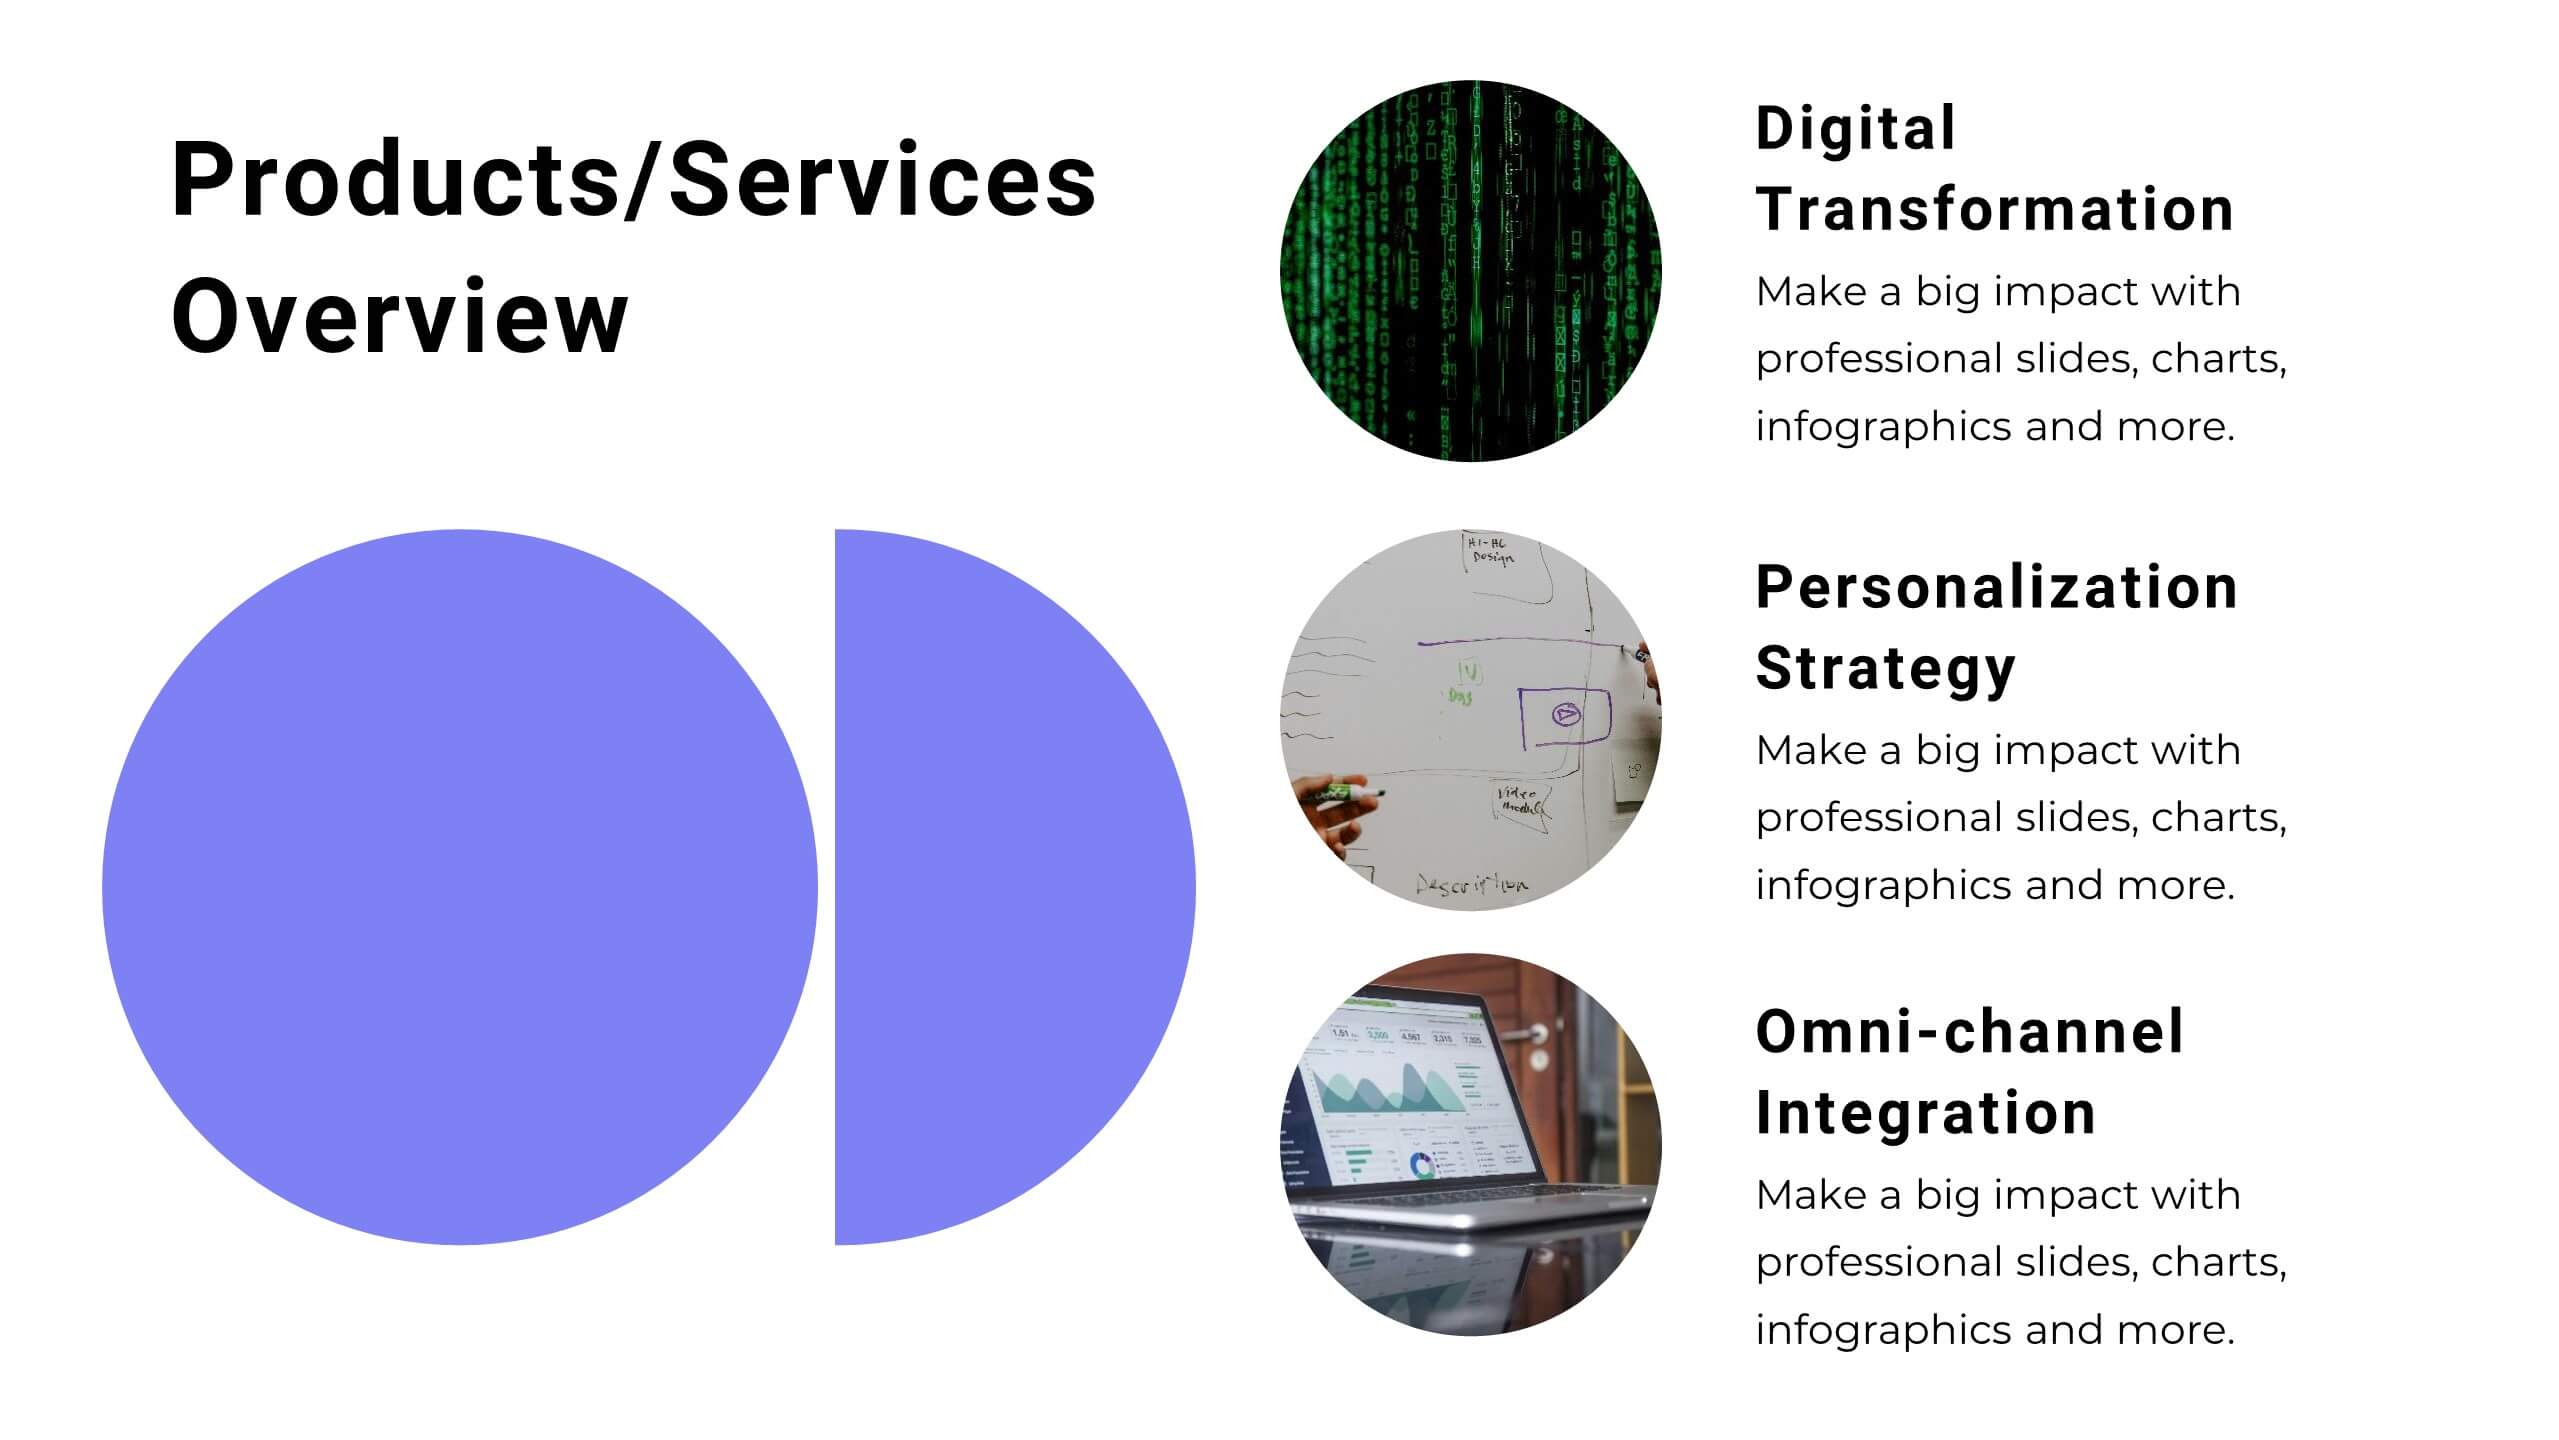
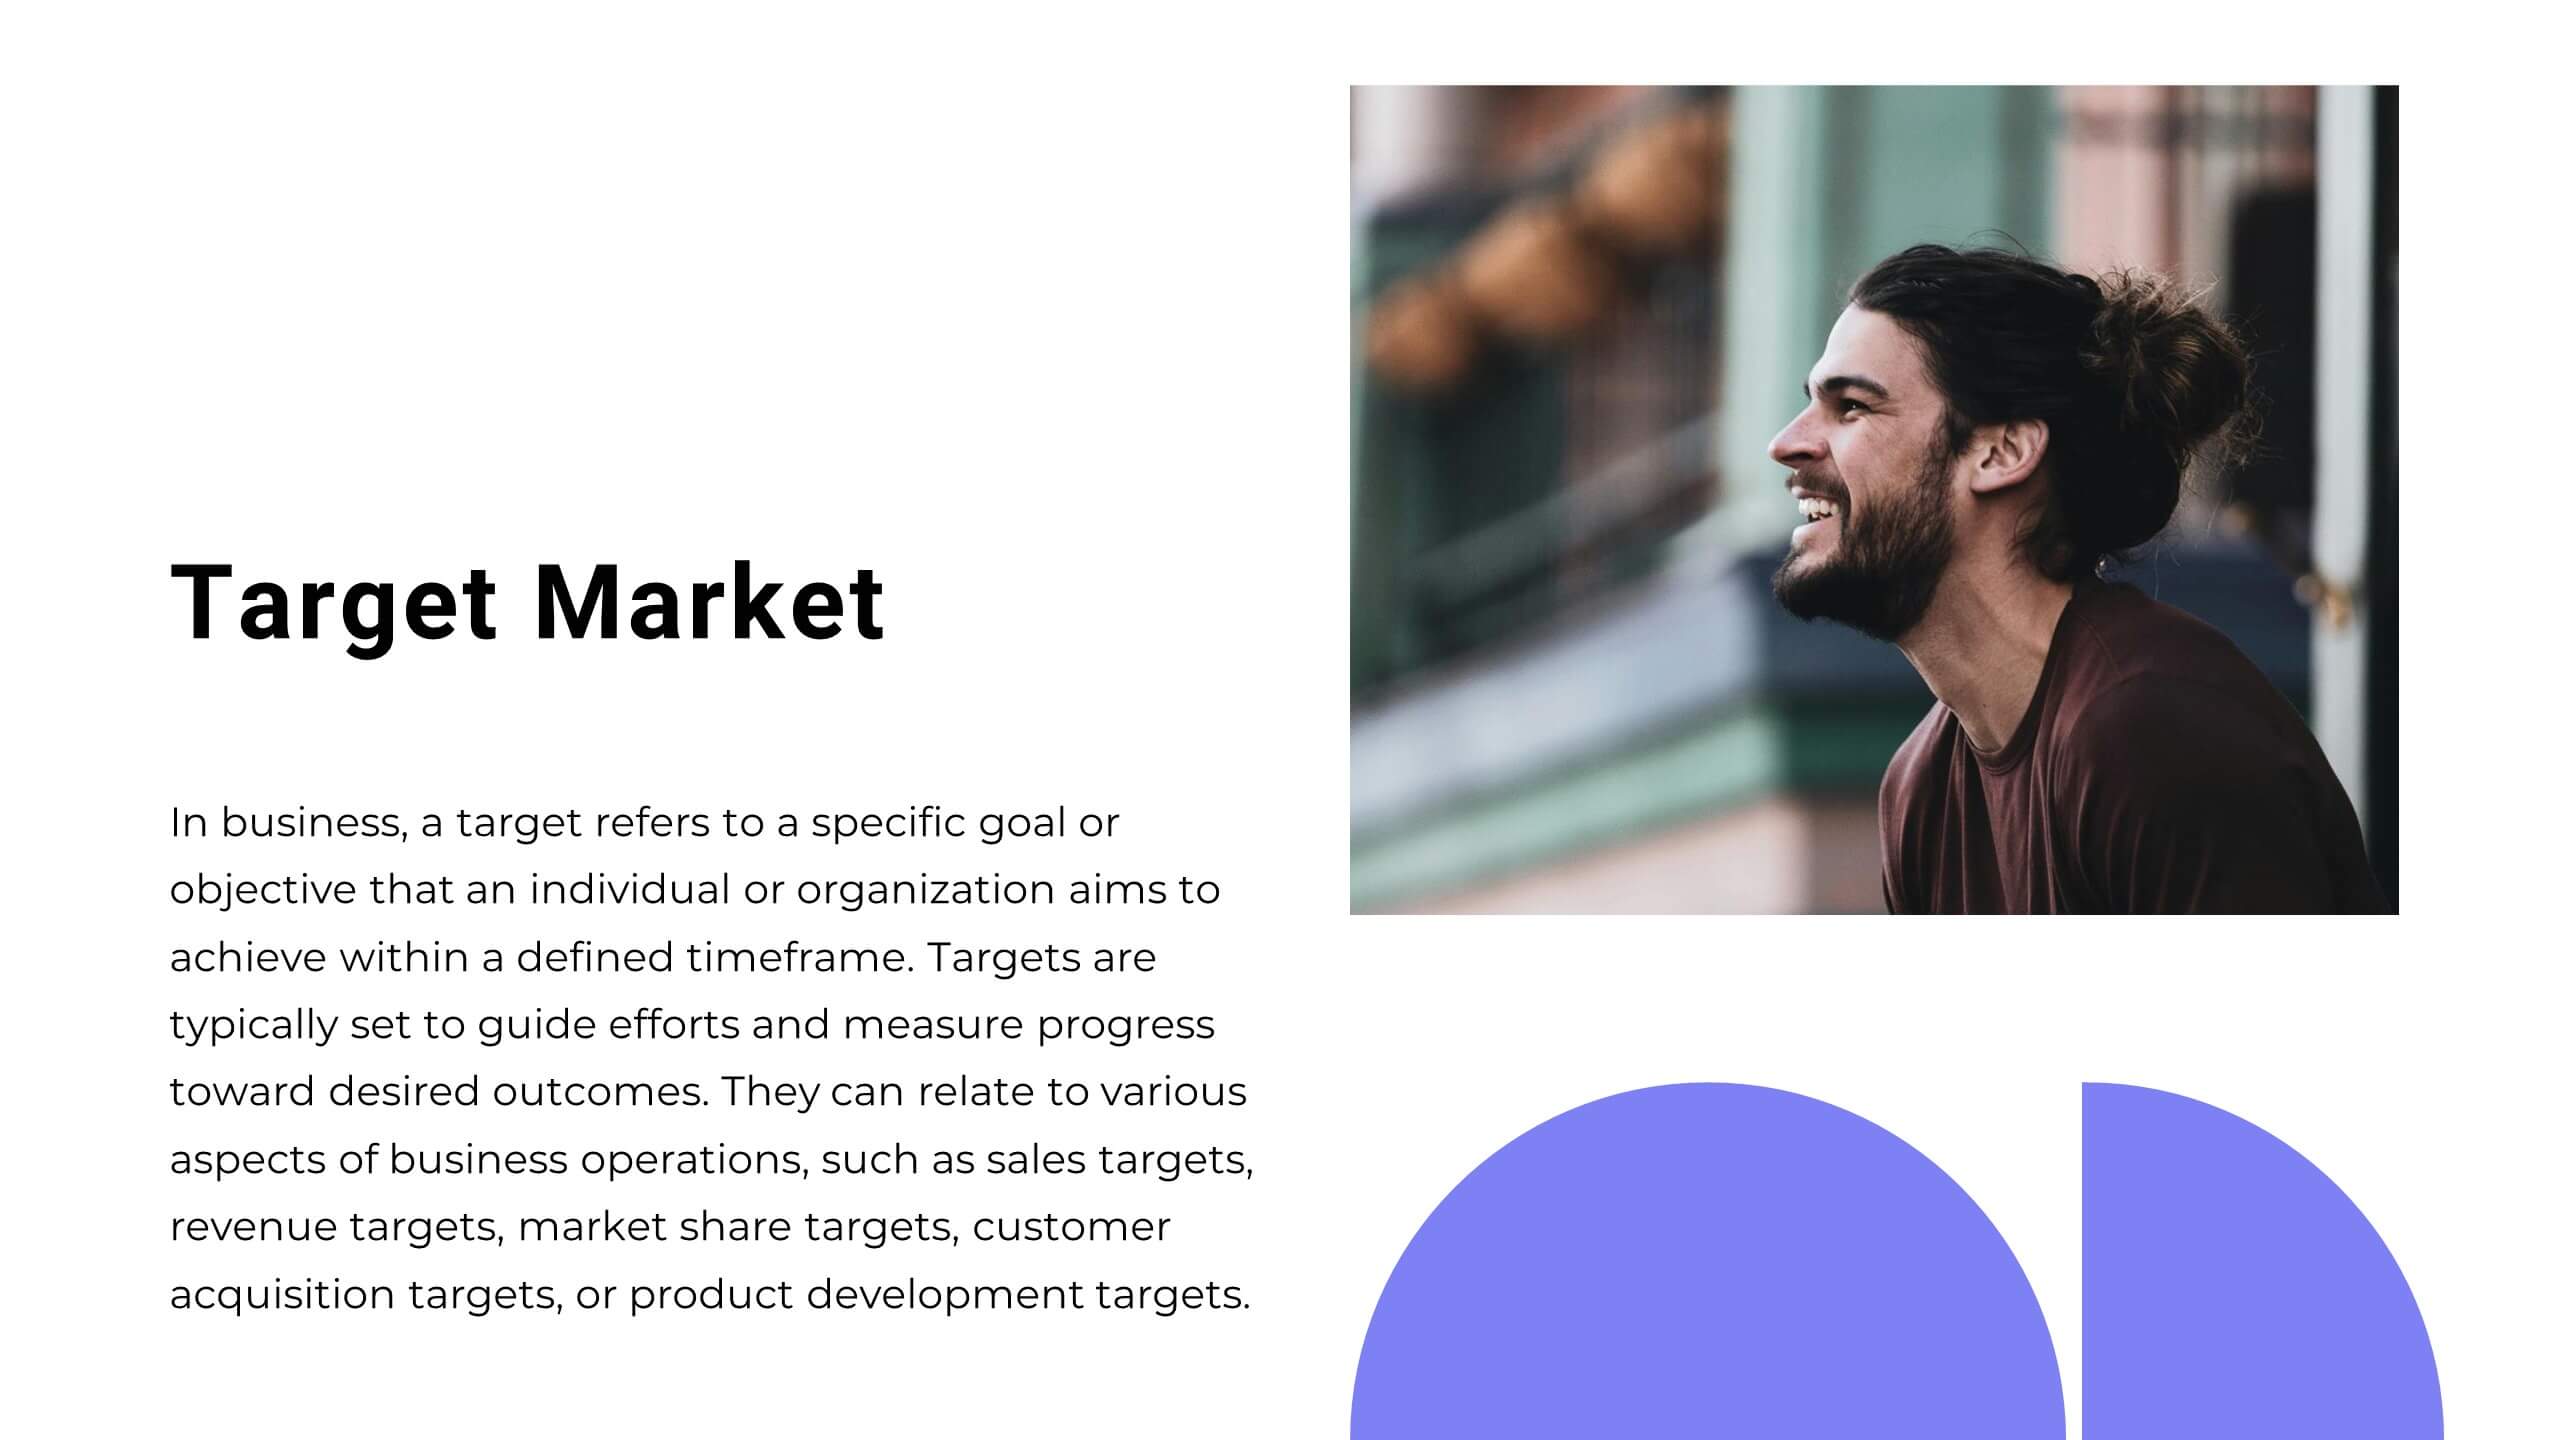
Vibrant Startup Pitch Deck Presentation
This dynamic and modern Startup Pitch Deck template is perfect for showcasing your startup's vision, strategy, and growth potential. Featuring a sleek design with bold visuals, this template guides you through key sections such as mission and vision, product/service overview, target market, and financial projections. It’s tailored to help you tell a compelling story that resonates with investors and stakeholders. The template is fully customizable in PowerPoint, Keynote, or Google Slides, ensuring you can adapt it to your specific needs and create a memorable presentation that leaves a lasting impression.


6 slides
5-Stage Sales Funnel Presentation
Visualize your sales process effortlessly with this 5-Stage Sales Funnel template. Ideal for showcasing lead conversion, customer journey, and sales strategies, this design is fully customizable. Adjust colors, text, and icons to fit your needs. Compatible with PowerPoint, Keynote, and Google Slides for seamless integration into your presentations.


4 slides
Marketing SWOT Assessment Presentation
Analyze your brand’s position with this colorful Marketing SWOT Assessment layout. Clearly outline strengths, weaknesses, opportunities, and threats in a column format, perfect for client reports or strategy sessions. Fully customizable in PowerPoint, Keynote, and Google Slides—ideal for marketers seeking clarity, structure, and visual impact in every presentation.


5 slides
Performance Progress and Achievements Presentation
Showcase your team’s accomplishments and growth over time with this visually engaging bar chart layout. Each performance level is color-coded for clarity and paired with space for concise descriptions. Ideal for reporting KPIs, quarterly wins, or business milestones. Fully customizable in PowerPoint, Keynote, and Google Slides.


28 slides
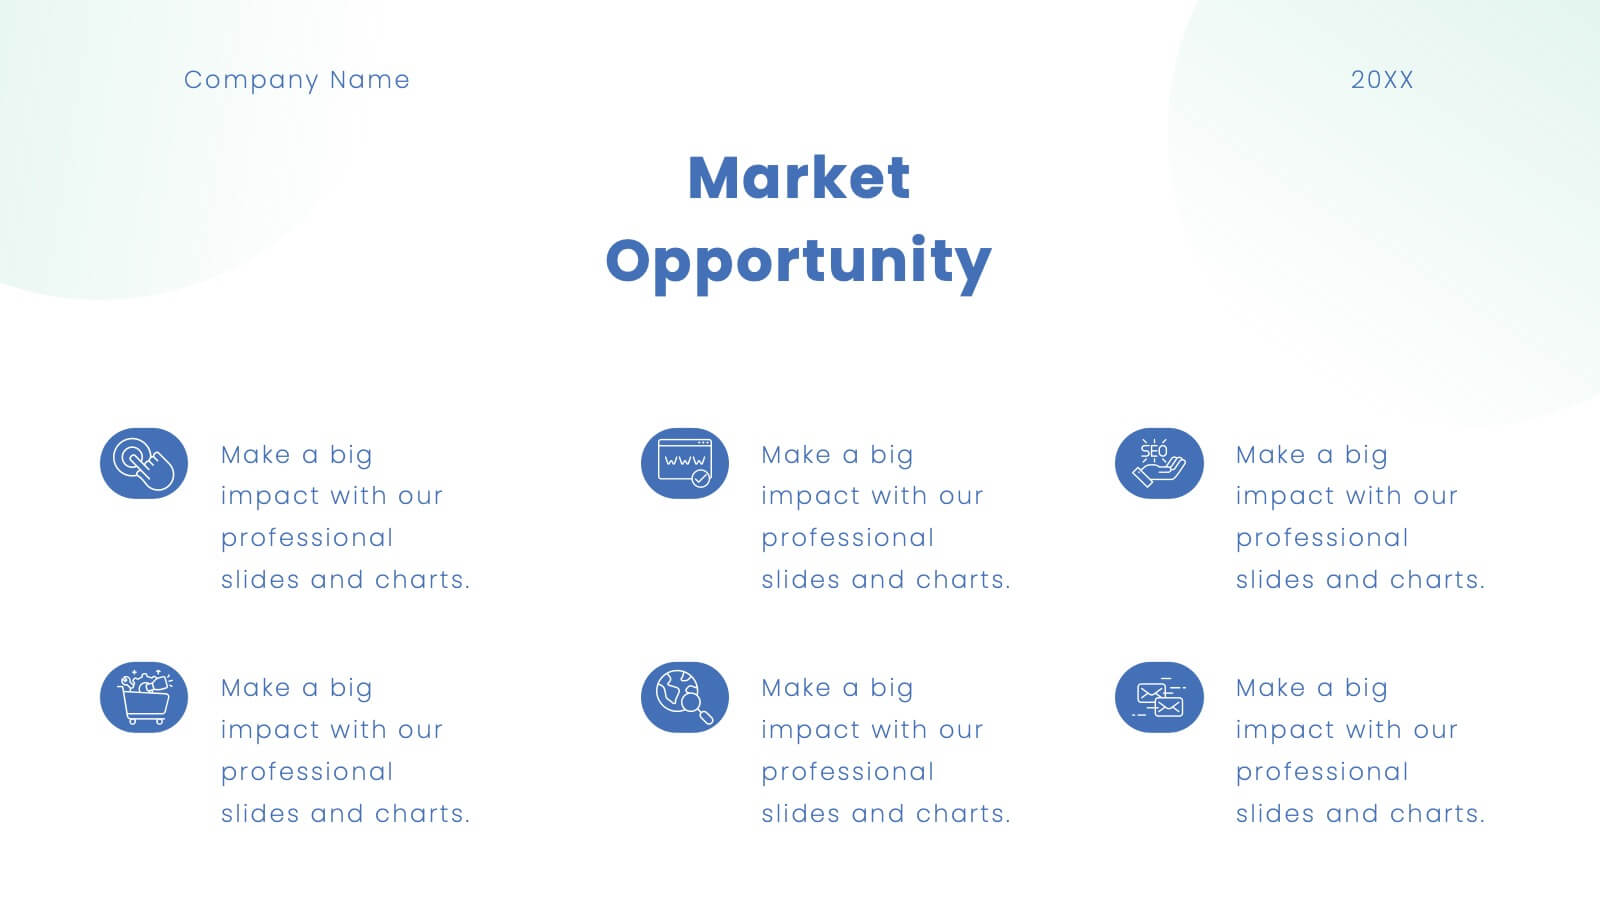
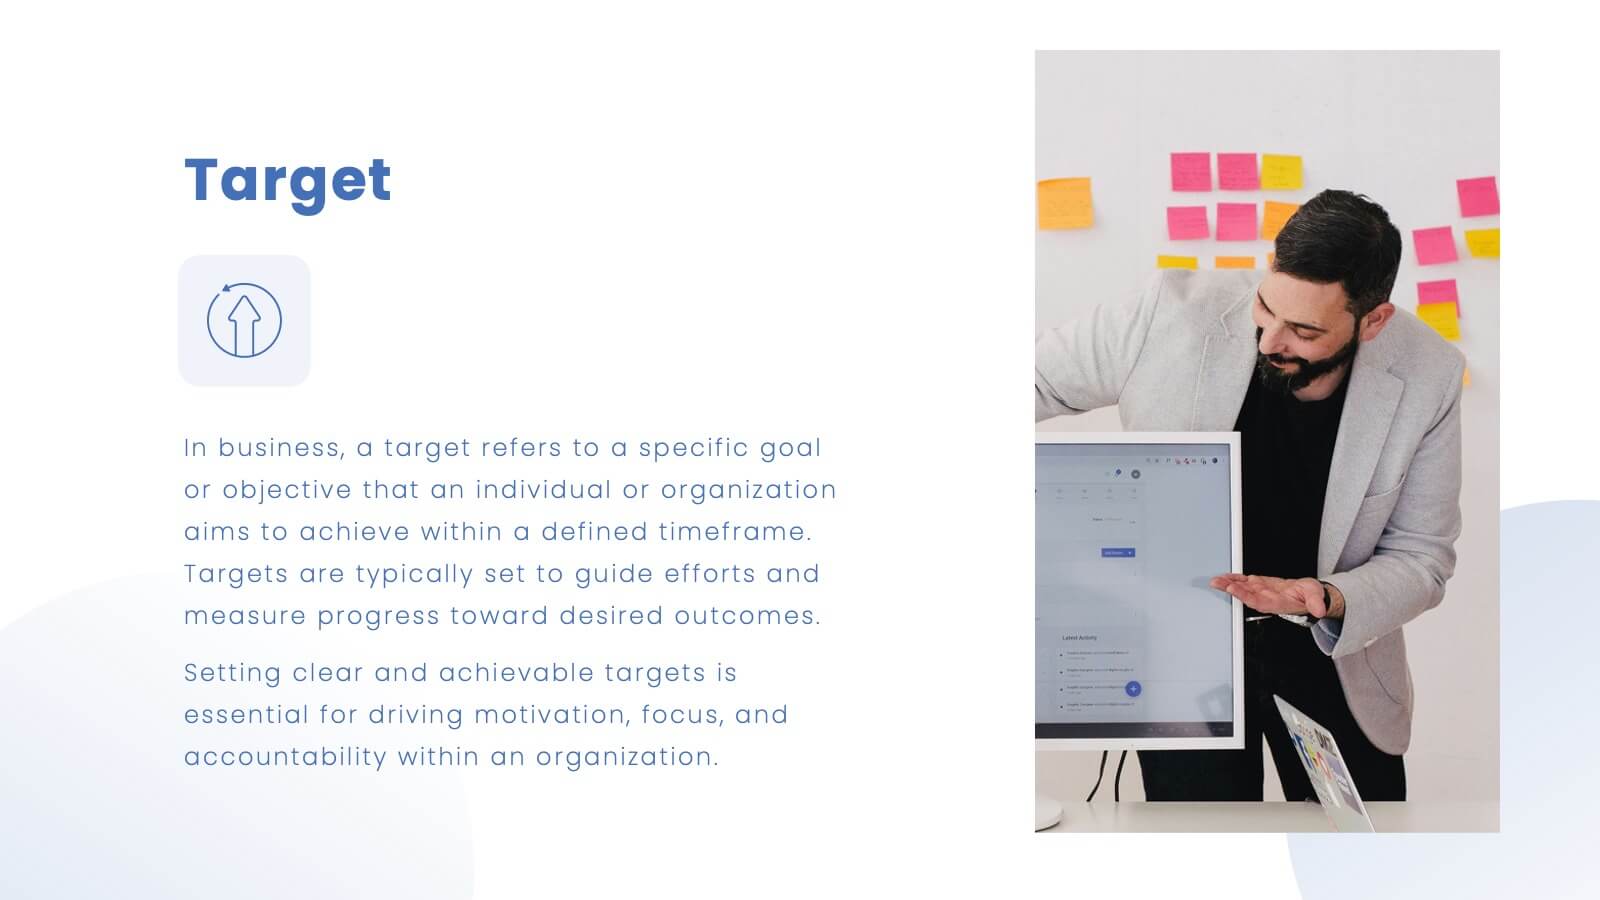
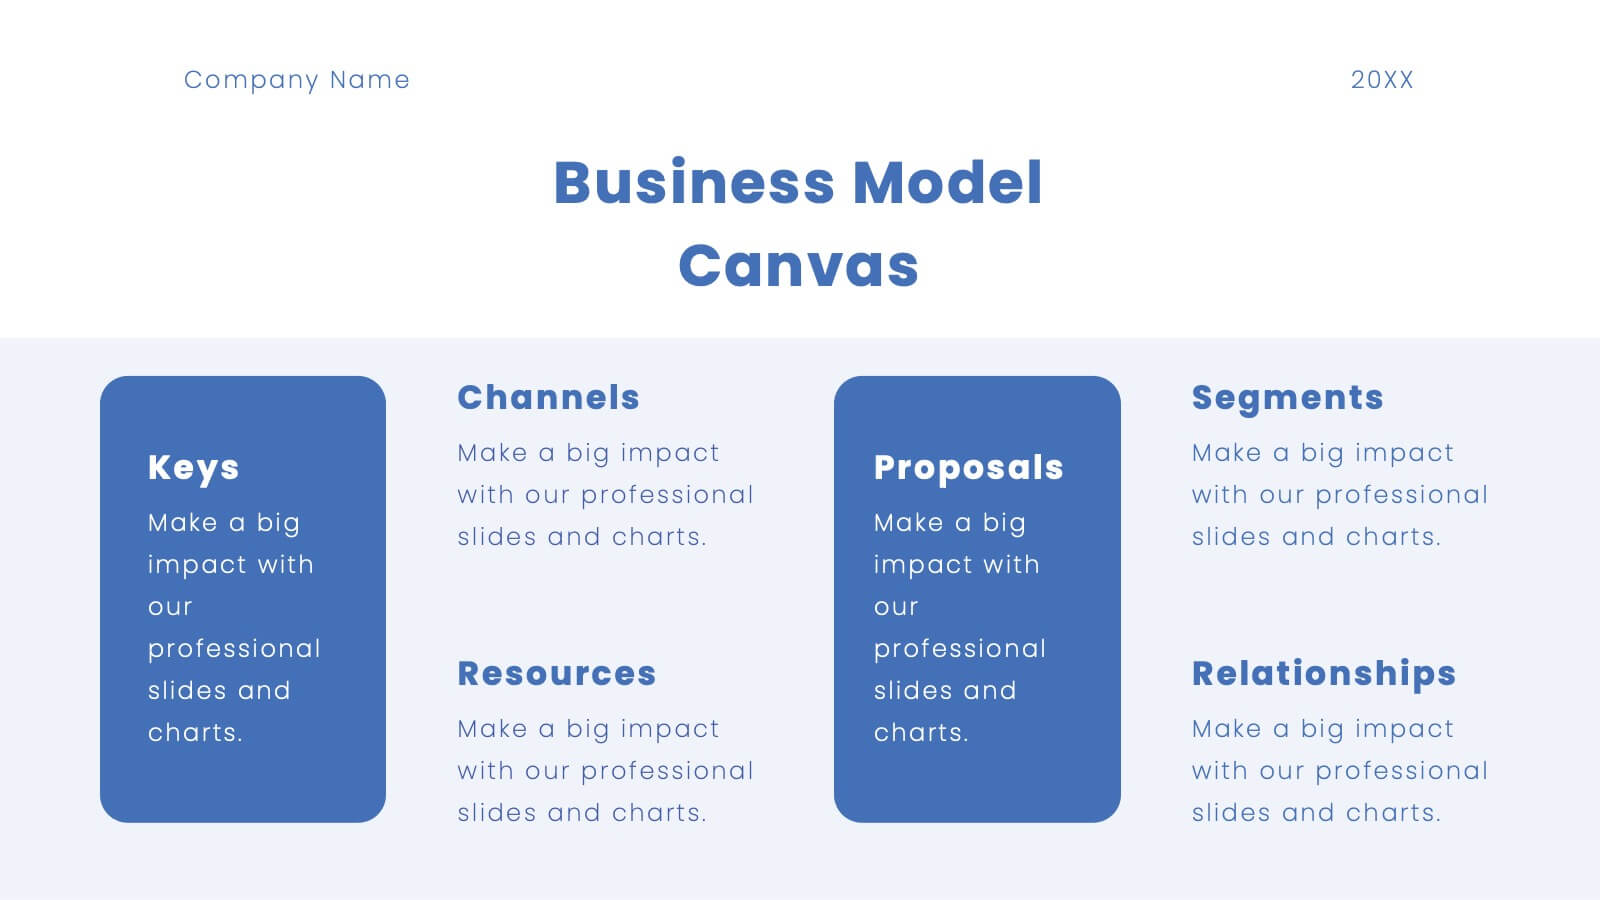
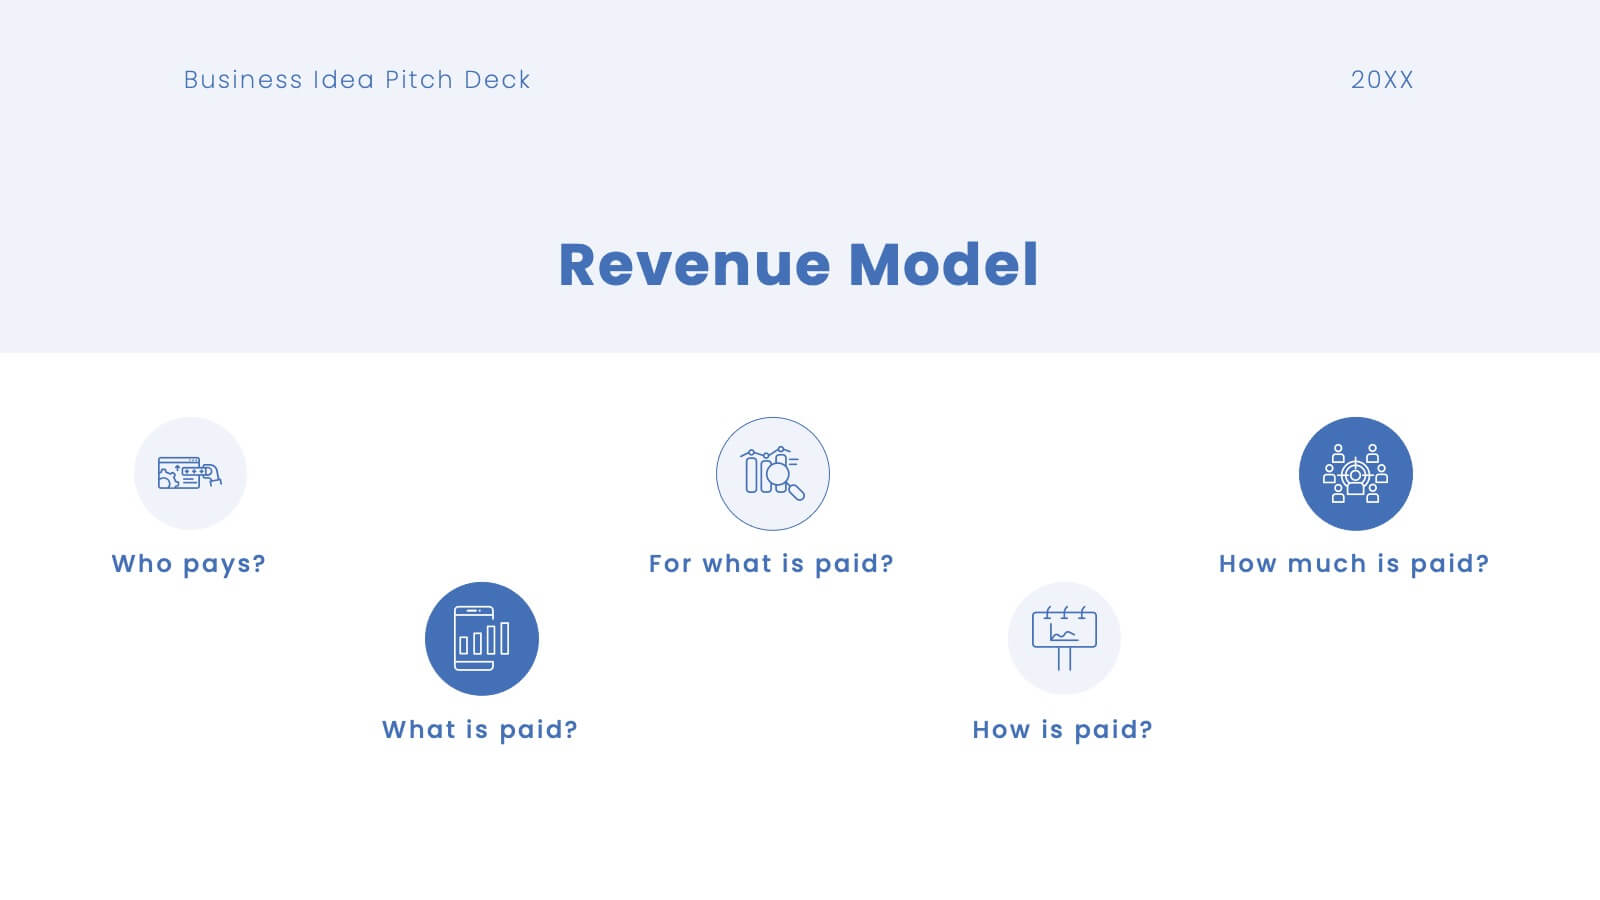
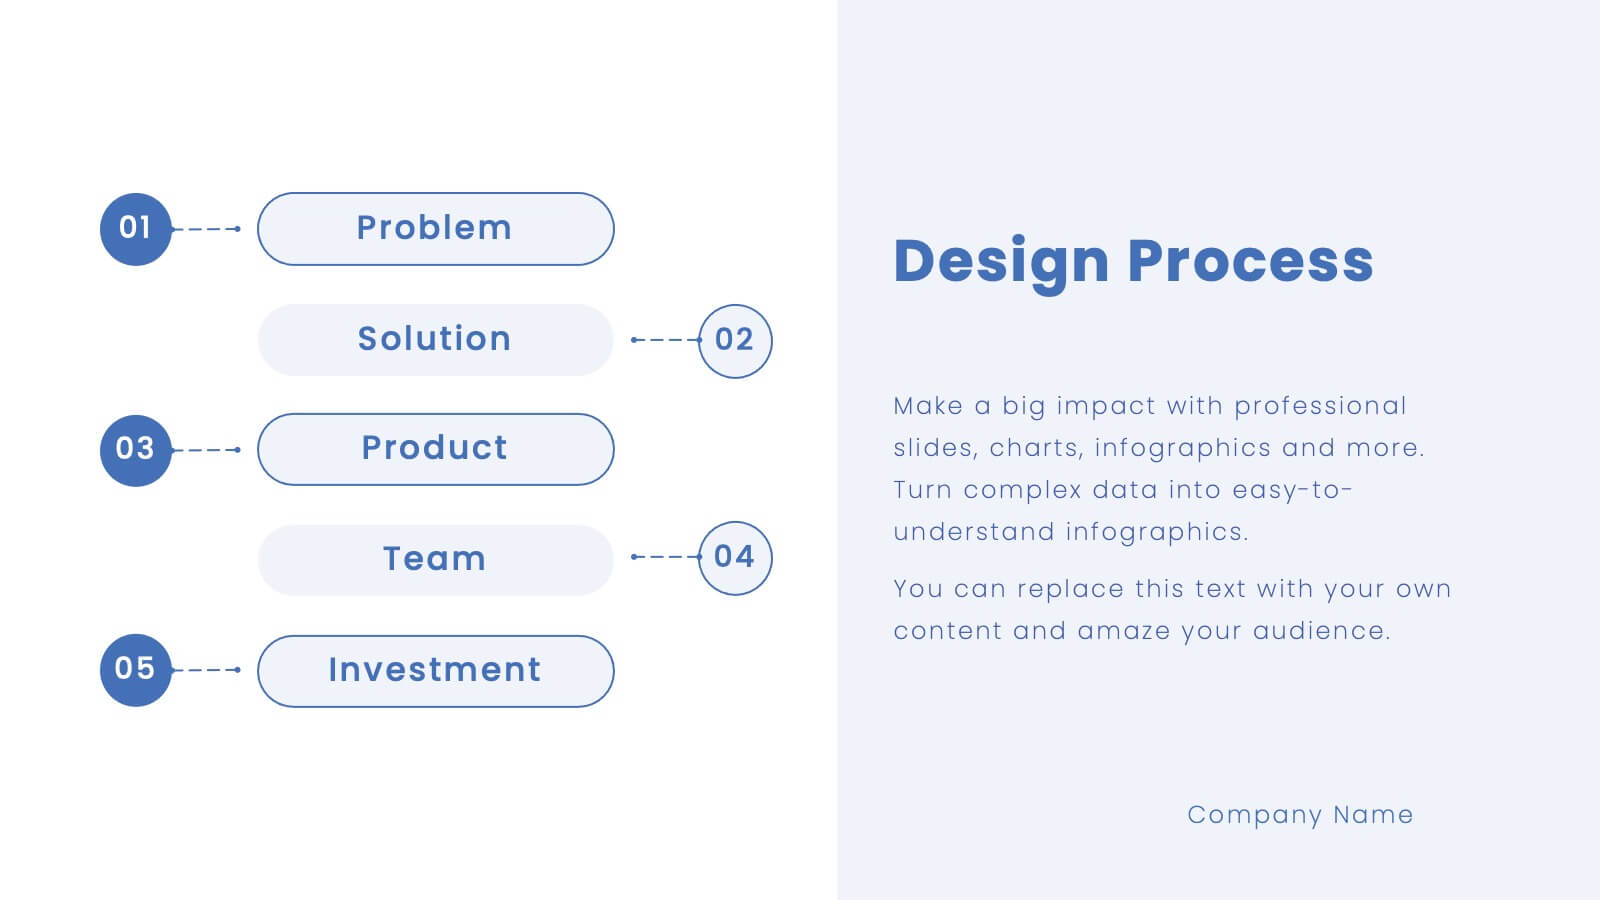
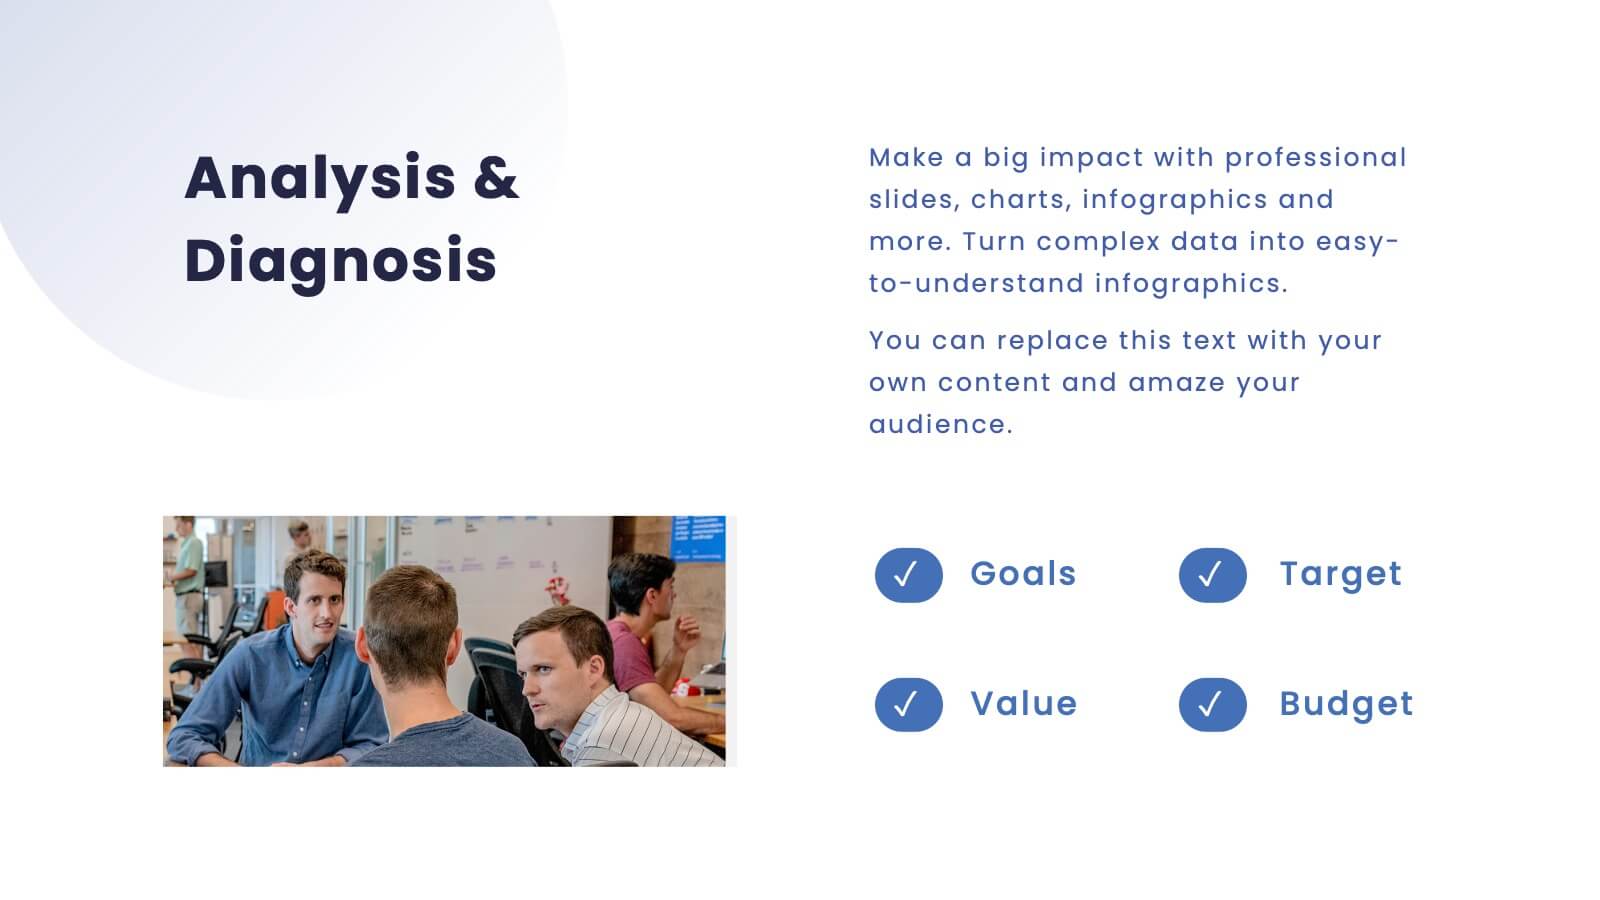
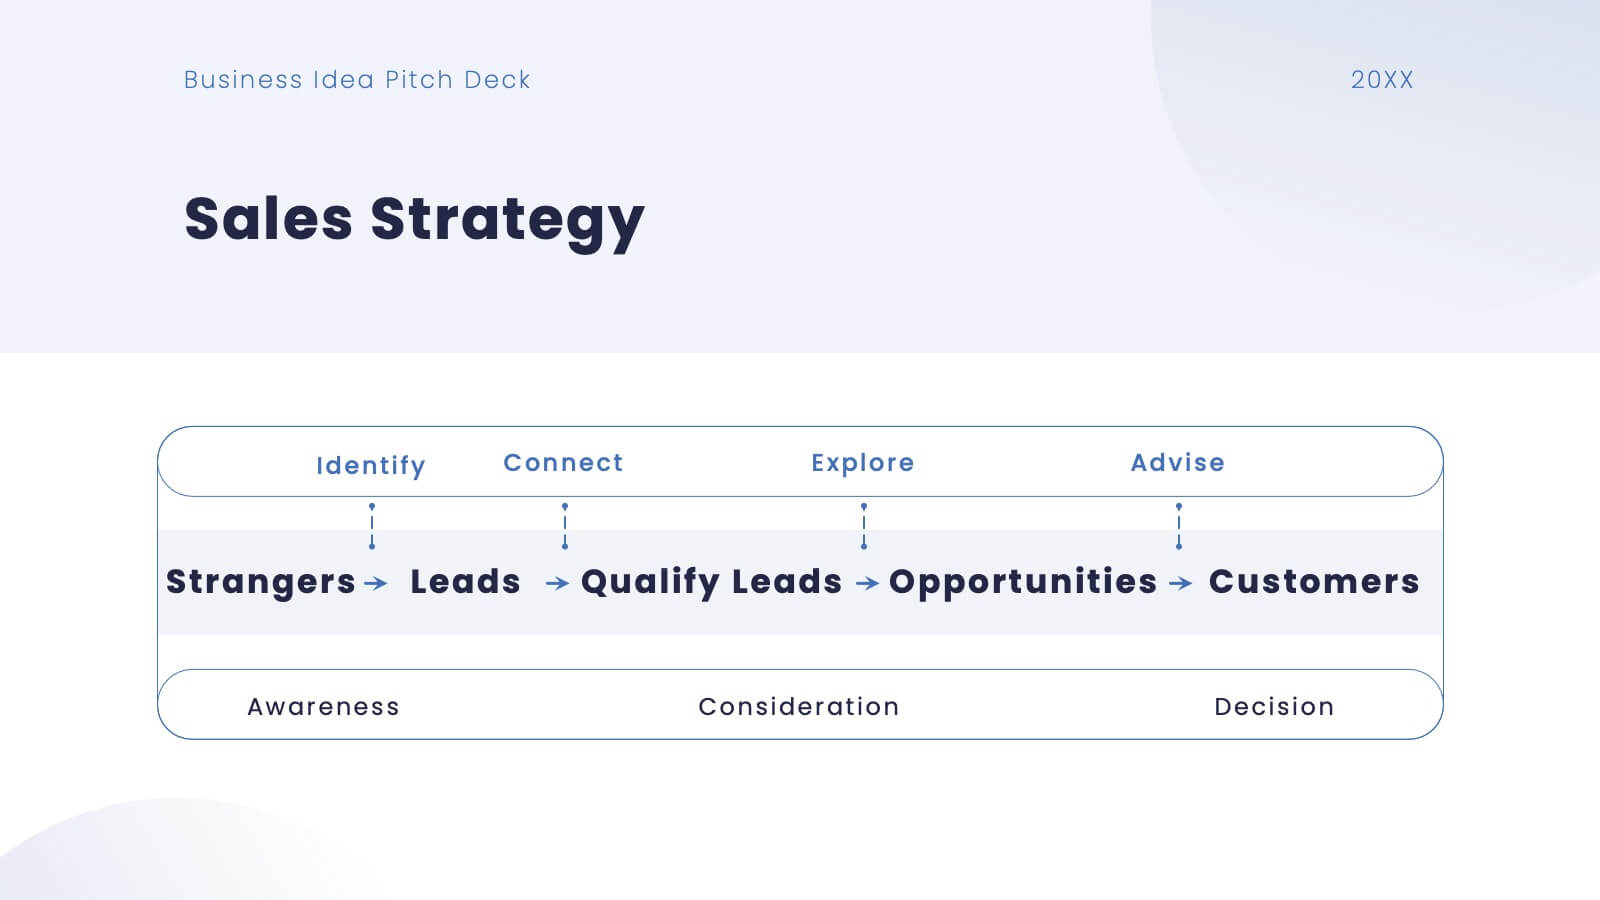
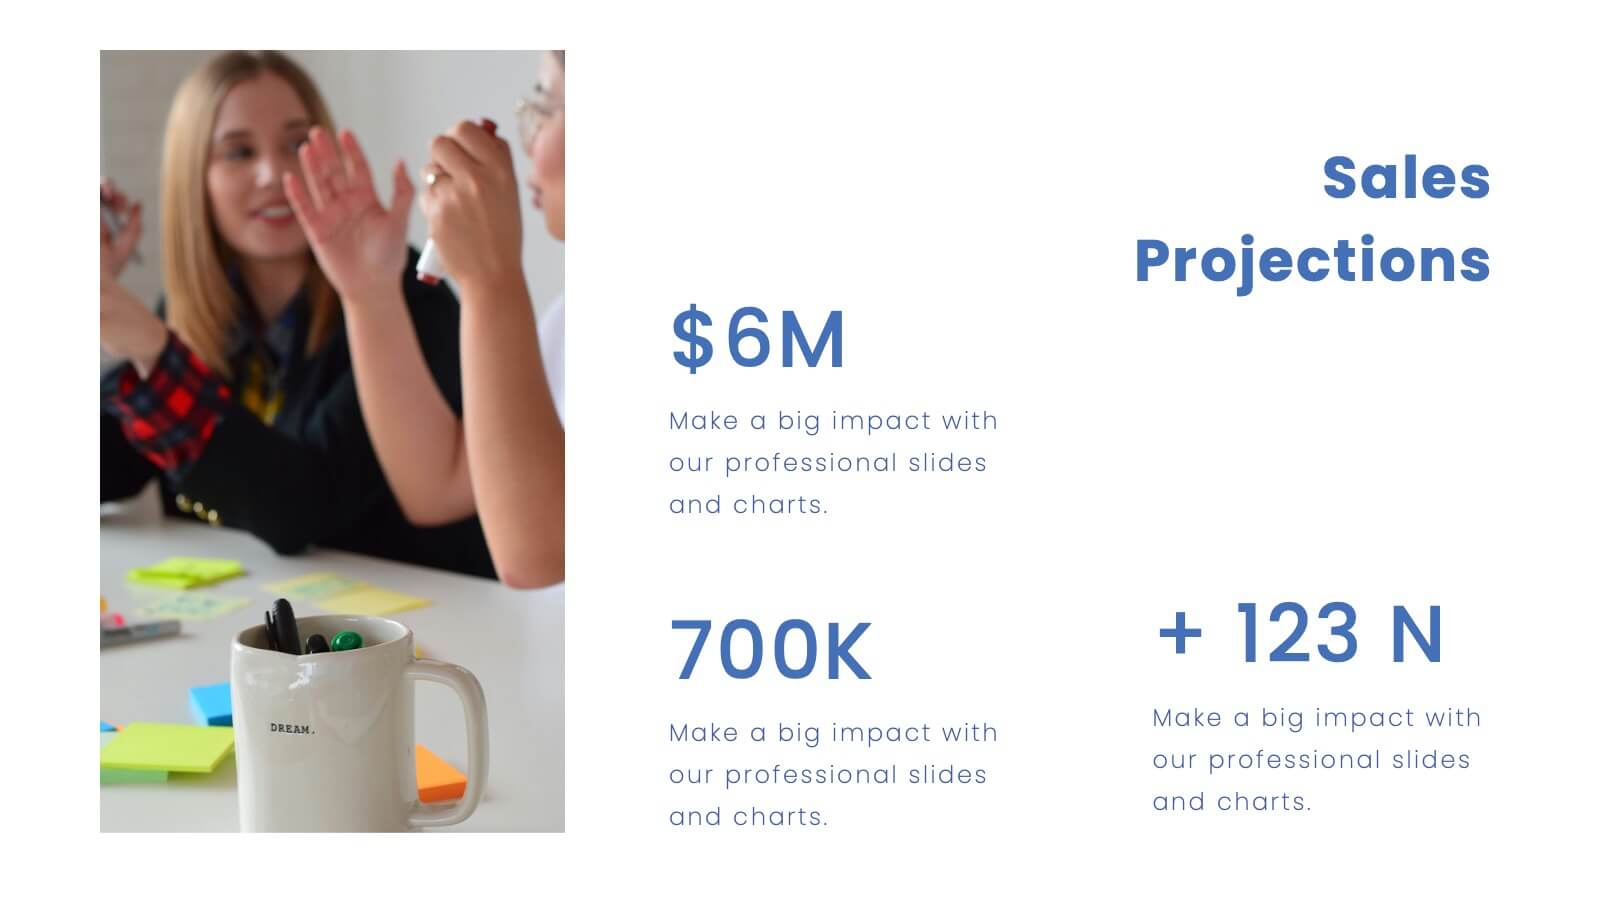
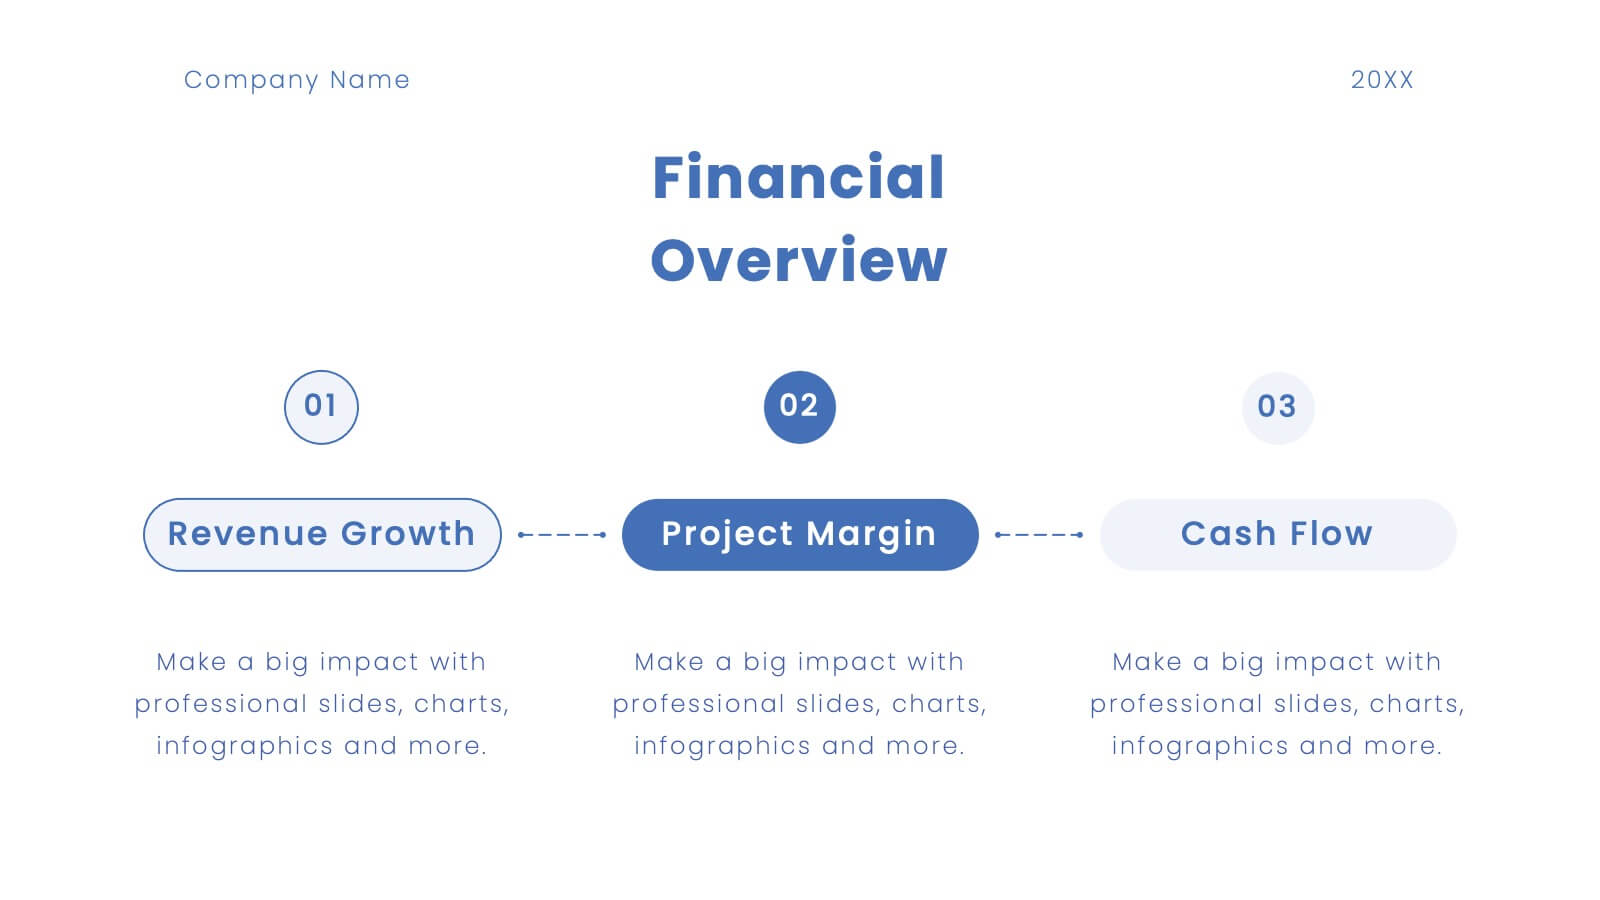
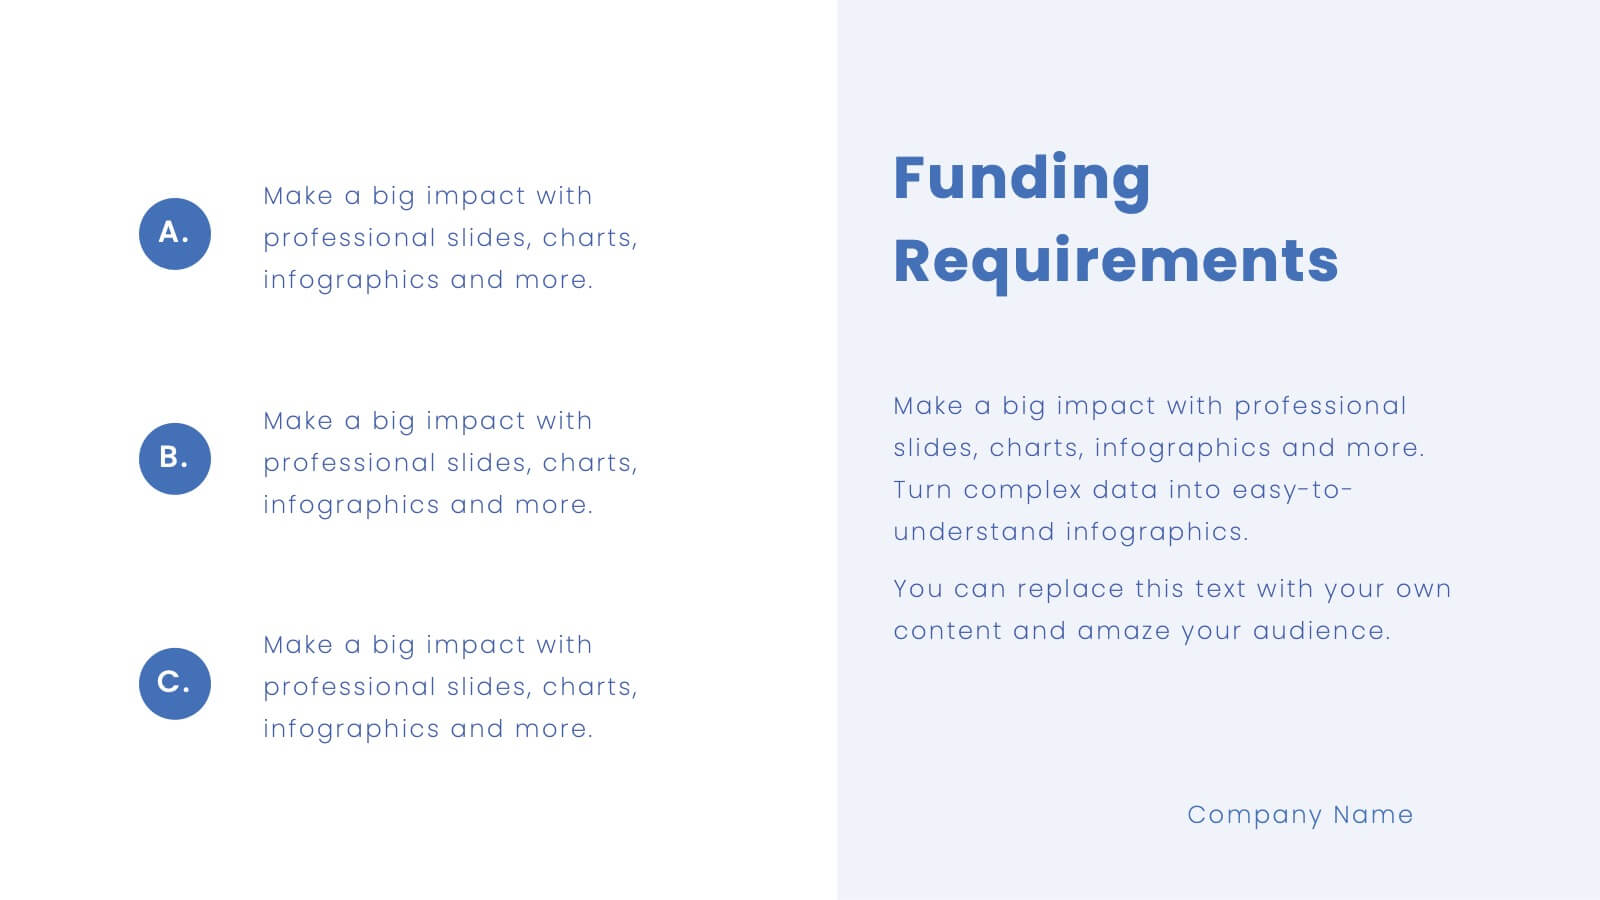
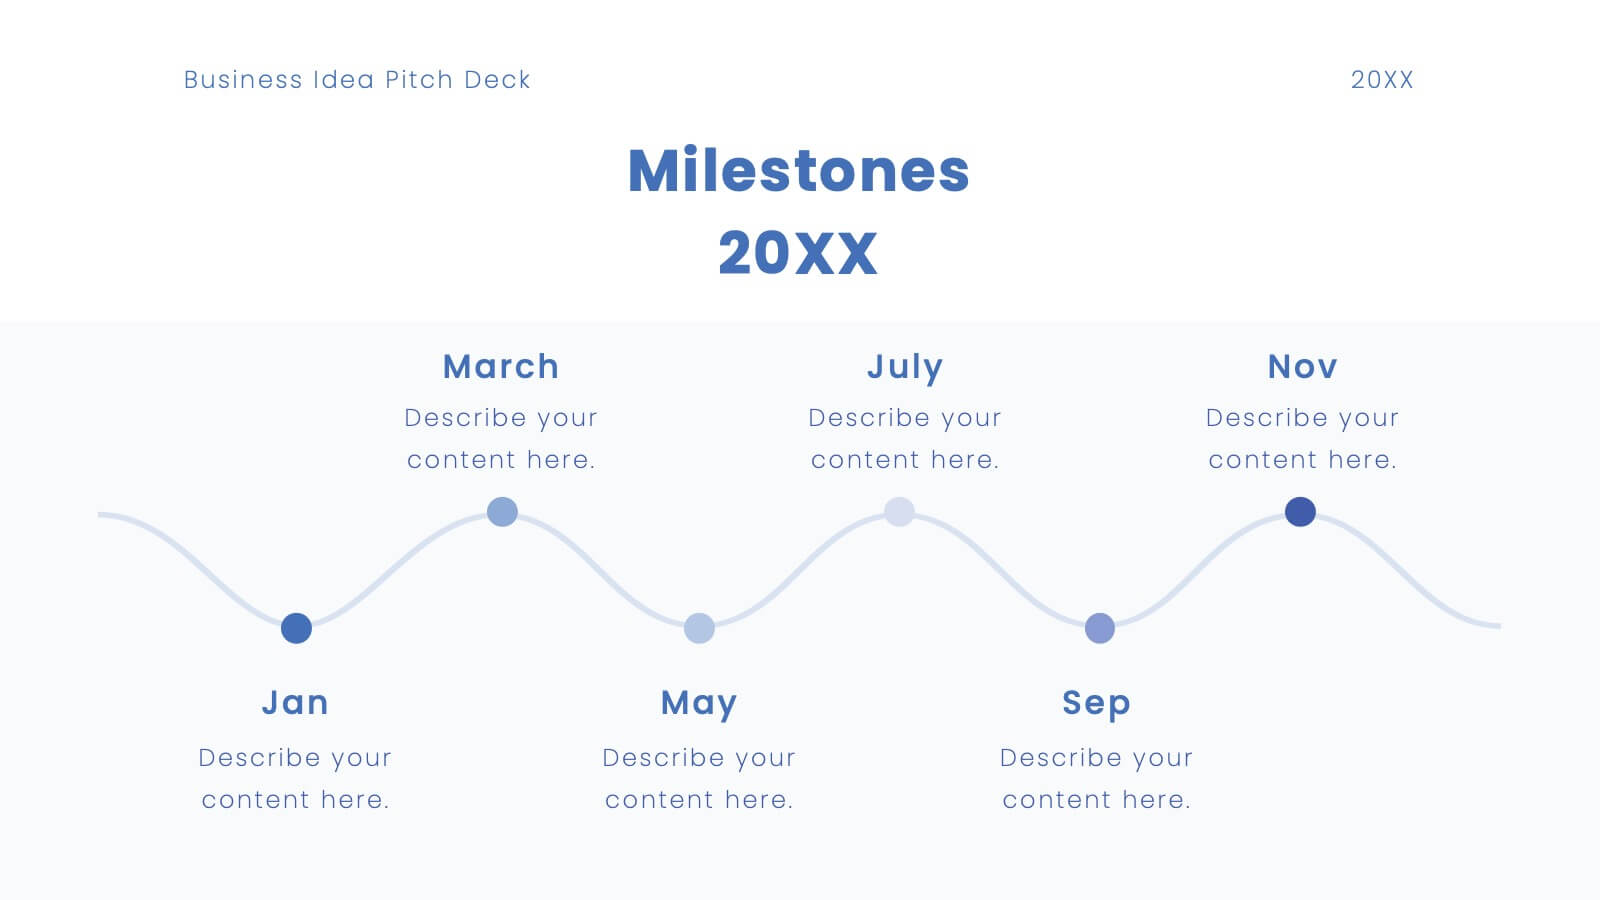
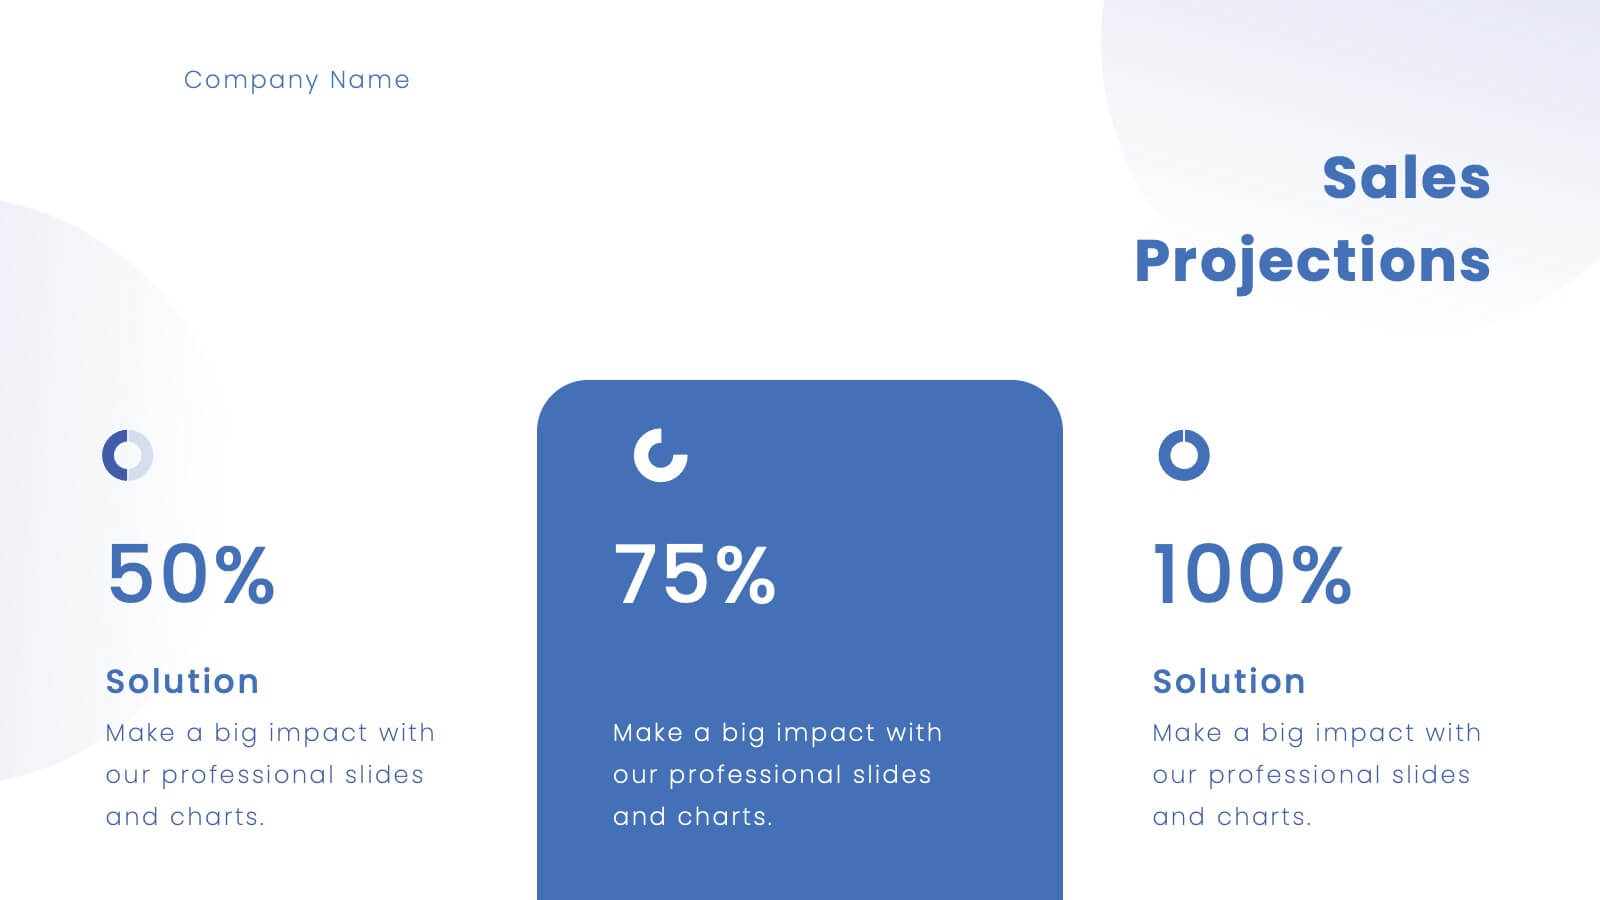
Platinum Business Idea Pitch Deck Presentation
Present your business idea with this sleek and professional pitch deck template! It includes everything from market opportunities to financial projections and sales strategies, providing a comprehensive structure for your pitch. Fully customizable and compatible with PowerPoint, Keynote, and Google Slides, this template is ideal for impressing investors and stakeholders.


6 slides
Technology Education Infographic
Technology education refers to the teaching and learning of skills, knowledge, and concepts related to technology. This infographic template is designed to present key information about technology education in a concise manner. It aims to educate and inform the audience about the importance of technology education and its impact on students' learning and future careers. The template utilizes visually appealing icons, illustrations, and graphics to enhance understanding and engagement. It includes images of computers, coding symbols, robots, and other technology-related visuals that help to reinforce the information presented.


7 slides
Success Business People Infographic Presentation
A Business People Infographic is a visual representation of data and information related to various aspects of business and the people involved in it. This infographic is a great way to illustrate your topic, point by point. This is an ideal template for making professional business presentations. This template is fully editable, perfect for business presentations and meetings. It includes all of the graphics you need to shows your audience interesting statistics and data. Compatible with Powerpoint, Keynote and Google Slides, your audience will be impressed by the dynamic slides!


7 slides
Circle Process Infographic
A Circle Process is a method used to involve a group of people in problem-solving and decision-making. The process is based on a circle shape, where everything is in a circle facing each other. The template includes vibrant colors and circle process charts that you can customize to make just right for your project. This template is perfect for any project or presentation school or business related. This circle process template works with Powerpoint, Keynote, and Google Slides, so you can use it on any device. This template is great for teamwork, community building, and conflict resolution.


7 slides
Leadership Infographic Presentation Template
Leadership is a vital function of management. It helps to direct an organization's resources toward improved efficiency and the achievement of goals. While leadership can be defined in many ways, it is best explained as the ability to motivate and inspire others through example, providing them with direction and being a source of inspiration for those under your authority. This template is designed for you to build the key skills of leadership. Leadership is important for the success of any organization. This template will help you identify your leadership strengths and how to use them.


5 slides
Minimal Watercolor Aesthetic Presentation
Bring a soft artistic touch to your ideas with this clean, watercolor-inspired layout designed for simple, modern storytelling. The slide helps you highlight key points with gentle color accents that feel elegant yet professional, making complex insights easier to follow. Fully compatible with PowerPoint, Keynote, and Google Slides.


5 slides
RACI Role Assignment Matrix Overview Presentation
Clarify team responsibilities with the RACI Role Assignment Matrix Overview Presentation. This professional template helps define who is Responsible, Accountable, Consulted, and Informed across key project tasks. Perfect for streamlining communication, reducing overlap, and improving accountability. Fully editable in PowerPoint, Canva, and Google Slides.


4 slides
Sales Performance Heat Map Overview Presentation
Get a quick visual pulse on your data with the Sales Performance Heat Map Overview Presentation. Ideal for showing activity levels or trends across time, this slide uses a gradient color scale to help teams identify high and low performance instantly. Fully editable in Canva, PowerPoint, Keynote, and Google Slides—great for sales managers, team leads, and marketing analysts.