


Features
- 5 Unique slides
- Fully editable and easy to edit in Microsoft Powerpoint, Keynote and Google Slides
- 16:9 widescreen layout
- Clean and professional designs
- Export to JPG, PDF or send by email


Do you have any questions?
Recommend


5 slides
Marketing Sales Funnel Presentation
Watch your customer journey come to life with a clean, visual flow that makes each stage easy to understand at a glance. This presentation breaks down your funnel into clear steps, helping you explain conversions, behaviors, and strategy with confidence. Fully compatible with PowerPoint, Keynote, and Google Slides.


2 slides
Jobs to Work From Home Illustrations
Empower your remote workforce with our jobs to work from home illustrations pack. These are designed to ignite the spark of remote work possibilities and bring a burst of energy to your presentations! Fully compatible with PowerPoint, Google Slides, and Keynote, they're easy to add to any presentation. Step into the world of remote work with these dynamic illustrations that capture the essence of modern work trends. Download the jobs to work from home illustrations today!


6 slides
Environmental Policy and Sustainability Plan Presentation
Bring your sustainability message to life with a visual that flows as smoothly as your plan. This infographic presentation template helps explain your environmental goals, action steps, and policy structure using a dynamic, easy-to-follow circular layout. Perfect for eco reports and green strategy briefs. Compatible with PowerPoint, Keynote, and Google Slides.


5 slides
Operational Structure Layout Presentation
Visualize team hierarchies and departmental flow with this operational structure layout. Ideal for displaying reporting lines, management roles, or project leads. Clean, minimal, and easy to edit in Canva, PowerPoint, or Google Slides—perfect for internal presentations, HR planning, or business development overviews. Keep your structure clear and professional.


6 slides
Project Schedule Timeline Presentation
Plan, track, and showcase progress with this sleek timeline layout designed to visualize every milestone with clarity. Ideal for organizing project phases, deadlines, or deliverables, it helps communicate workflows efficiently and professionally. Fully editable and compatible with PowerPoint, Keynote, and Google Slides for easy customization and seamless presentation design.


4 slides
Soft Watercolor Background Slides Presentation
Add a soft, elegant touch to your presentation with this Soft Watercolor Background Slides Presentation. Designed with gentle gray brushstroke textures and clean, modern layout, it's perfect for conveying ideas clearly while maintaining visual appeal. Ideal for creative, wellness, or professional topics. Fully editable in PowerPoint, Google Slides, and Canva.


20 slides
Legacy Product Launch Presentation
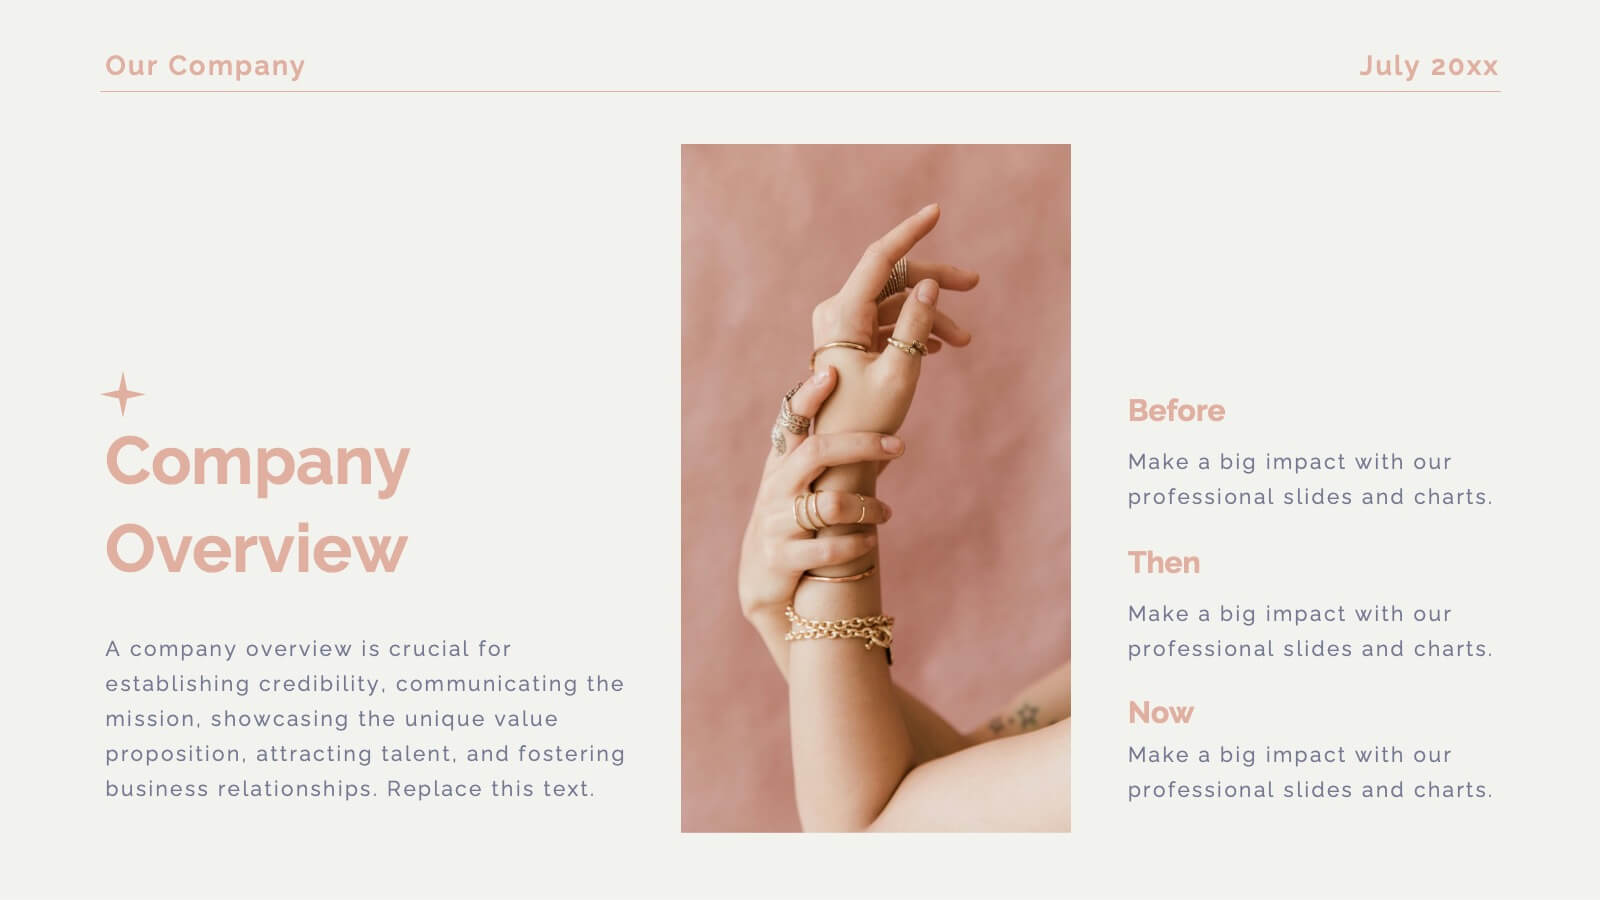
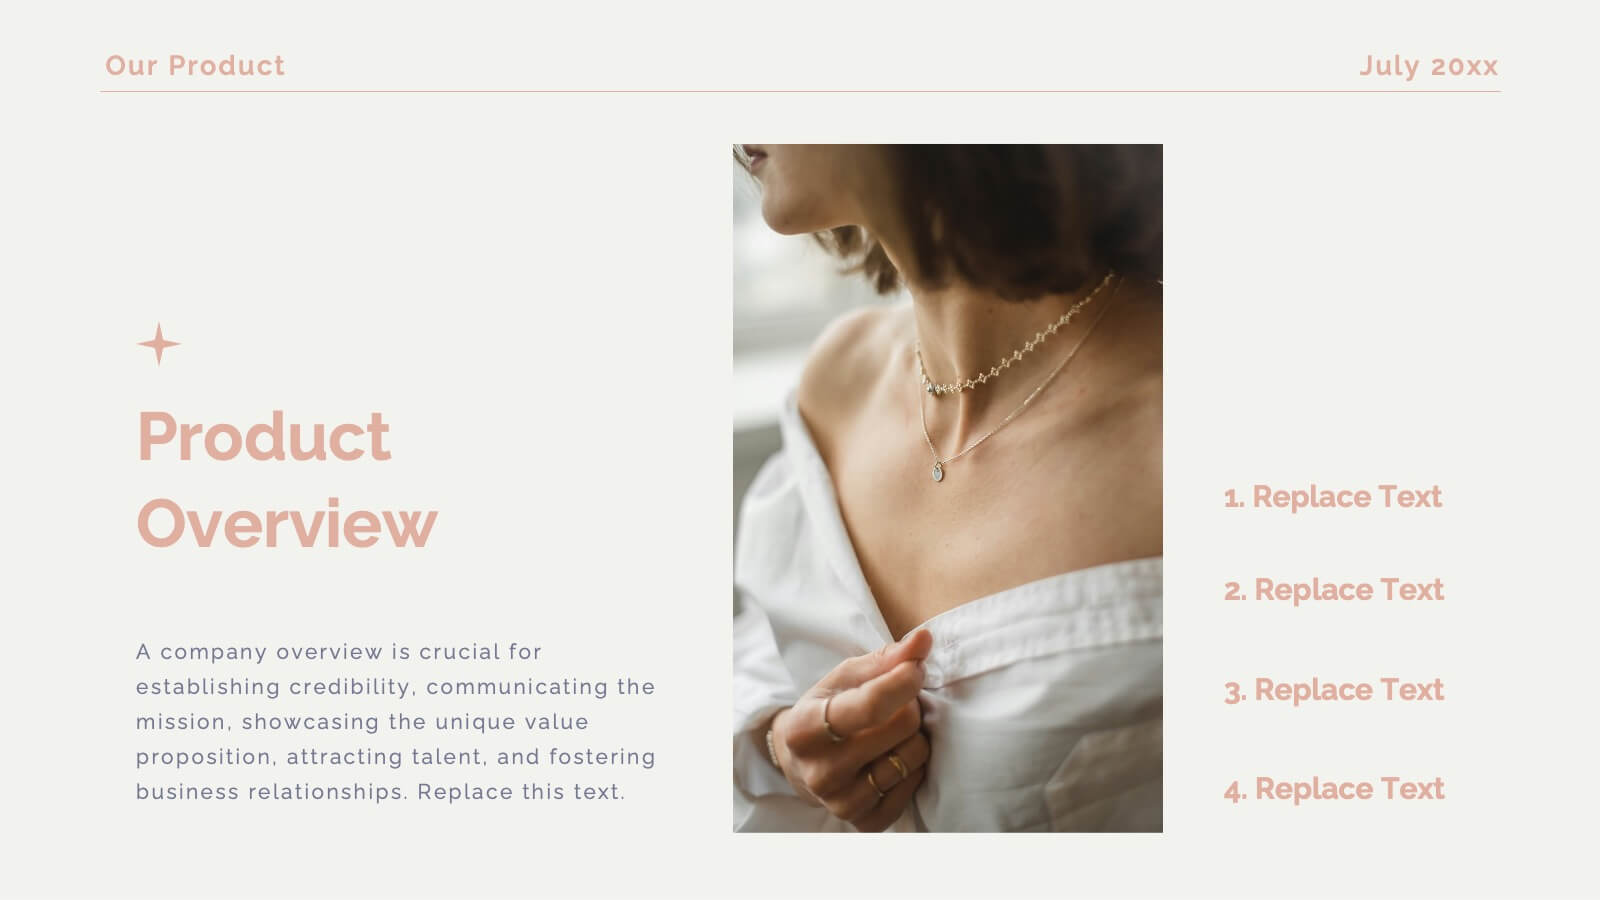
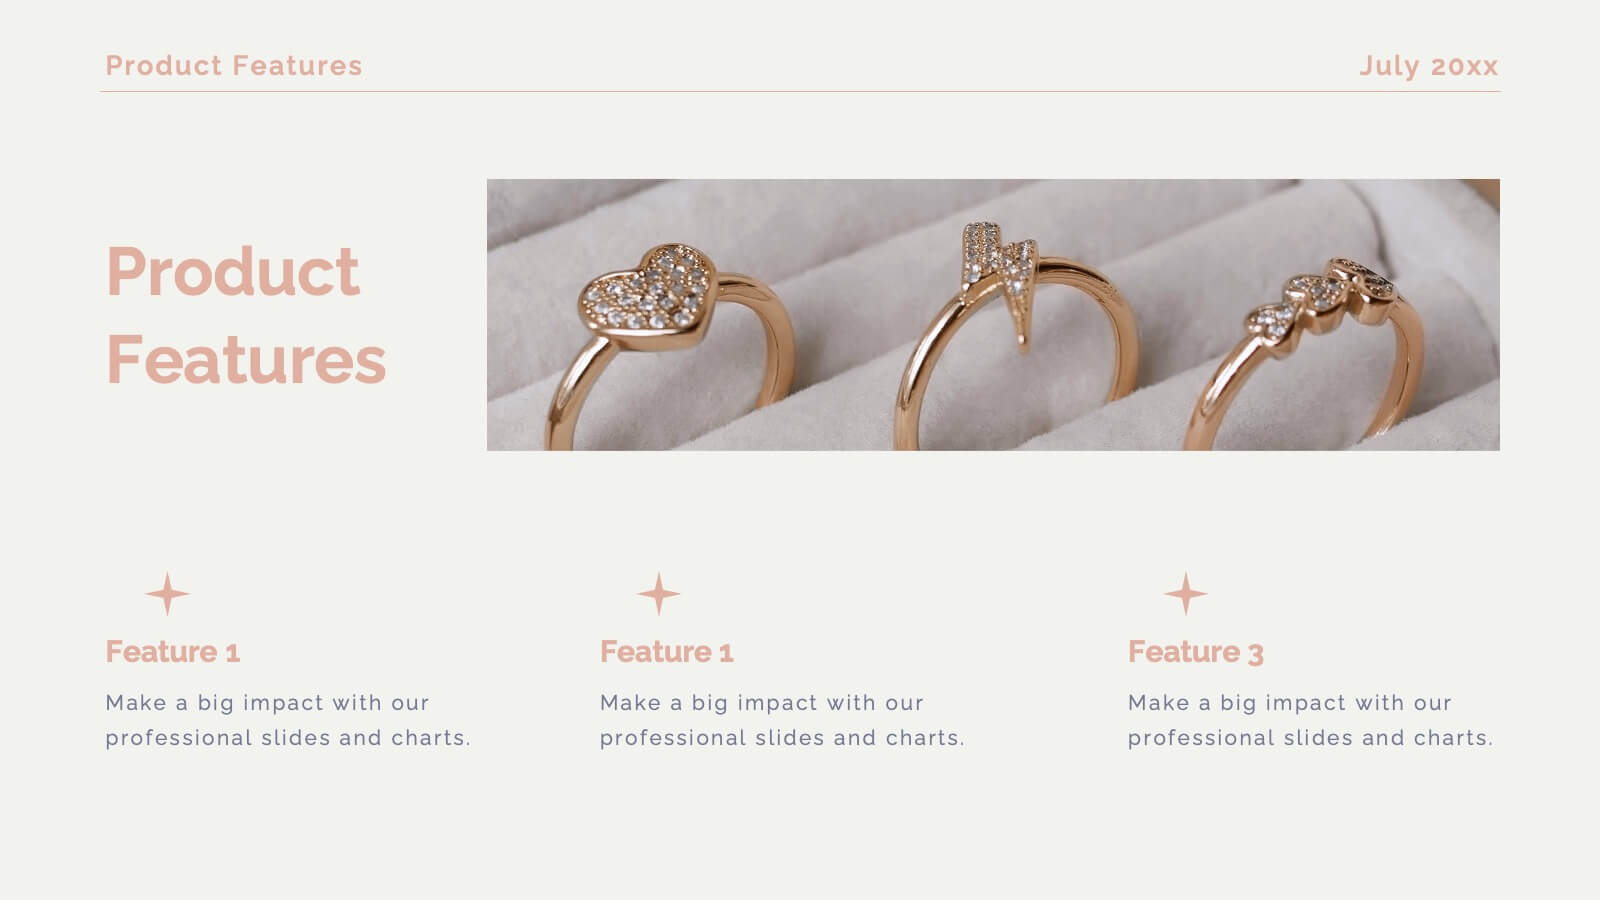
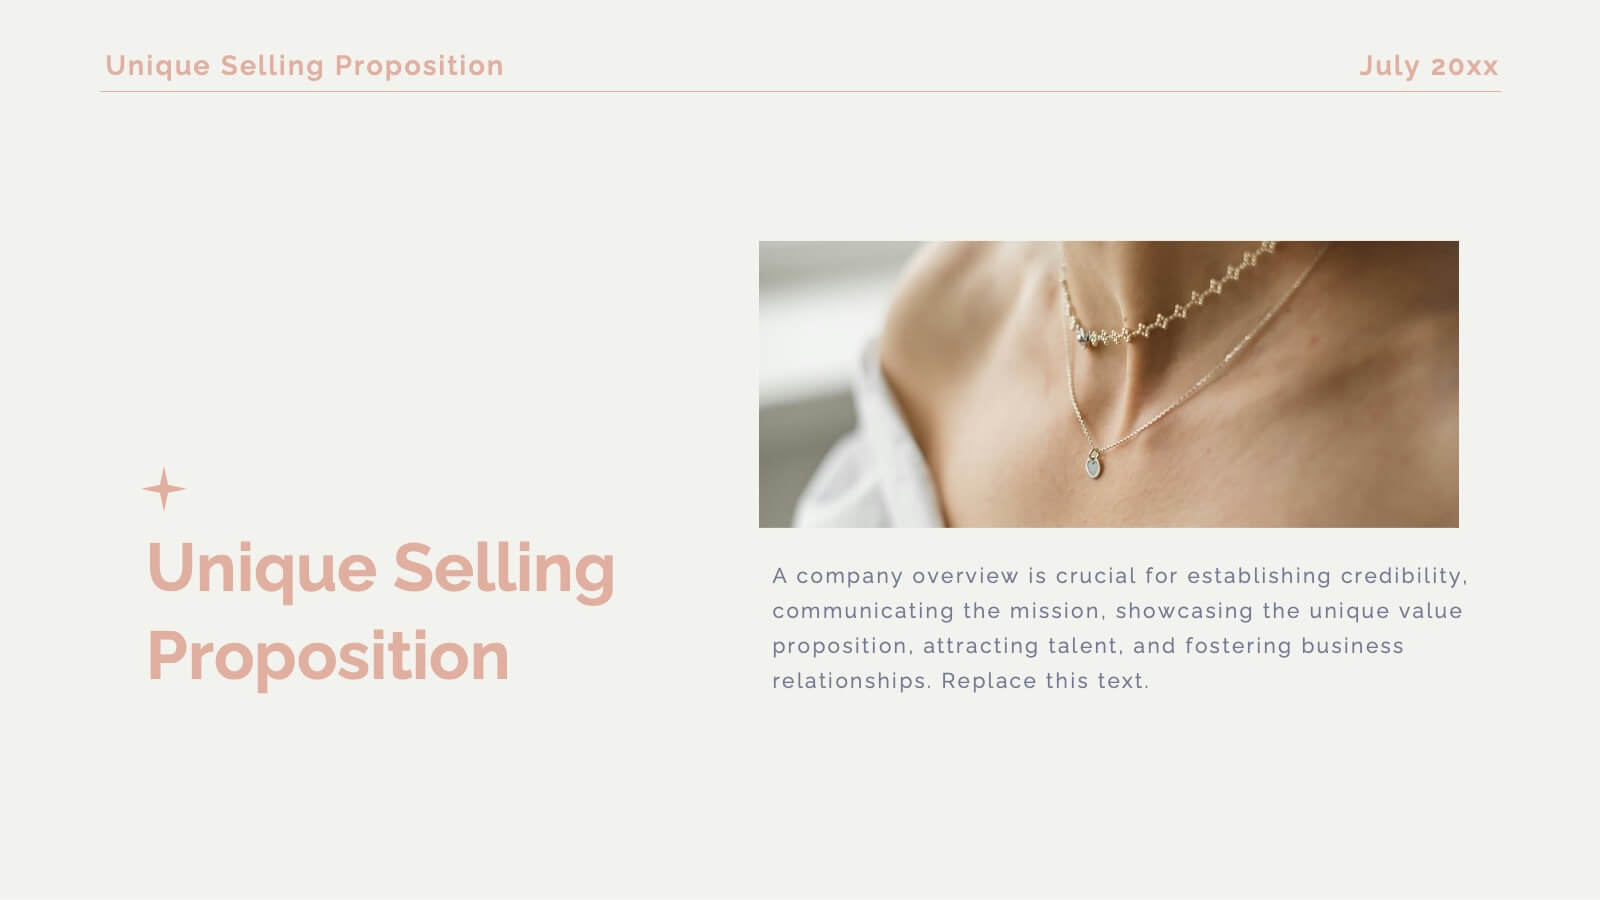
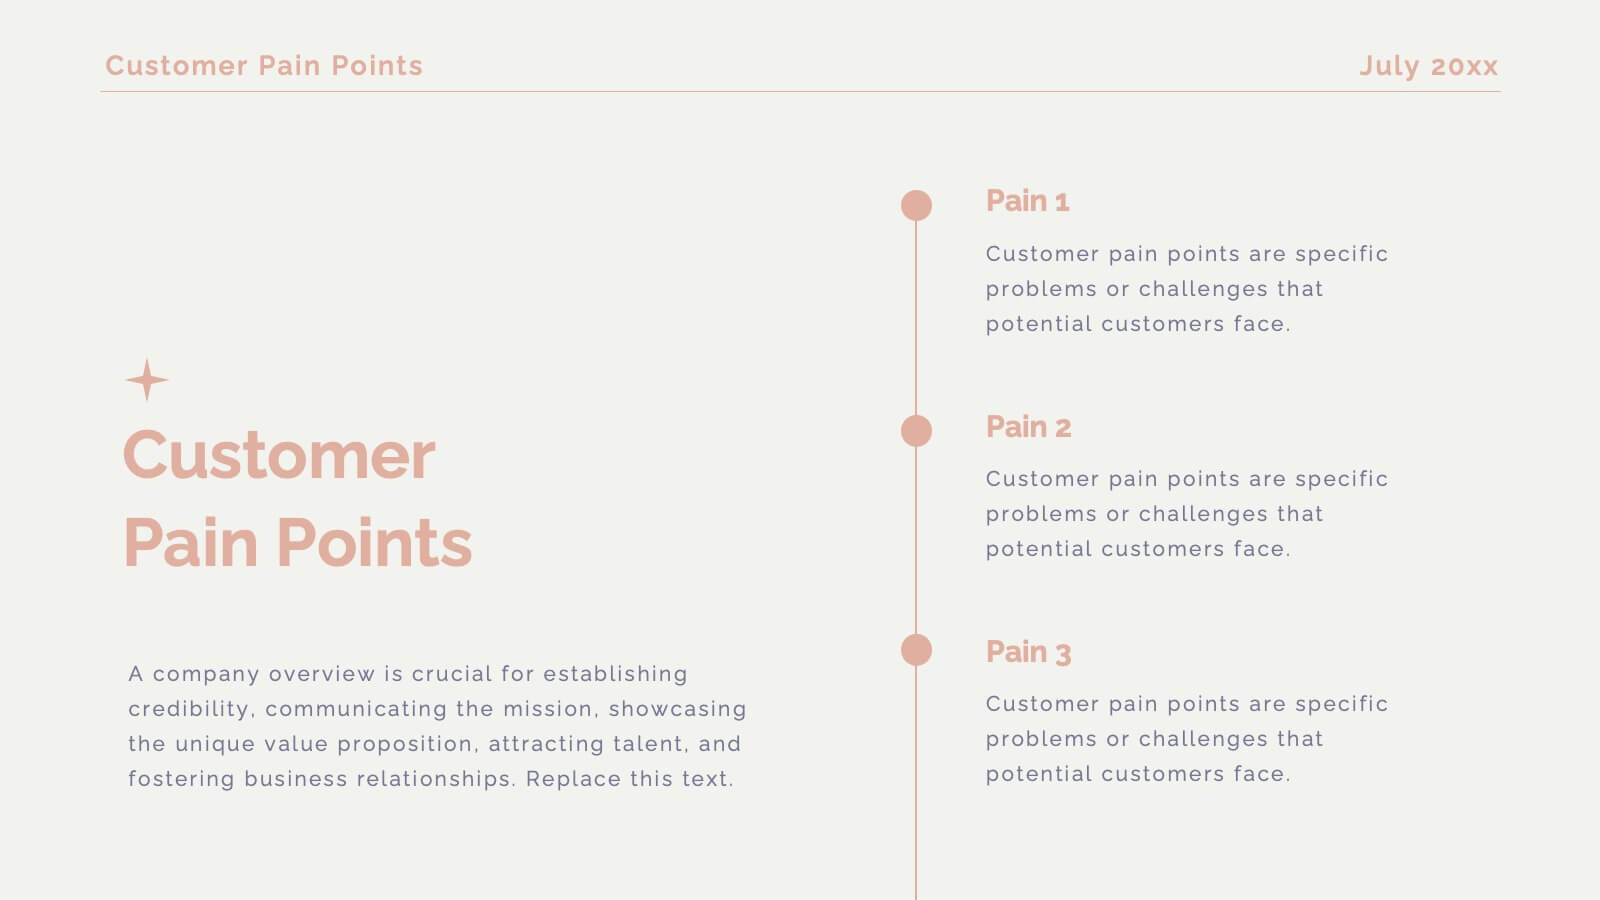
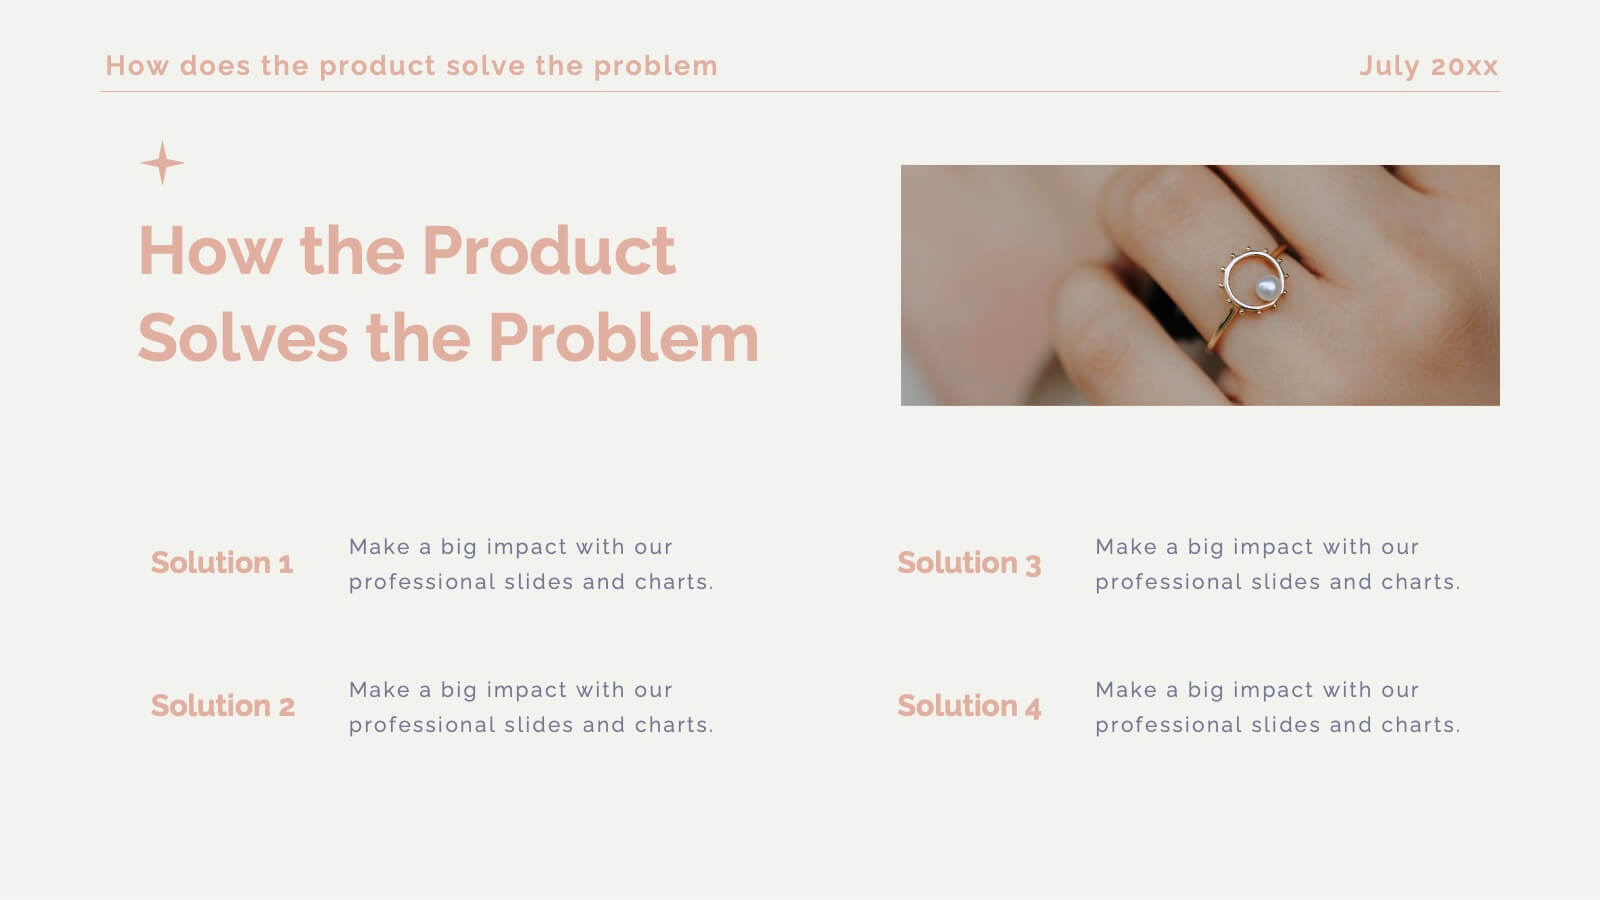
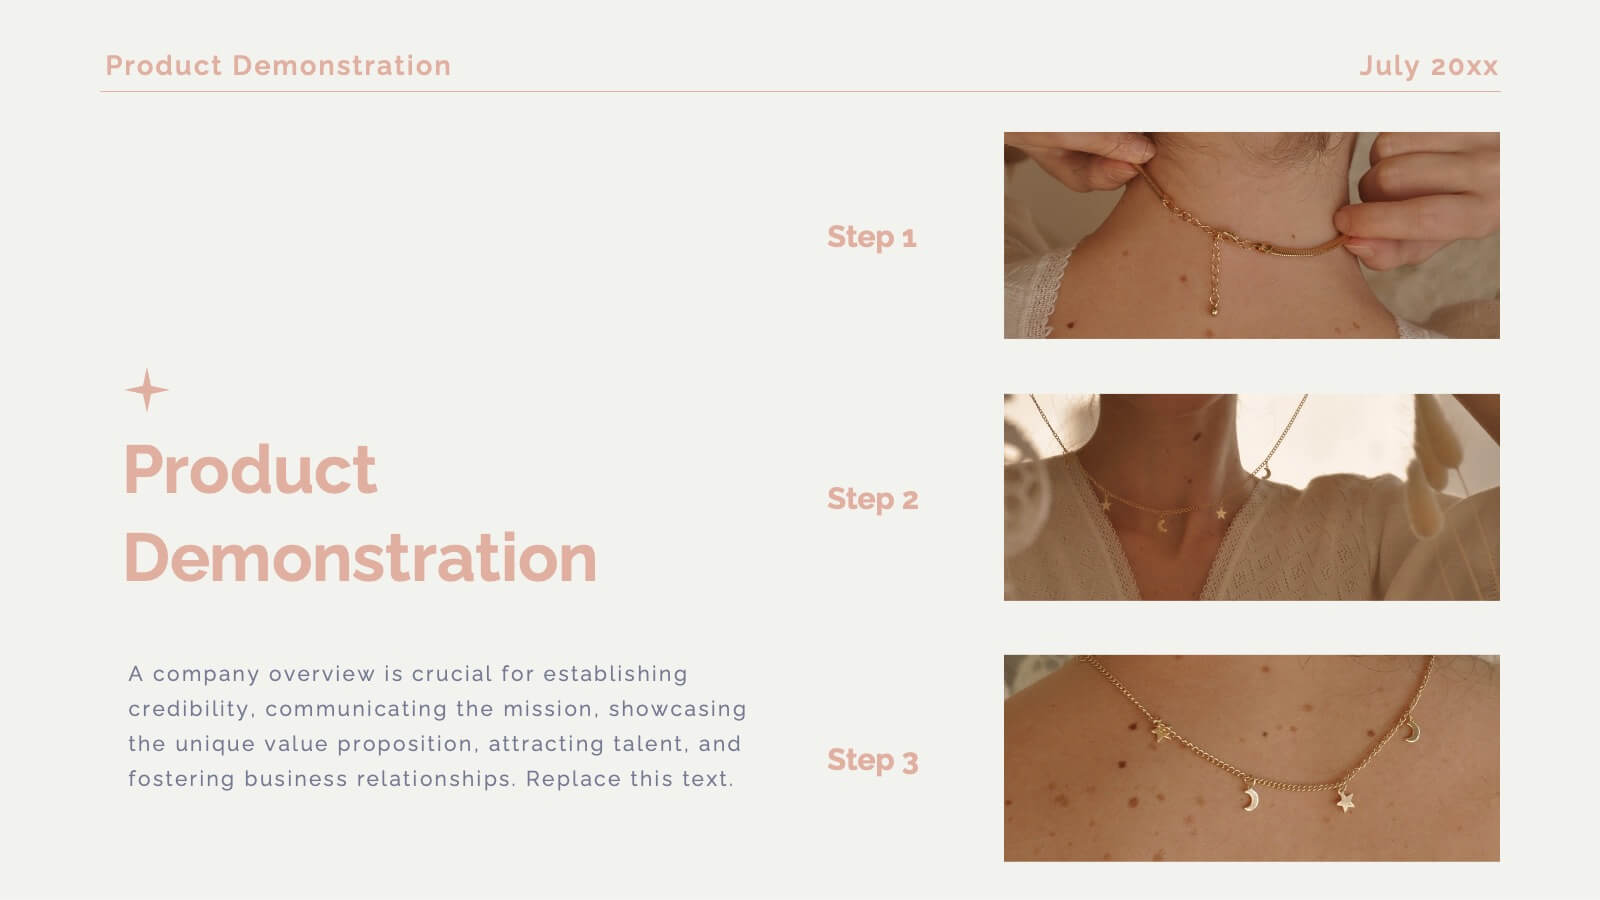
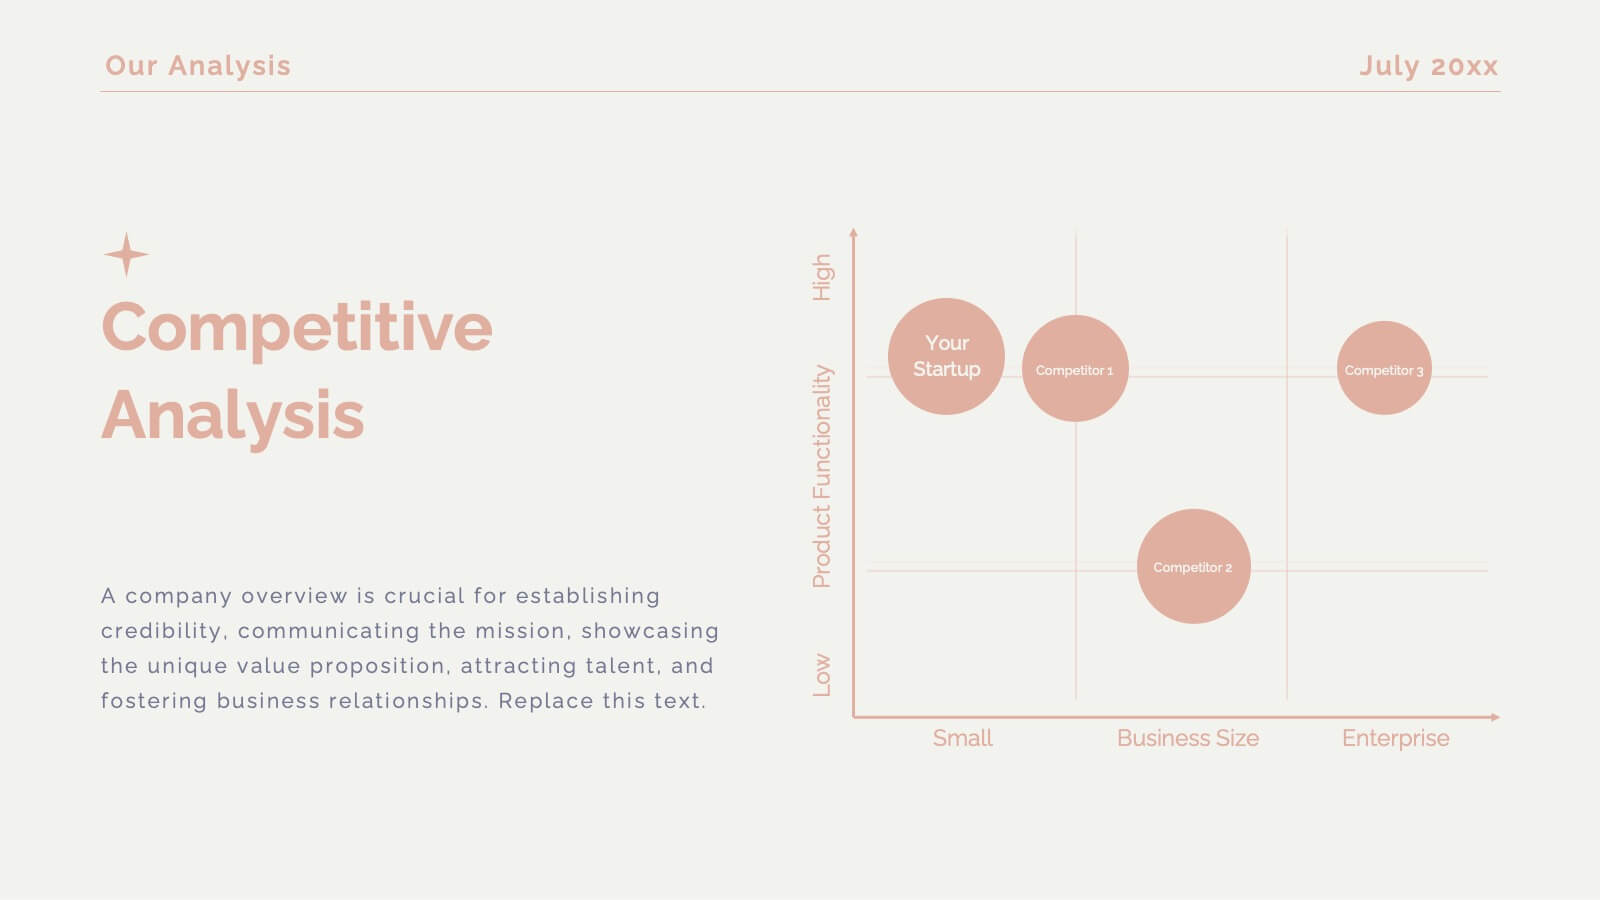
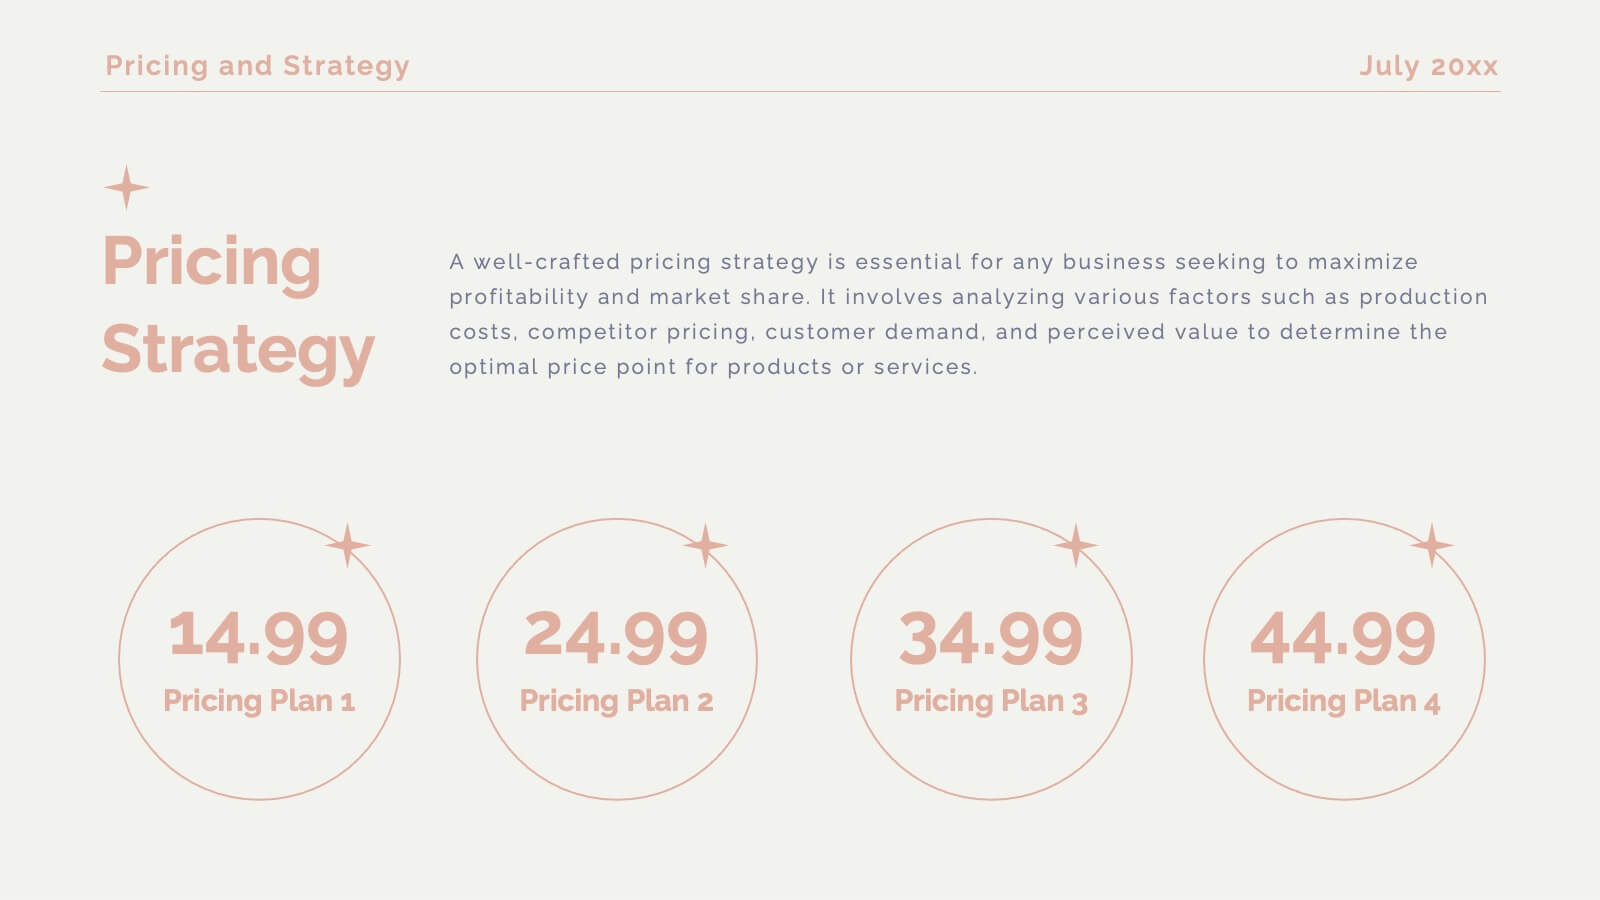
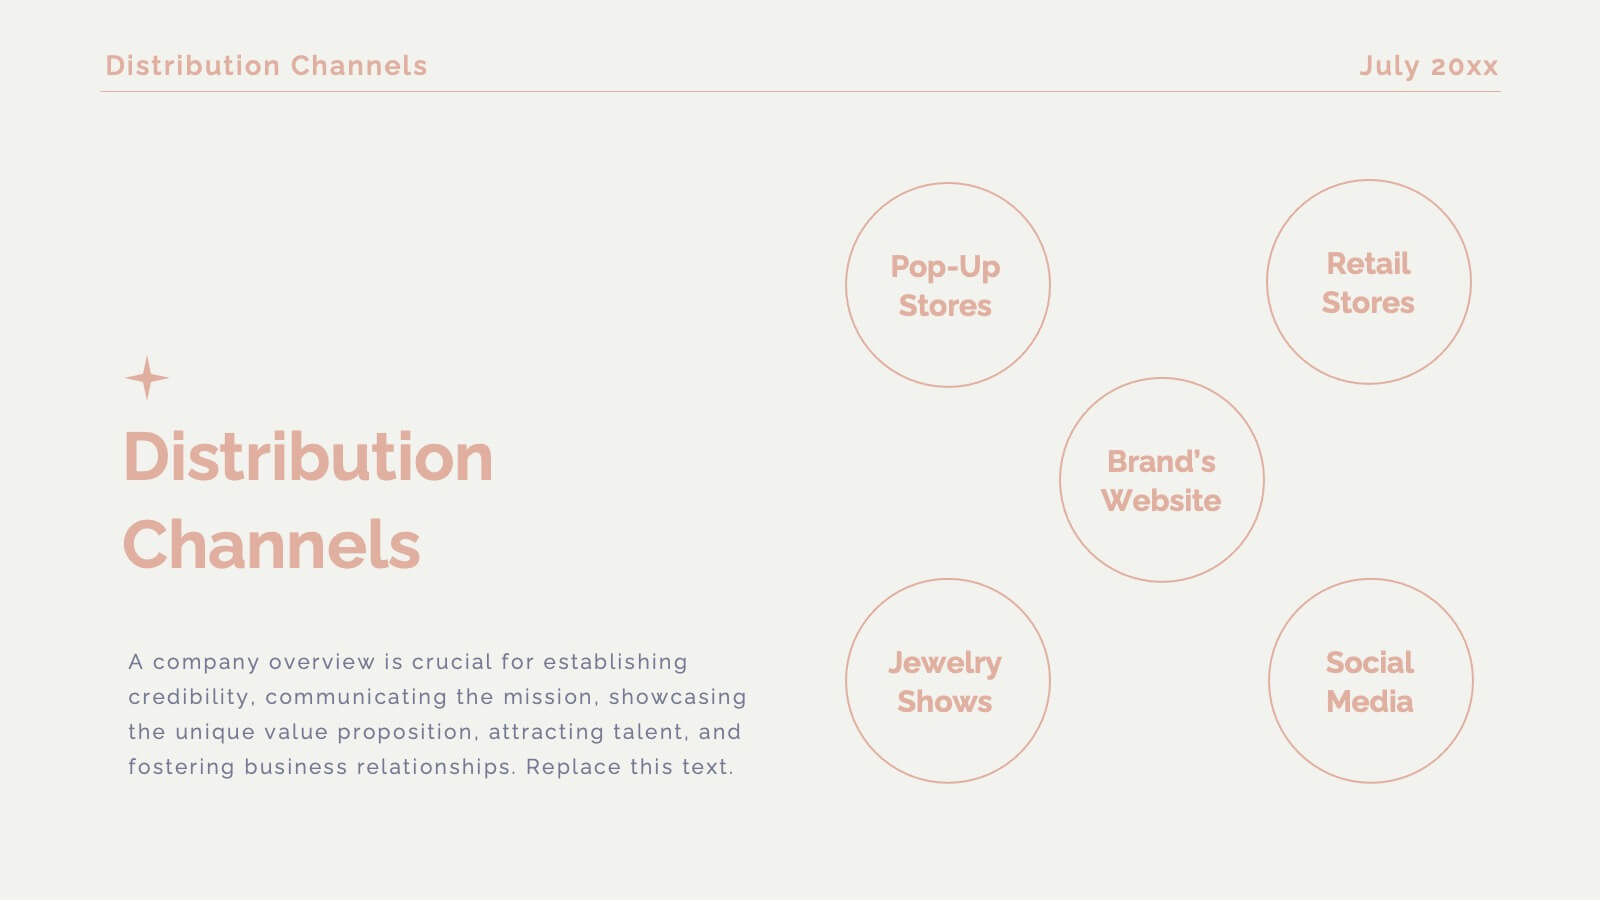
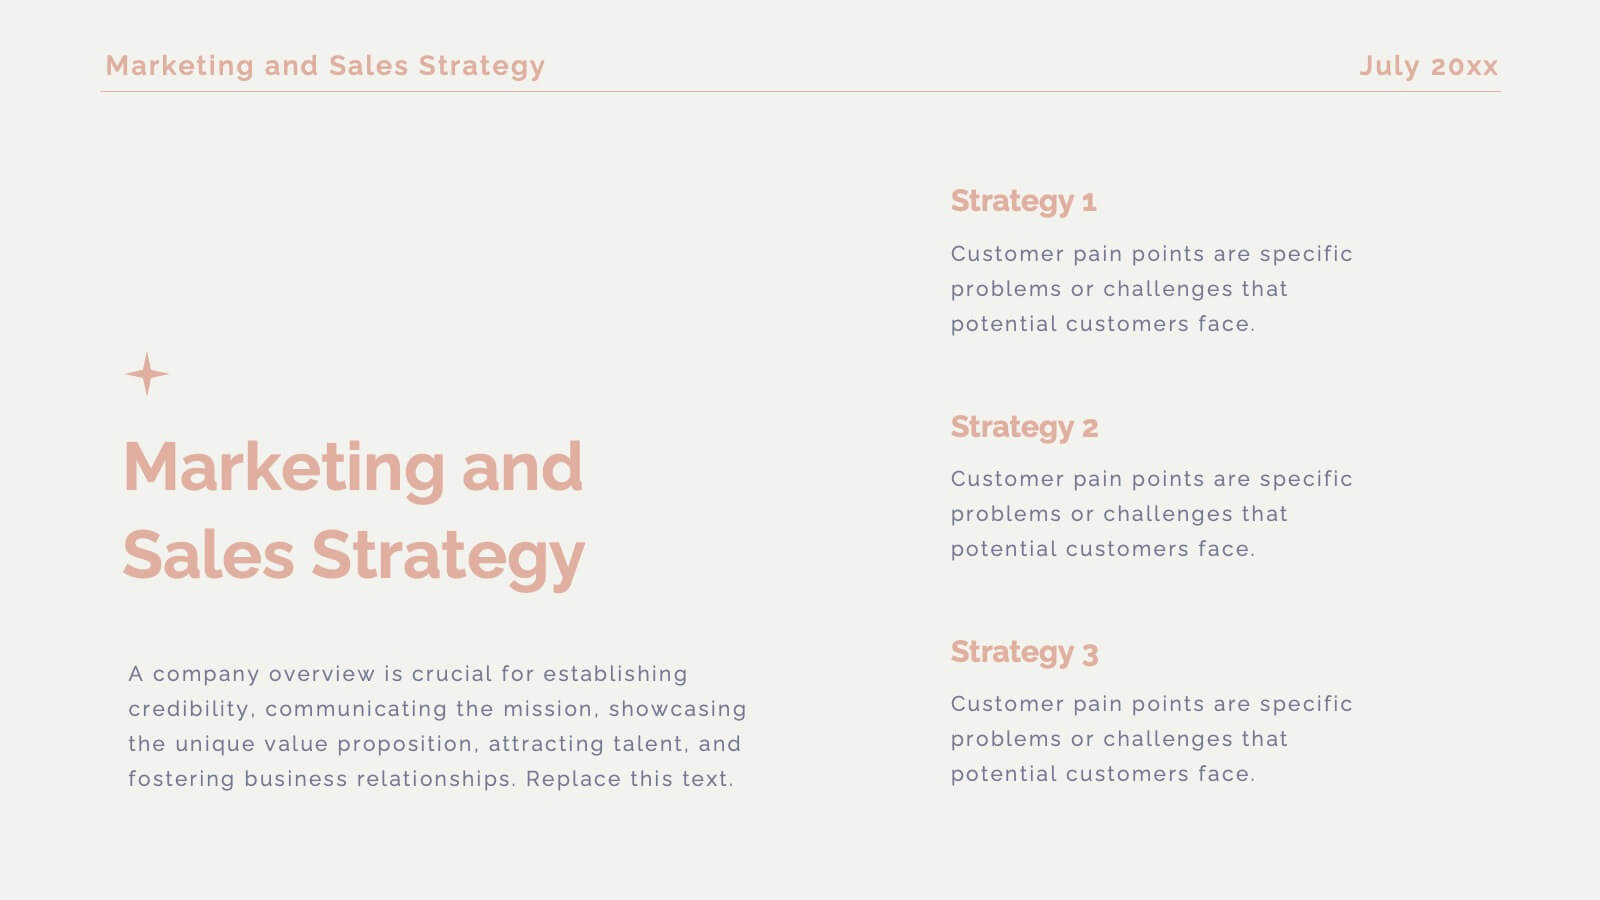
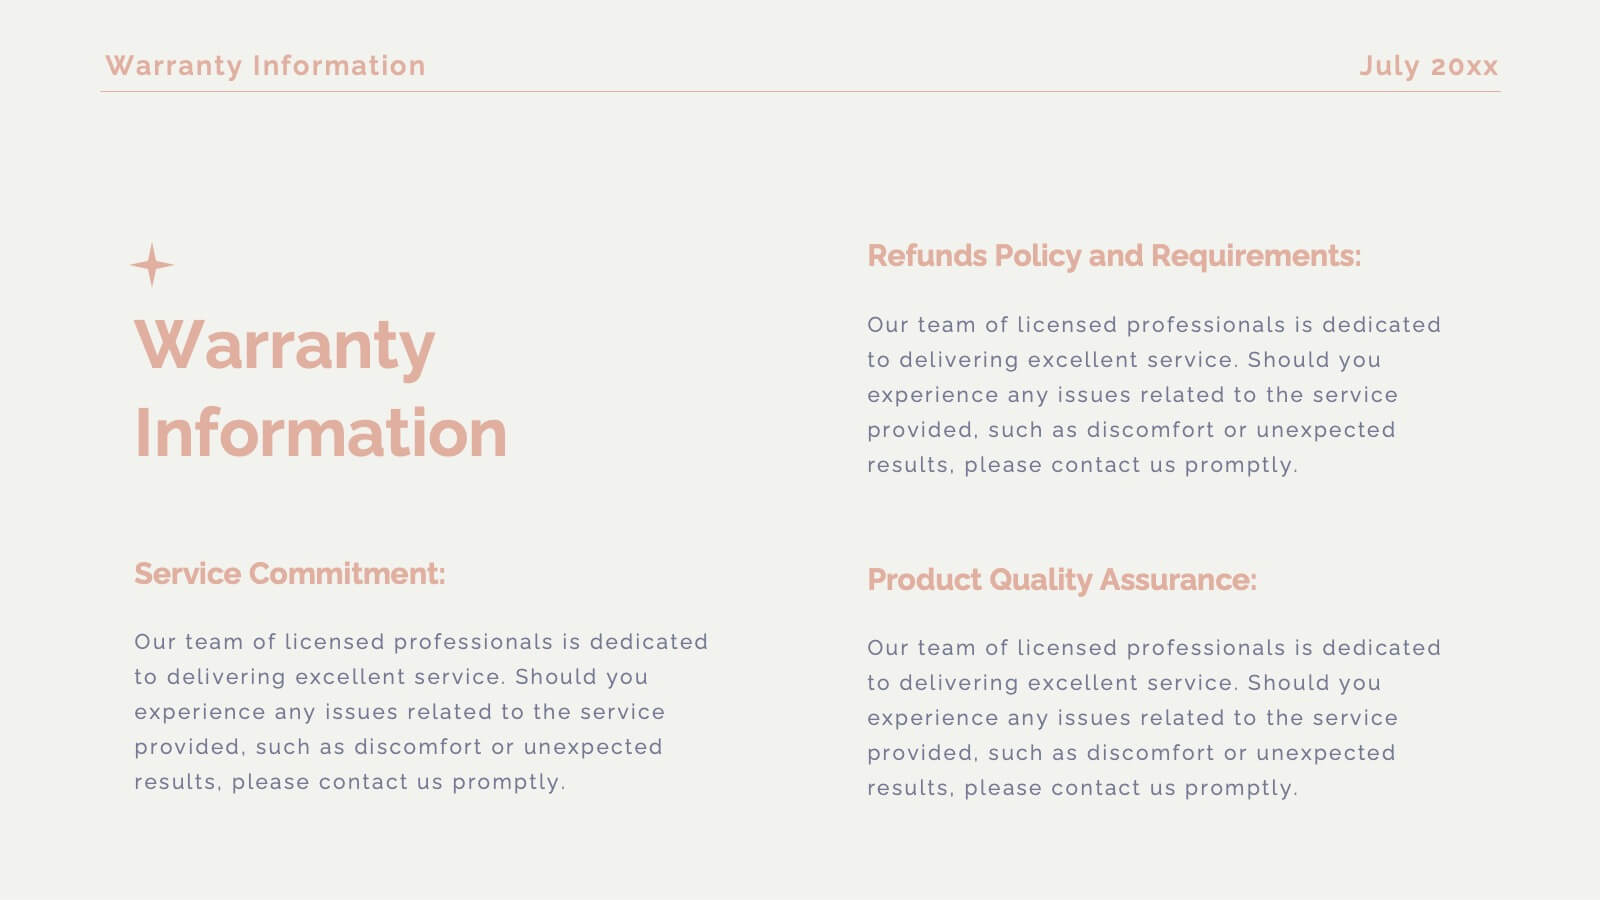
Get ready to unveil your product with a stunning and sophisticated launch template designed to captivate and convert! This template offers everything you need to present your product in the most compelling way possible, from an inviting welcome slide to an in-depth company overview that sets the stage for your brand’s story. The sleek design highlights key product features, unique selling propositions, and a thorough competitive analysis that positions your product as the market leader. With sections dedicated to customer pain points, solutions, and a powerful product demonstration, this template ensures your audience understands the value and impact of your offering. It also includes critical details like pricing strategy, distribution channels, and manufacturing processes, giving a full picture of your product’s journey from concept to market. Compatible with PowerPoint, Keynote, and Google Slides, this template is your ultimate tool for a successful product launch that leaves a lasting impression!


4 slides
Cost Breakdown Table Presentation
Make your numbers speak with style using a clean, structured layout that simplifies pricing and cost analysis. This presentation is perfect for comparing plans, budgets, or expenses in a clear and visually engaging way. Fully editable and compatible with PowerPoint, Keynote, and Google Slides.


7 slides
Decision Process Infographic Presentation
A Structured Decision Process is crucial for individuals and organizations to make informed and effective decisions. This is a flexible template that allows you to create your presentation using PowerPoint, Google Slides or Keynote. It includes decision illustrations so that you have everything you need to explain the decision and to present the pros and cons of each option. With a stylish design and eye-catching elements you can use this infographic for presentations of any kind. For promoting a new product or service, making recommendations or simply to explain your next steps and decisions.


12 slides
Digital Threat Prevention Framework Presentation
Make cybersecurity visuals as clear as your strategy. This digital threat prevention infographic template helps break down complex security frameworks into visually engaging and easy-to-follow steps. Great for showcasing layered defenses or network protocols. Fully customizable and works seamlessly with PowerPoint, Keynote, and Google Slides.
5 slides
Feedback Rating Smile Icons Presentation
Light up your presentation with a playful visual that turns audience feedback into clear, colorful insights. This slide helps you compare ratings, highlight sentiment patterns, and present review data in a friendly, memorable way. Perfect for surveys, reports, and performance reviews. Fully compatible with PowerPoint, Keynote, and Google Slides.


4 slides
Product & Pricing Plan Matrix Presentation
Simplify complex pricing and product details with the Product & Pricing Plan Matrix Presentation. This structured grid layout is ideal for comparing multiple service tiers, packages, or feature sets side-by-side. Easily customizable, each block allows you to highlight key offerings, benefits, and pricing strategies. Compatible with Canva, PowerPoint, Keynote, and Google Slides.


7 slides
Investment Group Infographic
An investment group, is a collective of individuals or entities that pool their financial resources to invest in various financial instruments or assets. This infographic template is a high-octane journey through the dynamic world of investments, designed to empower and energize your financial understanding. Prepare to take you audience through a thrilling ride through the investment cosmos, where your money takes center stage and financial growth is the ultimate goal. This Investment Infographic isn't just about numbers and charts, it's a thrilling expedition through the realms of finance.


21 slides
Mystic UX Research Report Presentation
Present your UX research with precision using this sleek and engaging report template! It covers key elements like user research, wireframes, prototyping, testing, and branding guidelines, providing a comprehensive overview of the design process. Ideal for client reviews or team discussions, this template is fully compatible with PowerPoint, Keynote, and Google Slides.


5 slides
Multi-Layer Concentric Diagram Presentation
Make a splash with your ideas using this layered ripple-style layout! Perfect for visualizing cascading strategies, phased impacts, or multi-tiered processes, this multi-layer concentric diagram turns complex data into clean, memorable visuals. Fully compatible with PowerPoint, Keynote, and Google Slides, it’s ready to elevate your next presentation.


5 slides
Product Marketing Slide Presentation
Spark interest instantly with a bold, circular layout that transforms product insights into a clean, memorable story. This presentation helps you explain features, audience needs, and value propositions in an organized, visual flow that keeps attention on what matters most. Fully customizable for PowerPoint, Keynote, and Google Slides.


5 slides
Transportation Industry Market Trends Presentation
Visualize industry shifts and delivery dynamics with this road-themed presentation layout. Featuring a stylized highway path and moving vehicle graphic, this template helps you break down four key market trends in a clear, visual progression. Each stop on the route includes editable icons and text blocks for streamlined storytelling. Perfect for logistics analysts, transportation planners, and consultants. Fully customizable in PowerPoint, Keynote, and Google Slides.