


Features
- 26 Unique slides
- Fully editable and easy to edit in Microsoft Powerpoint, Keynote and Google Slides
- 16:9 widescreen layout
- Clean and professional designs
- Export to JPG, PDF or send by email


Do you have any questions?
Recommend


4 slides
Team and Department Setup Structure Presentation
Organize your team with clarity using the Team and Department Setup Structure Presentation. This template is perfect for showcasing internal team hierarchies, departmental layouts, or functional groupings in a clean and professional layout. Each slide is fully customizable, allowing you to edit icons, titles, and structure to suit your organization. Compatible with Canva, PowerPoint, Keynote, and Google Slides.


3 slides
Visual Breakdown with Tree Diagram Format Presentation
Illustrate growth stages, concepts, or layered development with the Visual Breakdown with Tree Diagram Format Presentation. This creative design uses three tree icons—seedling, sapling, and mature tree—to represent progression or hierarchy. Ideal for timelines, product evolution, or strategic planning. Fully editable in PowerPoint, Keynote, and Google Slides.


12 slides
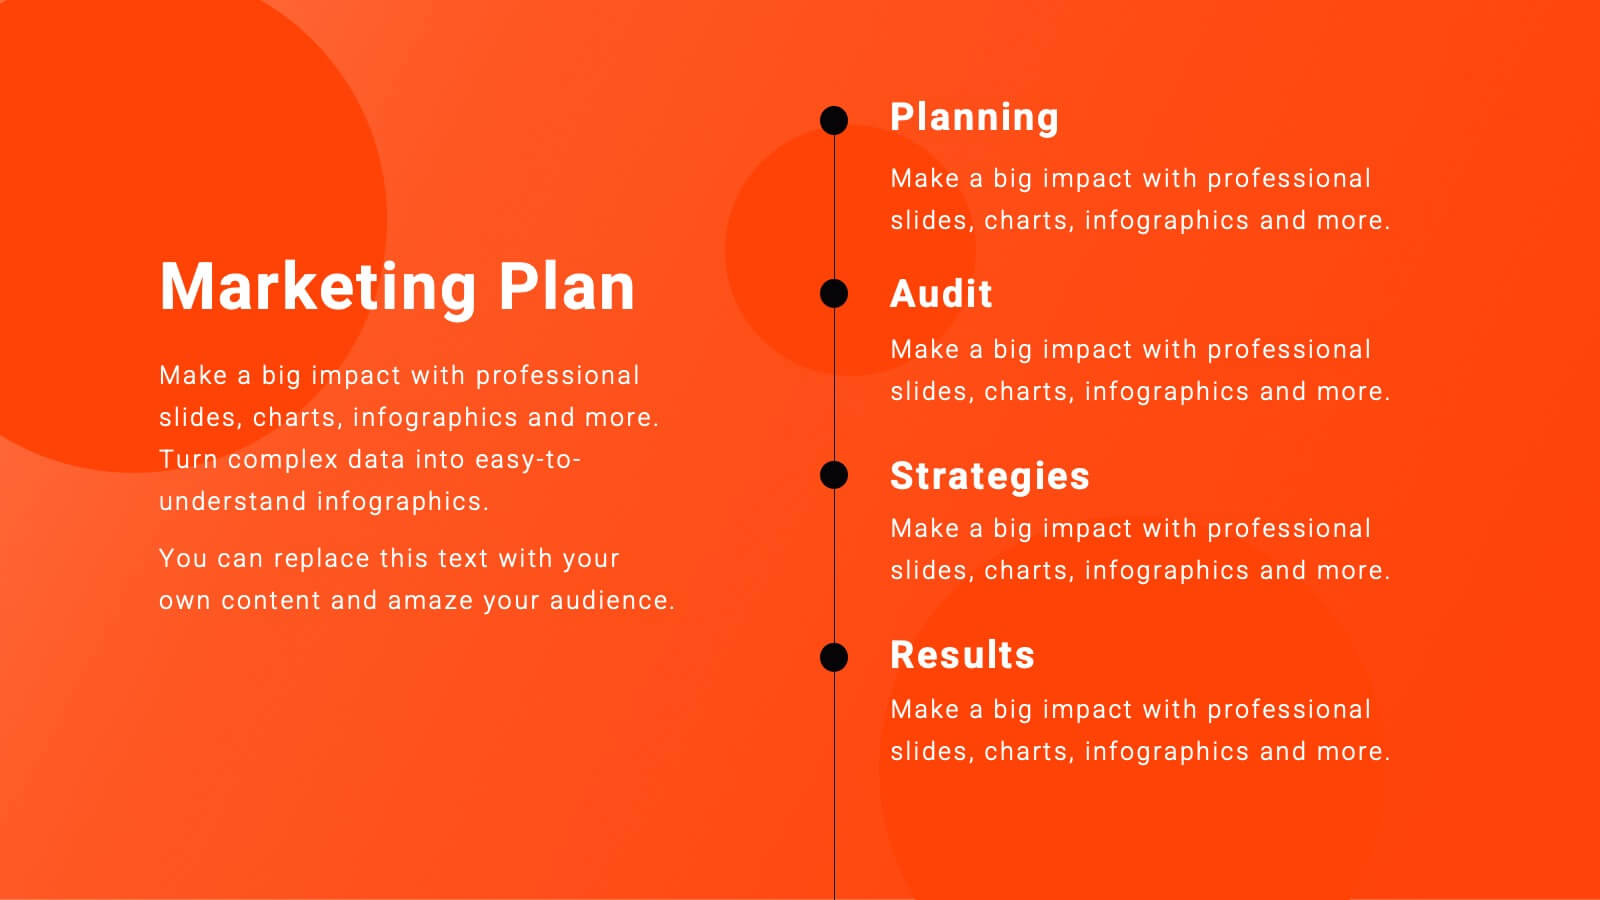
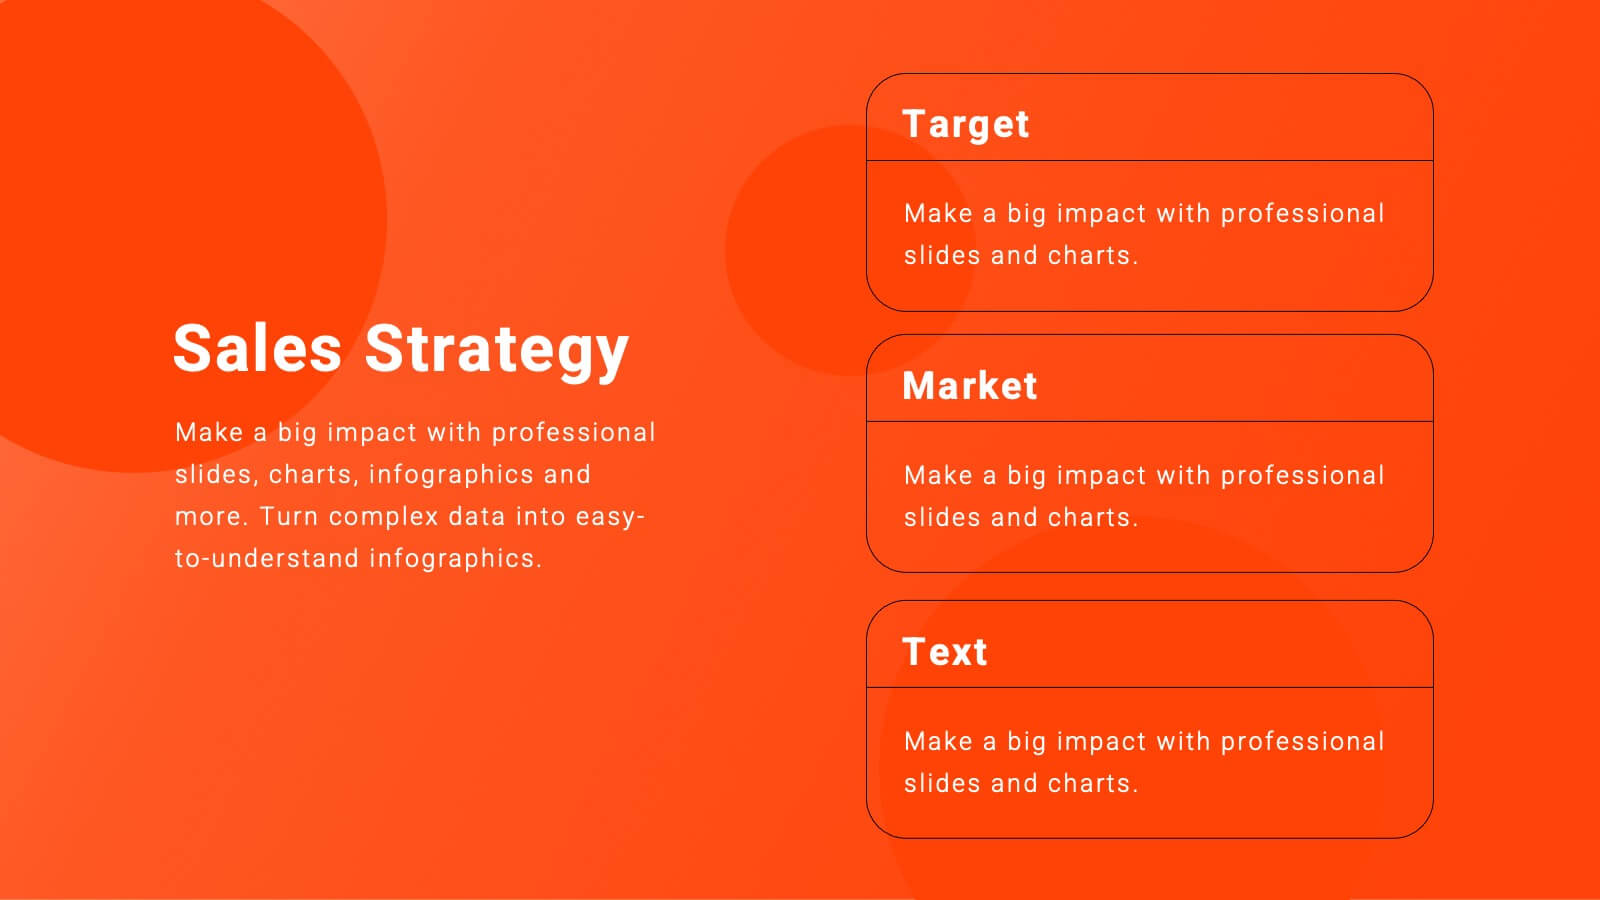
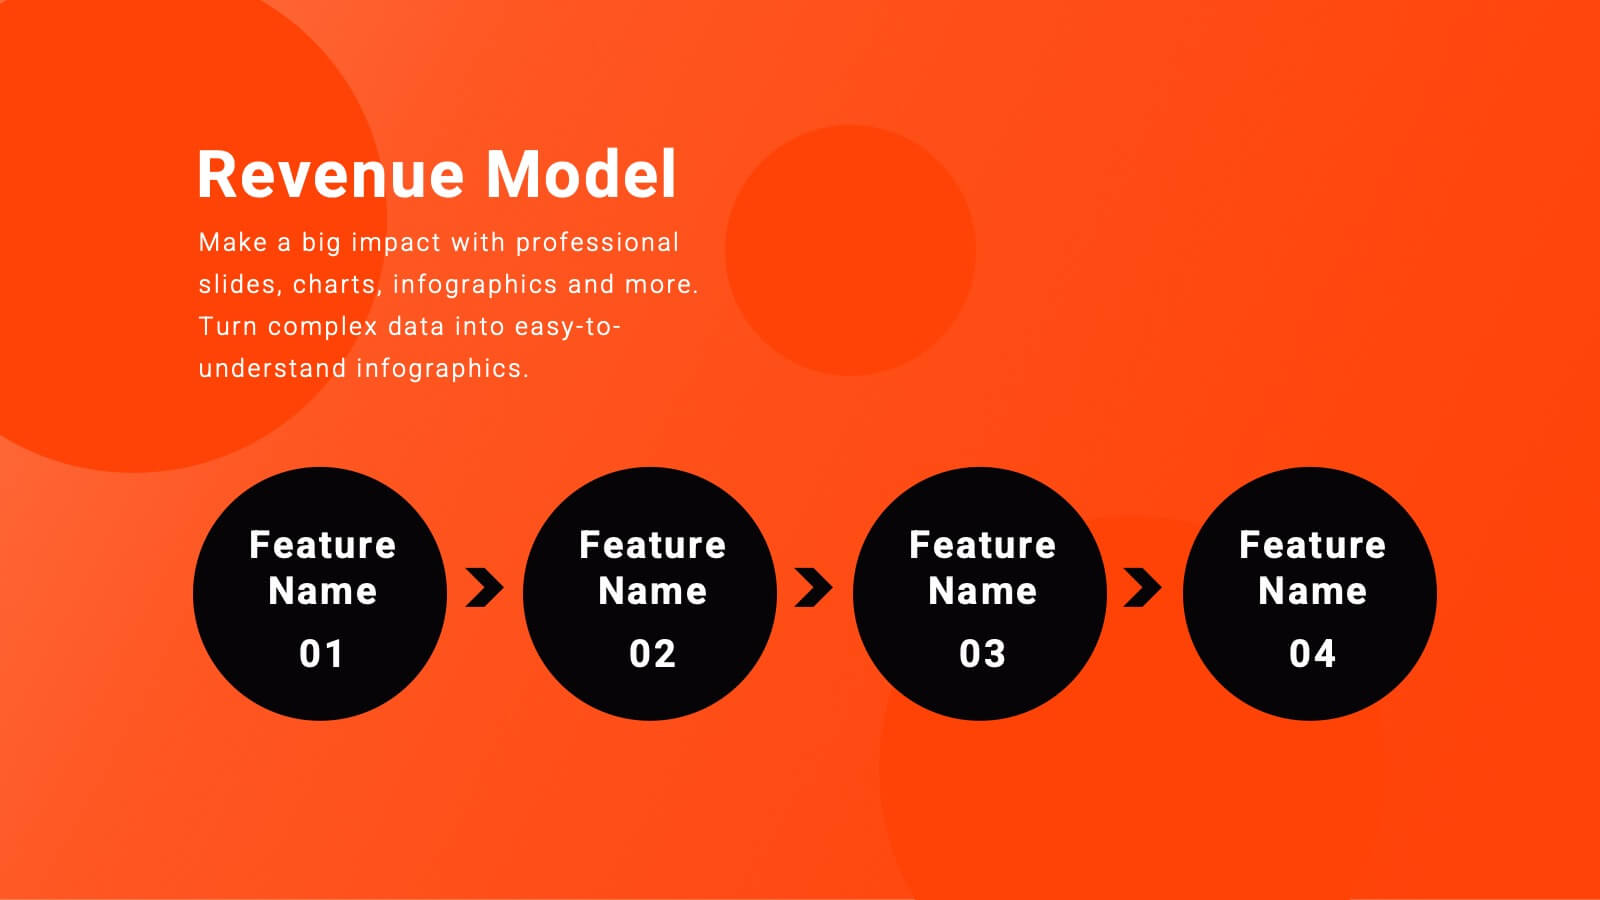
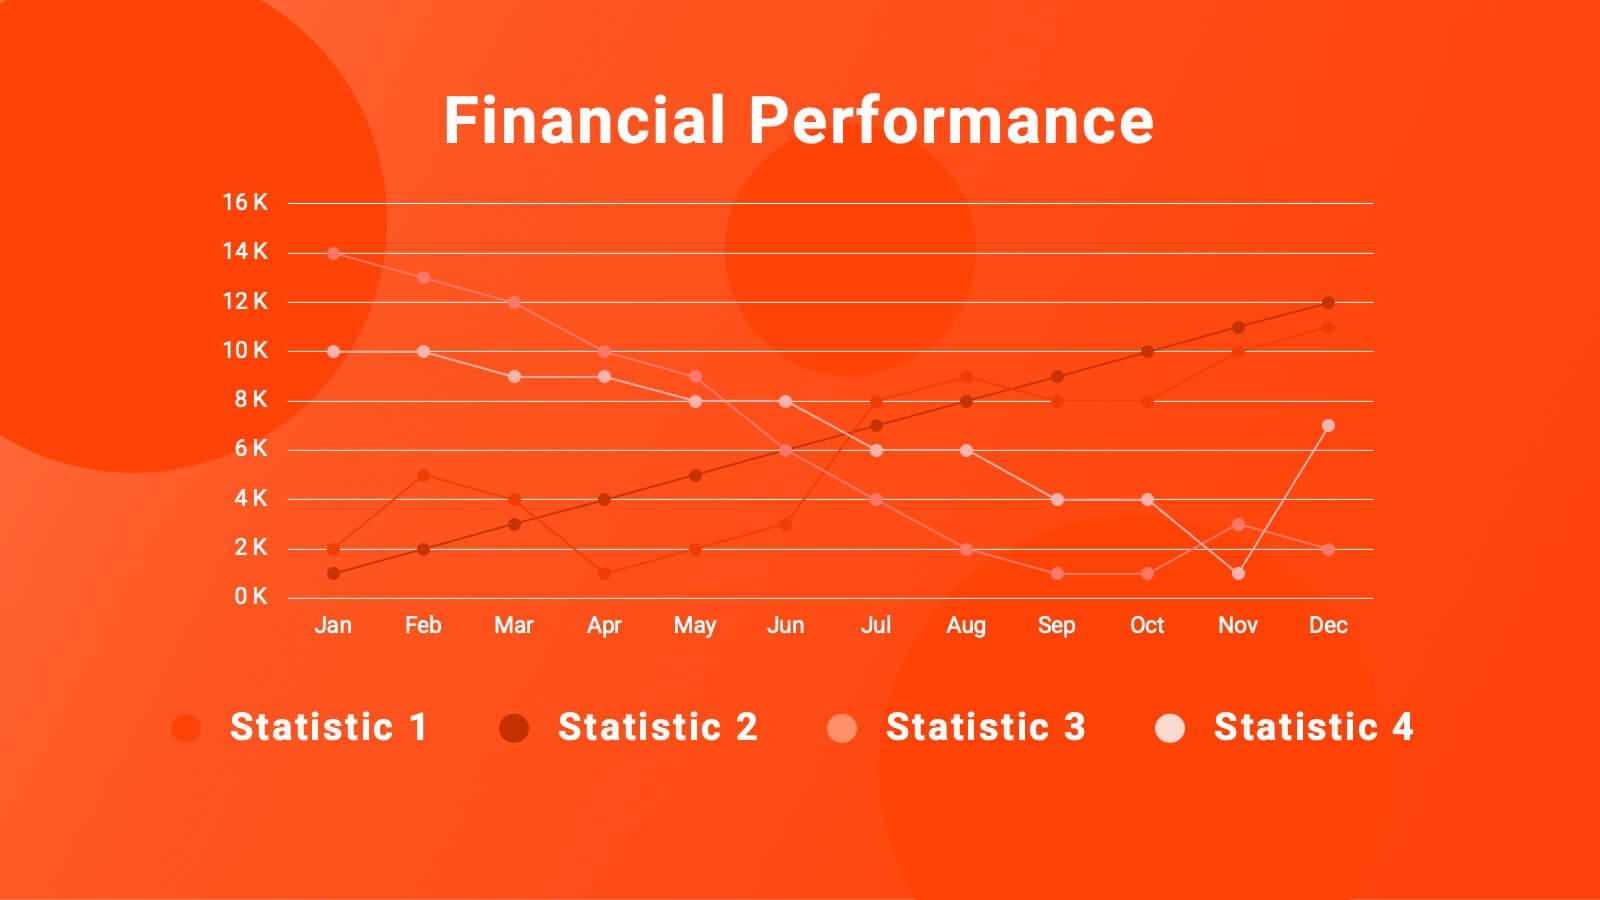
Digital Marketing Strategy Presentations
Turn complex campaigns into captivating visuals with this modern, data-driven layout designed for marketing professionals. Perfect for outlining strategies, performance metrics, and digital funnels, it keeps information clear and visually engaging. Easily customizable and fully compatible with PowerPoint, Keynote, and Google Slides for seamless editing across your favorite platforms.


26 slides
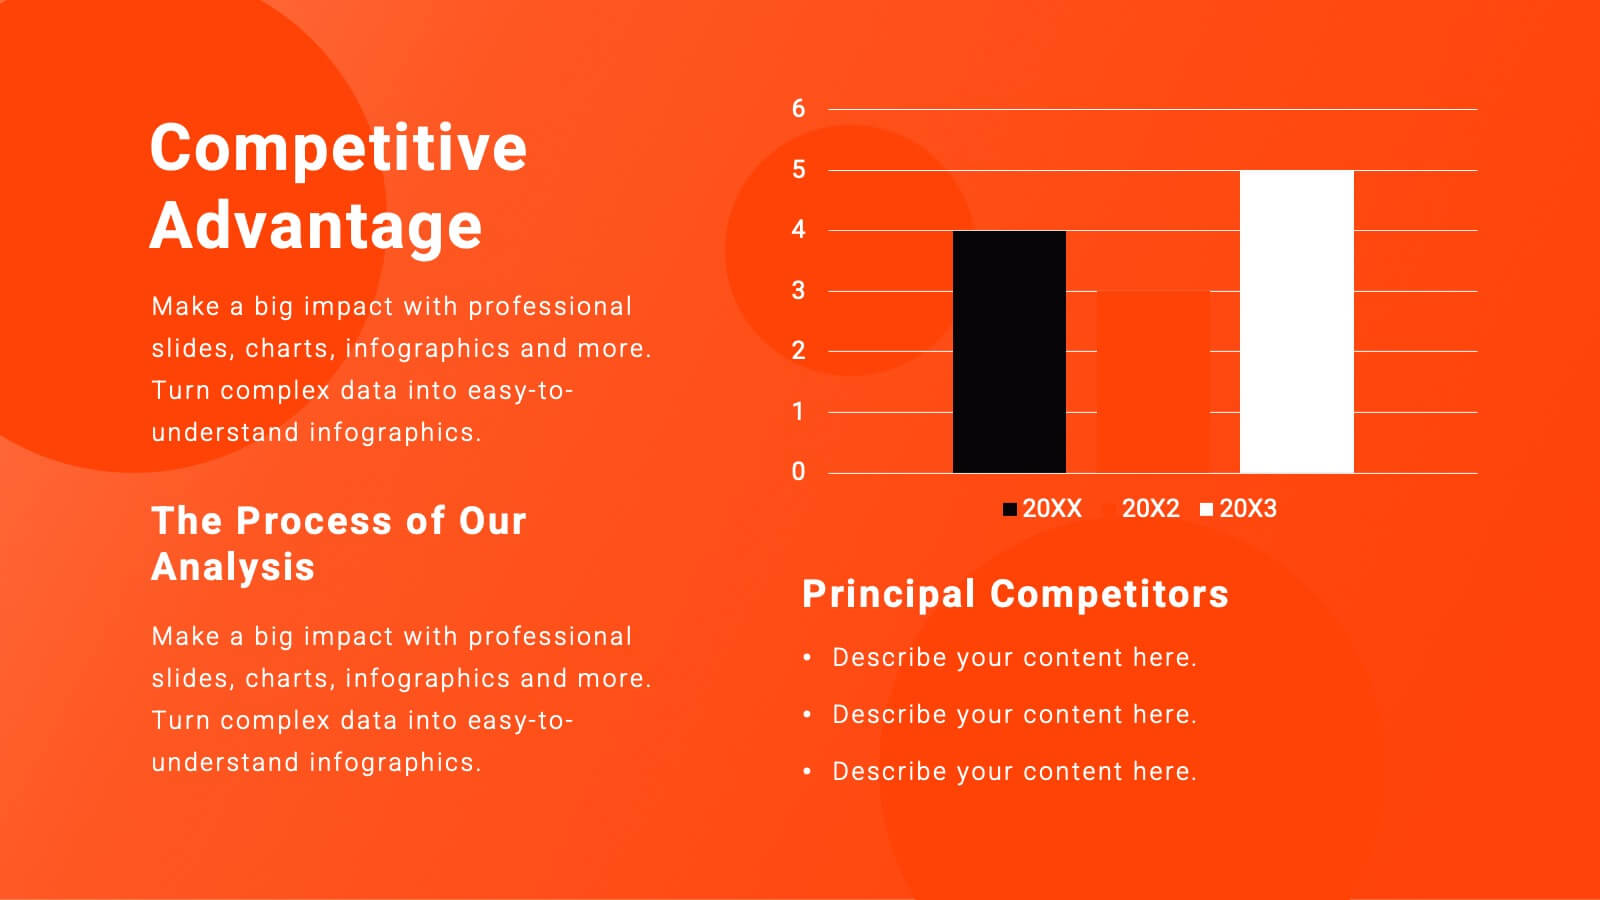
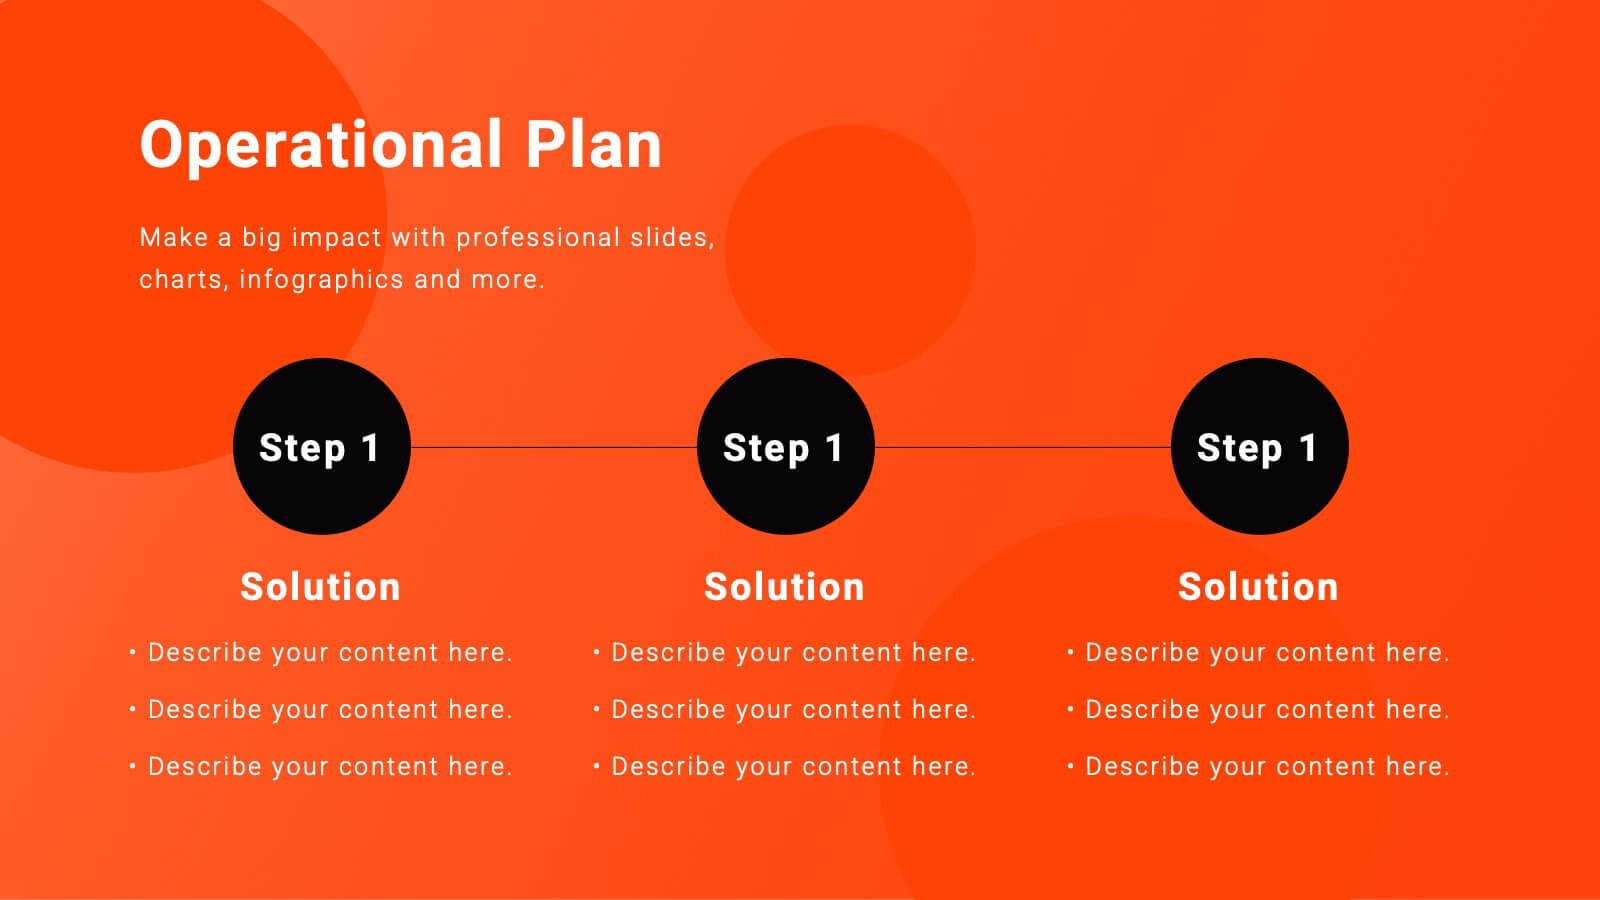
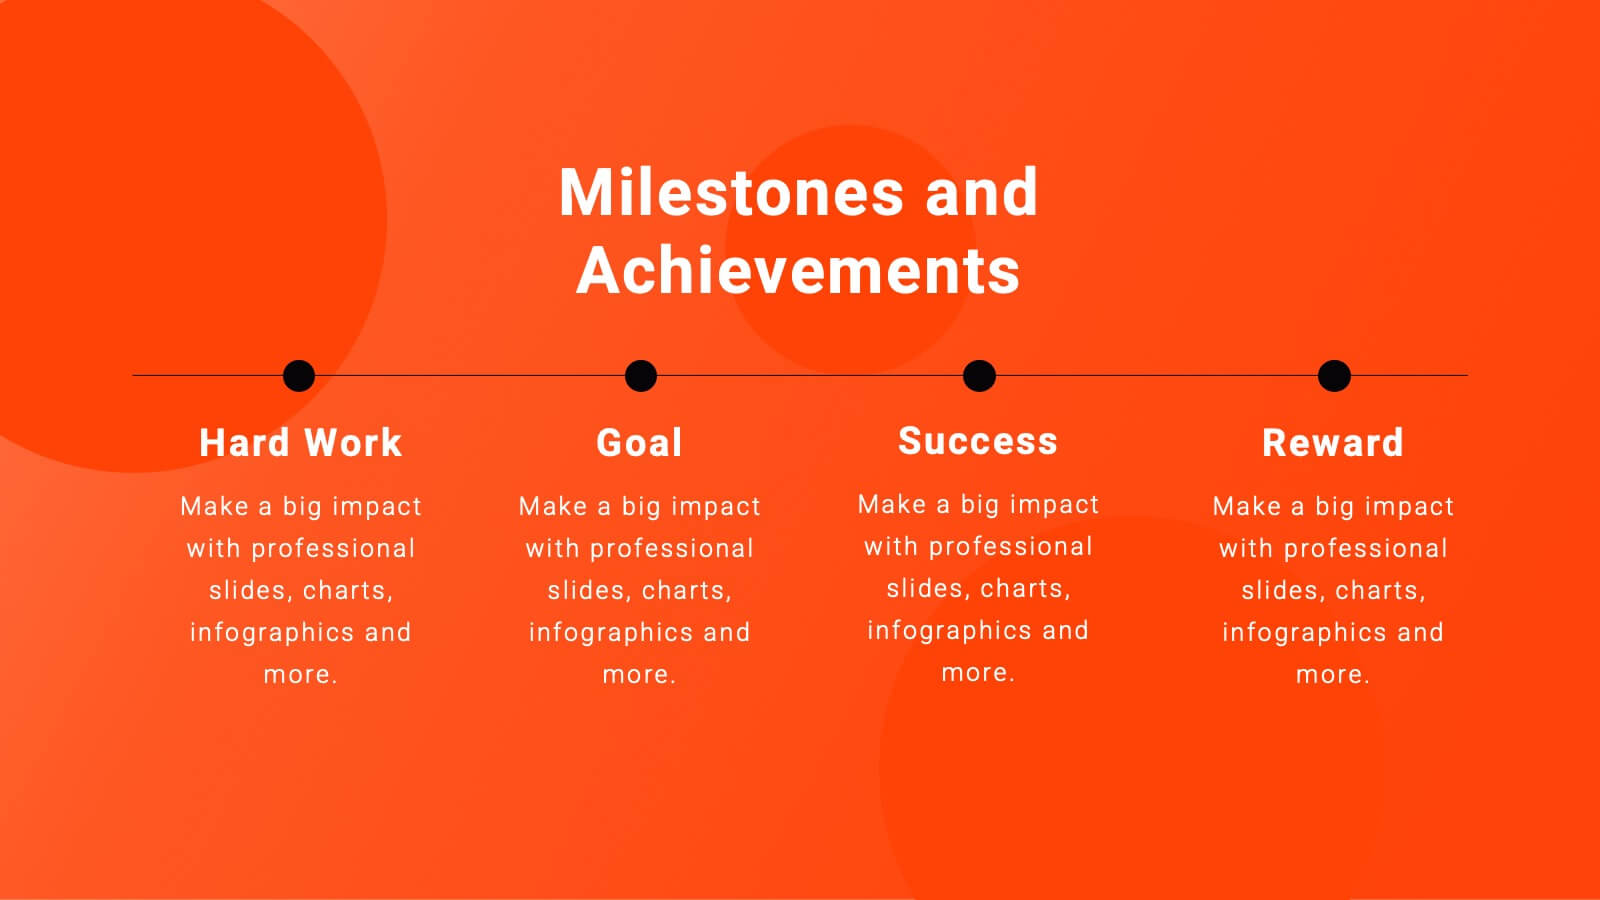
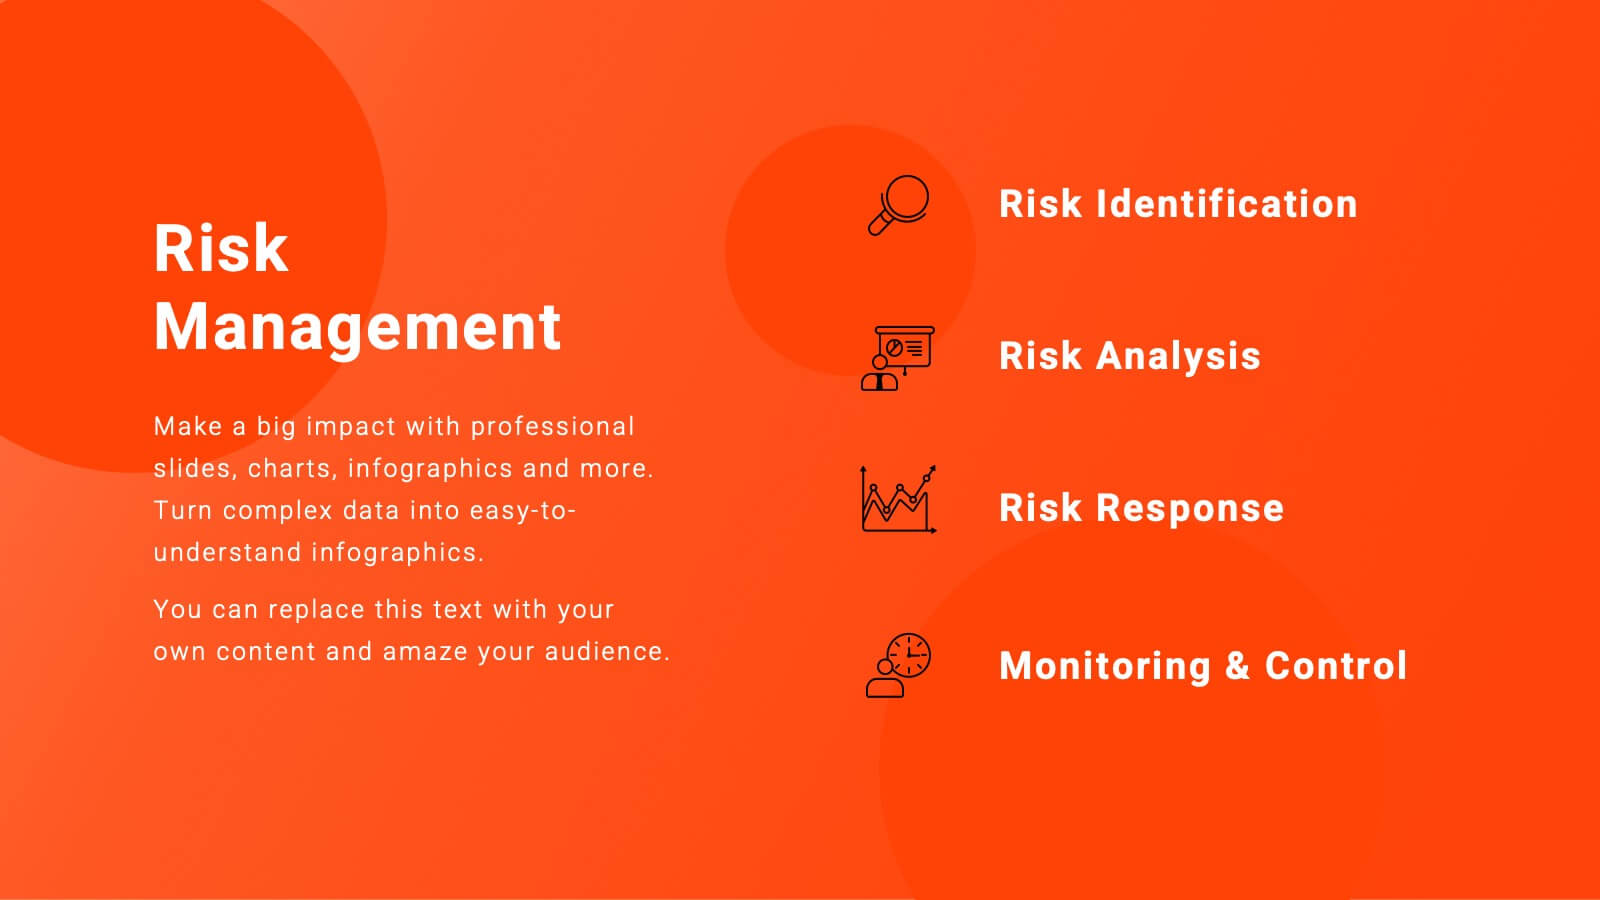
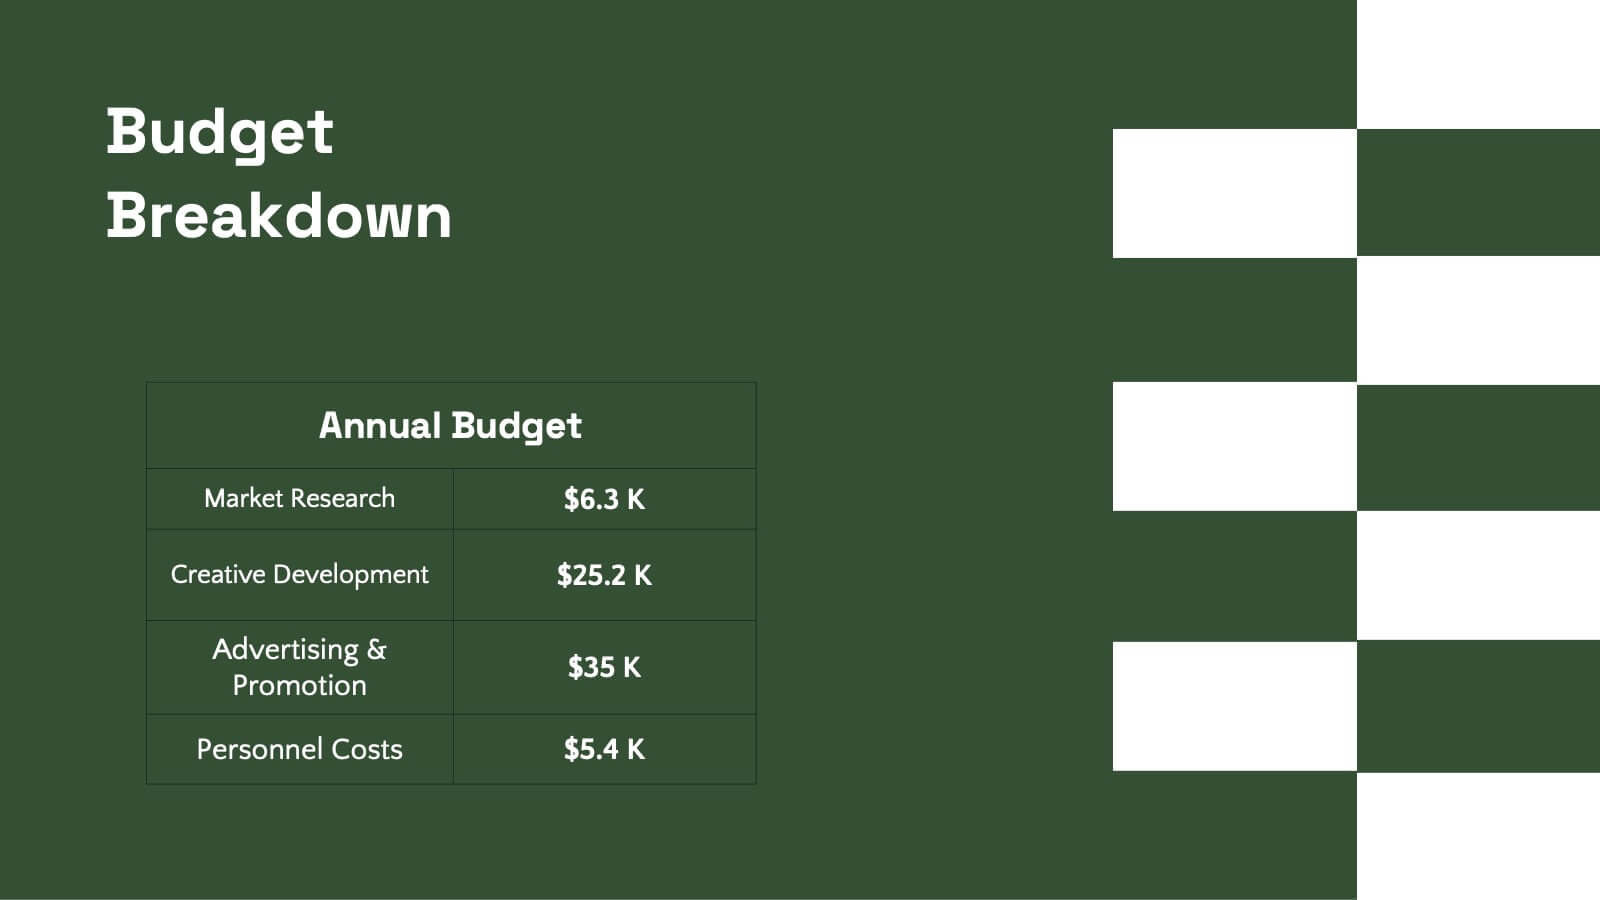
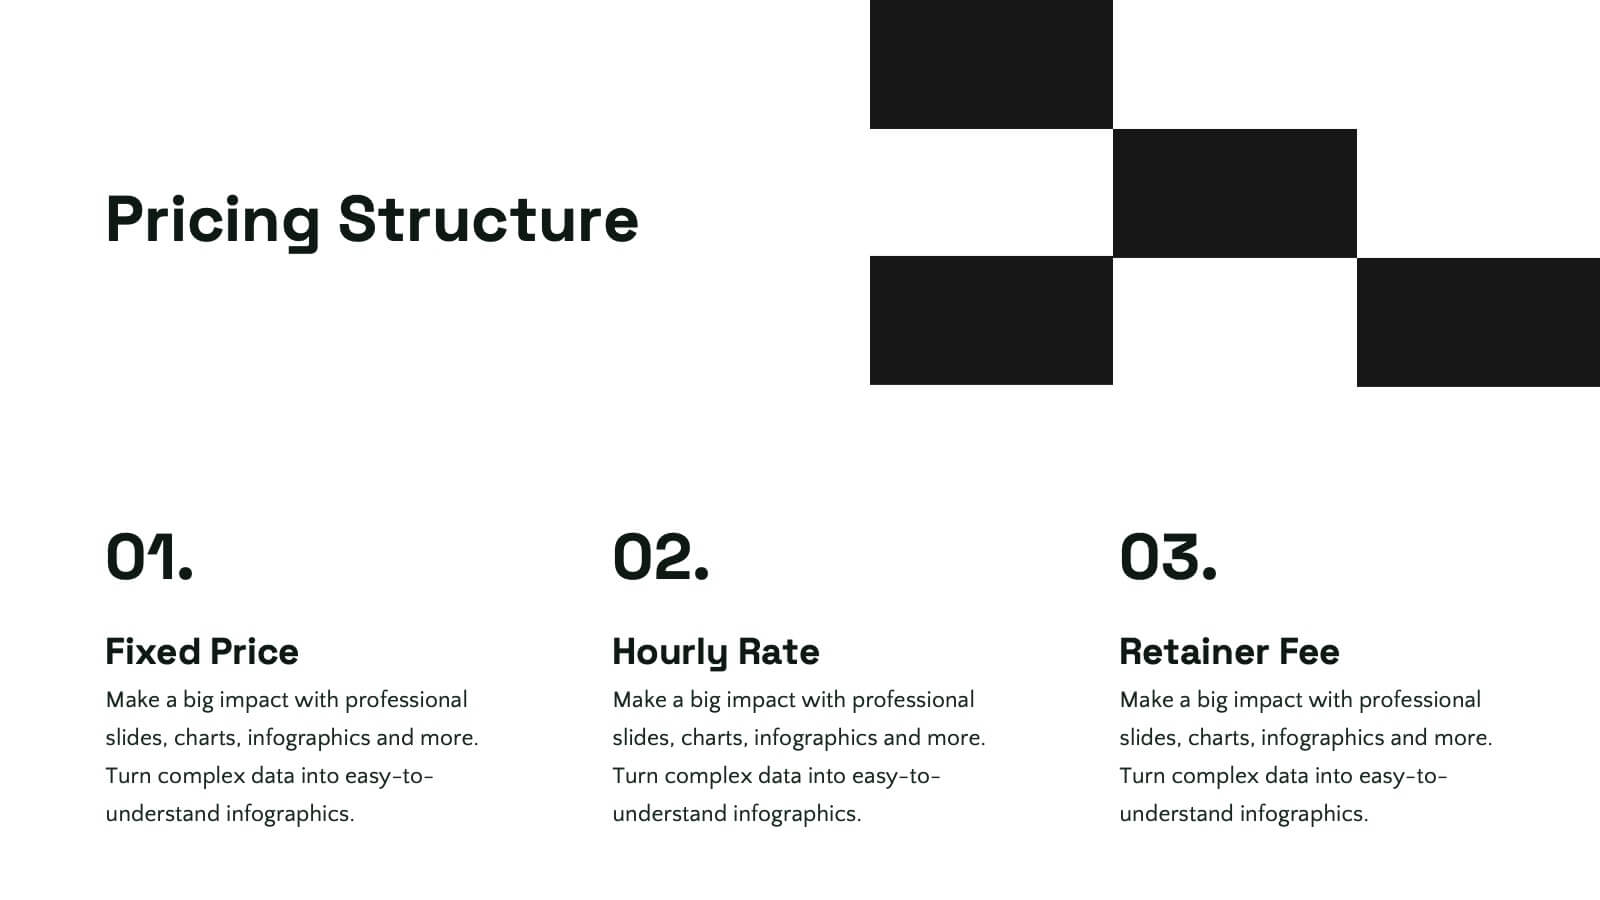
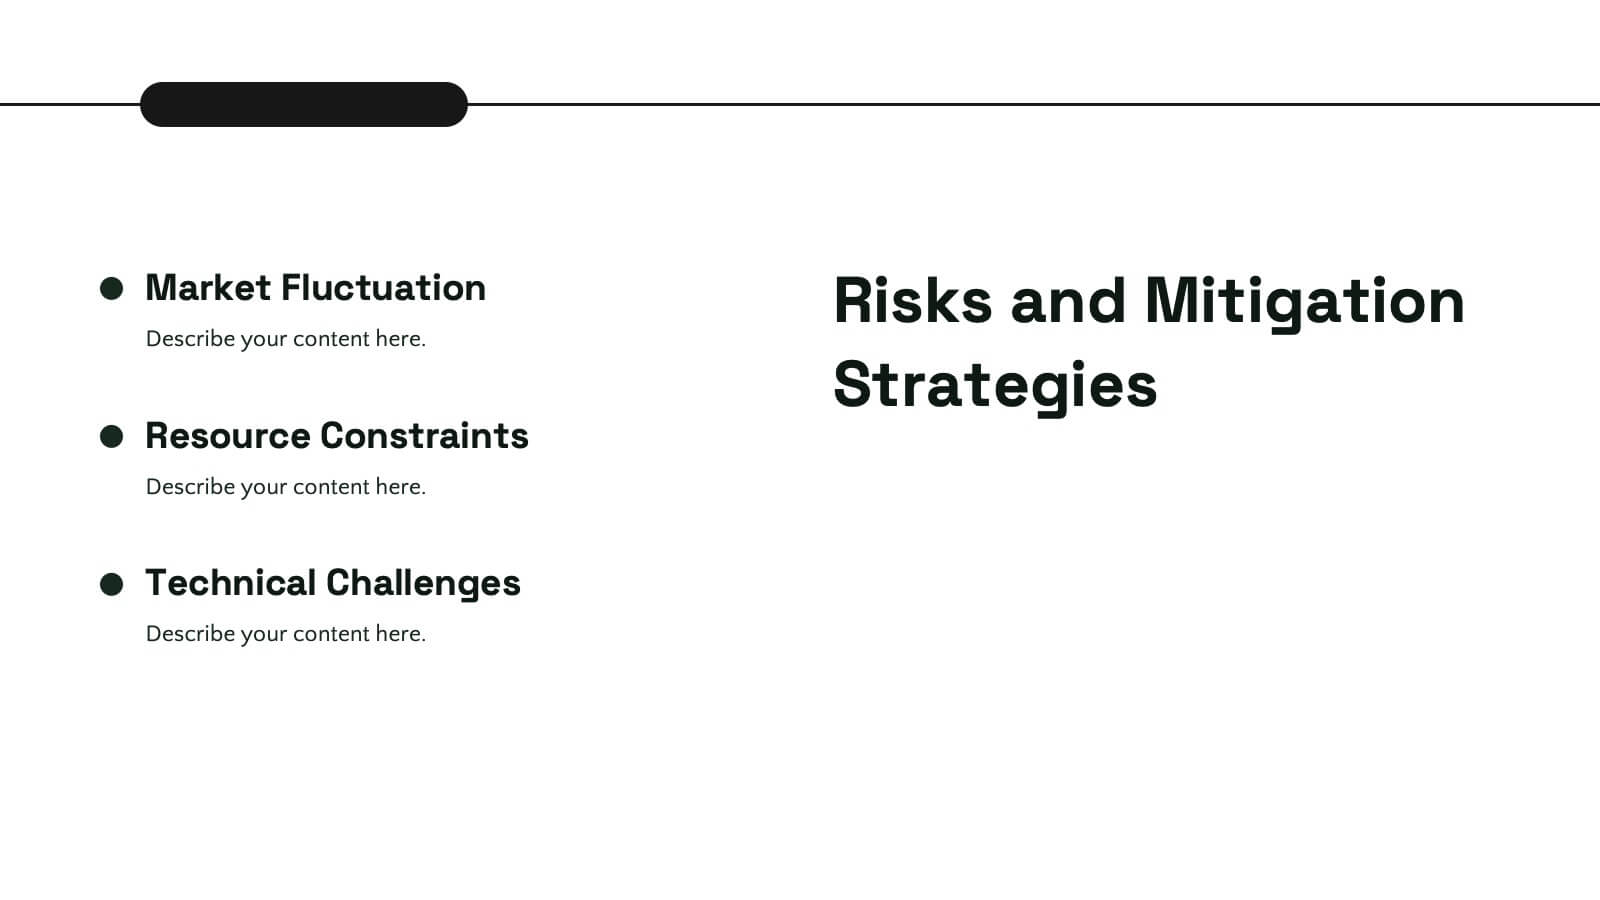
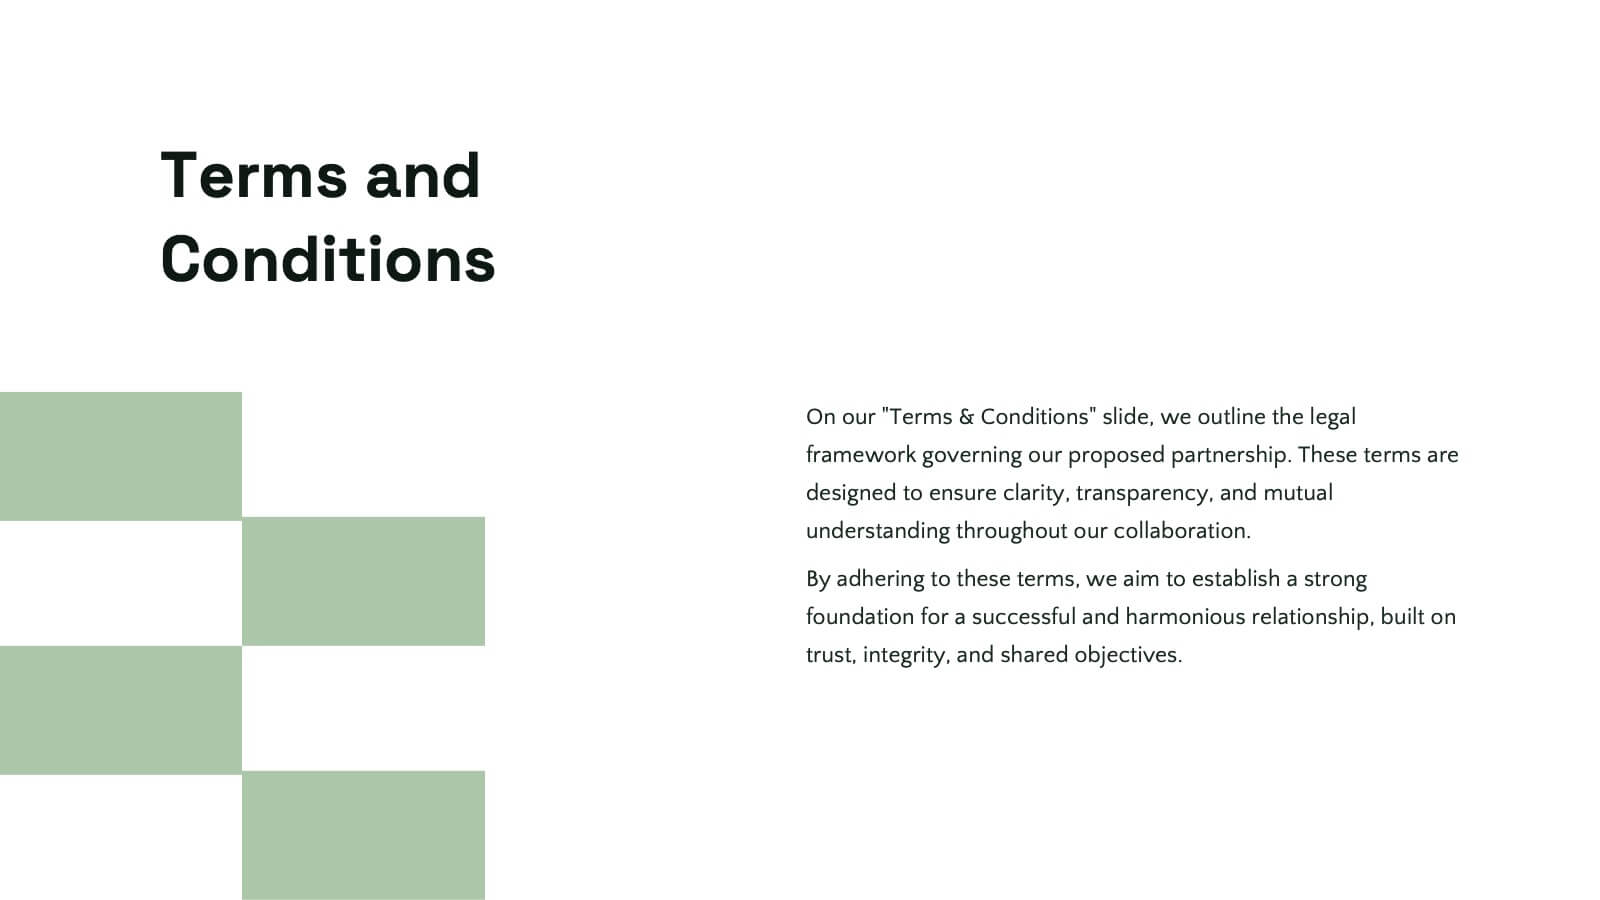
Market Growth Tactics Presentation
Chart a path to success with our Market Growth Tactics presentation template, designed for seamless use in PowerPoint, Keynote, and Google Slides. This template is a vital asset for business strategists, marketing professionals, and consultants who aim to drive growth and capture market share. Our Market Growth Tactics template lays out a strategic framework for identifying and leveraging growth opportunities. It provides a comprehensive array of slides to showcase market analysis, competitive landscape, growth strategies, and execution plans. With customizable elements, you can tailor your presentation to reflect specific market insights and growth targets relevant to your audience. The template is crafted to facilitate clear communication of complex growth strategies, breaking them down into actionable steps with the aid of charts, graphs, and infographics. This helps to convey your message effectively, ensuring that your audience can visualize the growth journey and understand the tactics involved. Elevate your market growth presentations and become an authoritative voice in your industry with our SEO-optimized template, designed to engage, inform, and inspire action towards market expansion.


23 slides
Equinox Business Operations Plan Presentation
Elevate your business operations with this dynamic plan template! Perfect for detailing company background, market opportunities, and strategic objectives. Ideal for business leaders and managers aiming to streamline operations and drive growth. Compatible with PowerPoint, Keynote, and Google Slides, this template ensures your business plan is clear, professional, and impactful. Drive success today!


6 slides
User-Centered Design Thinking Model Presentation
Highlight the key phases of your design process with the User-Centered Design Thinking Model Presentation. This slide features a profile silhouette with a segmented circular path inside the head, clearly representing five sequential stages. Perfect for illustrating empathy-driven innovation, product development, or user experience workflows. Fully editable in Canva, PowerPoint, Google Slides, and Keynote.


7 slides
Balance Sheet and Profit Overview Presentation
Give your financial summary a clean, modern look with the Balance Sheet and Profit Overview Presentation. This slide offers a dual-column layout with icons and space for six key financial metrics or business insights—ideal for summarizing assets, liabilities, profits, and more. Easily editable in Canva, PowerPoint, and Google Slides.


3 slides
Agile Workflow and Team Roles Presentation
Visualize team roles, responsibilities, and task flow using this agile loop diagram. Ideal for Scrum teams, project managers, and product owners. Clearly outline percentages, priorities, and stages in the process. Fully editable in PowerPoint, Keynote, and Google Slides—perfect for training, team updates, or workflow overviews.


19 slides
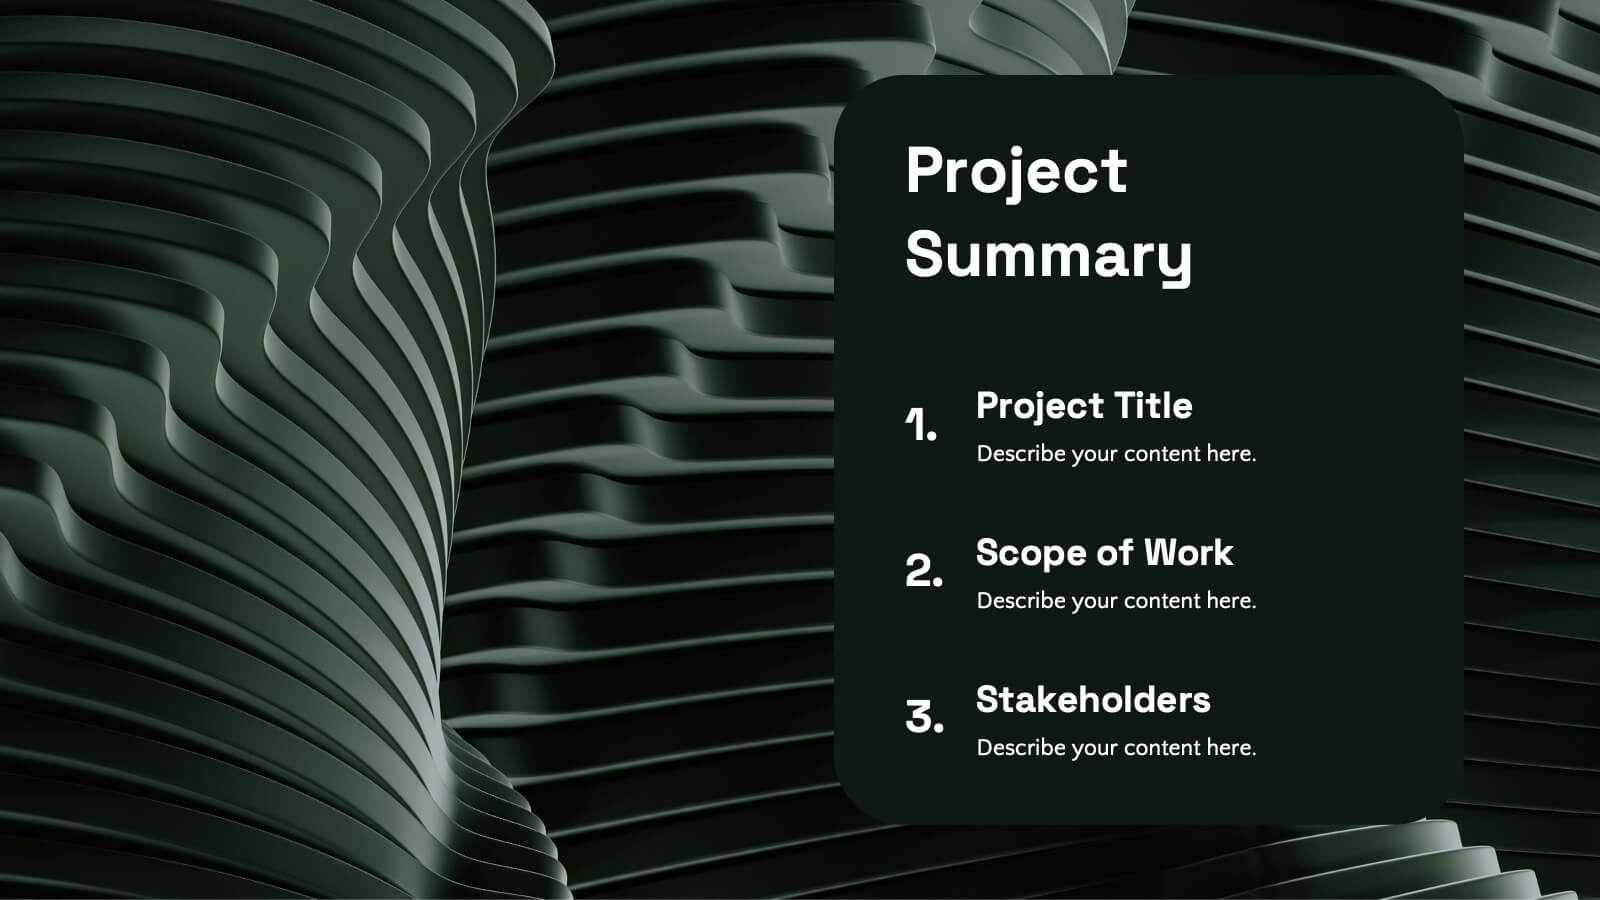
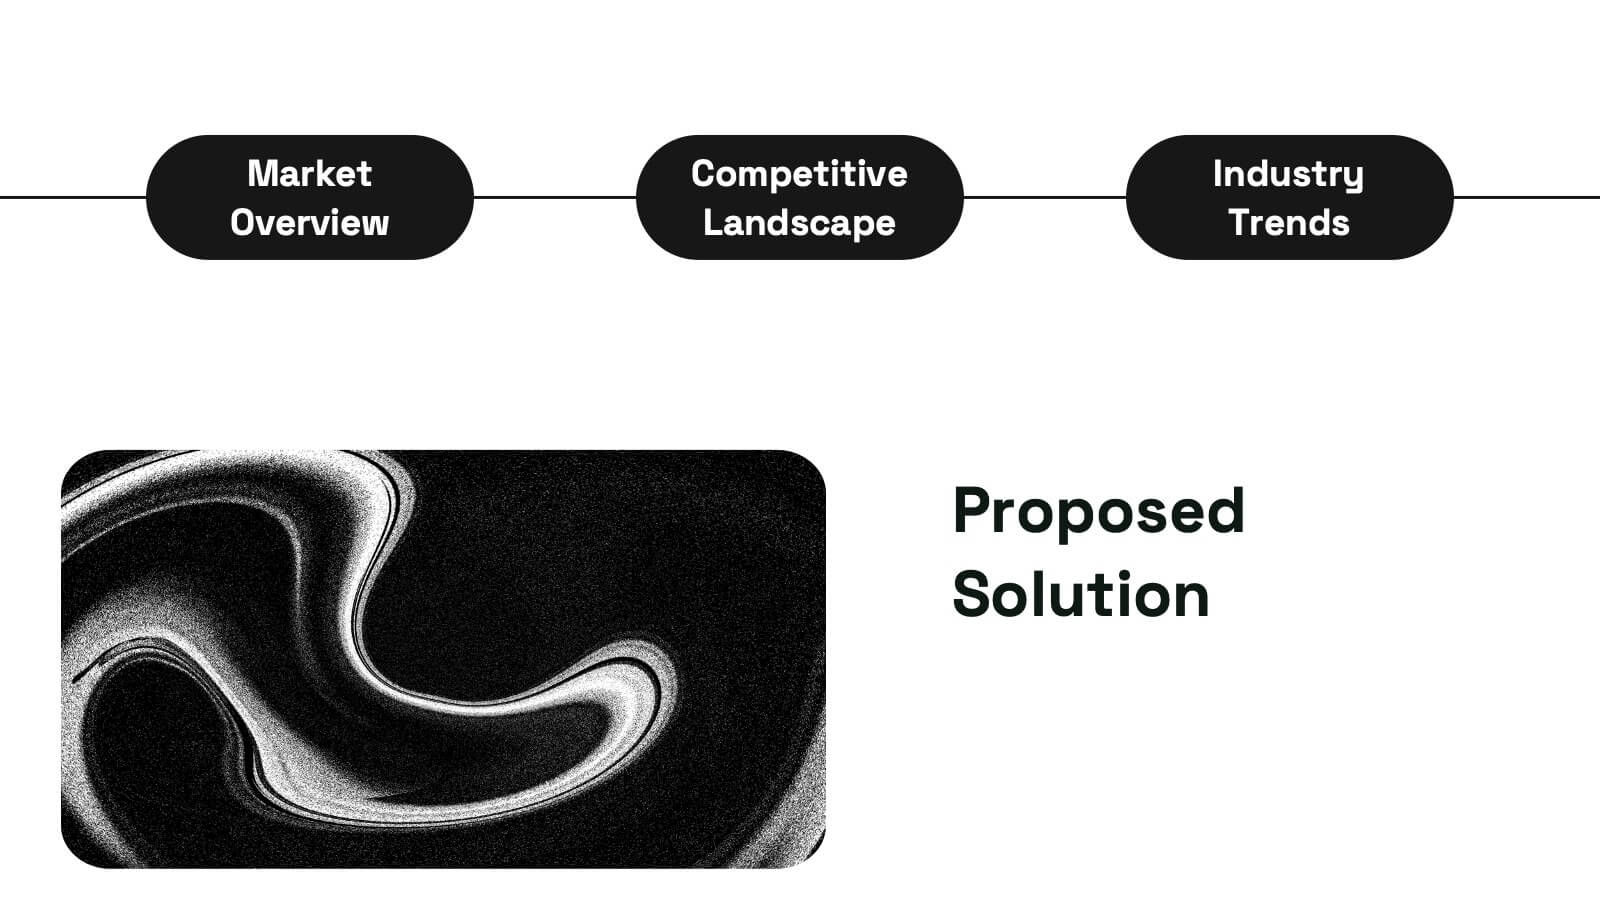
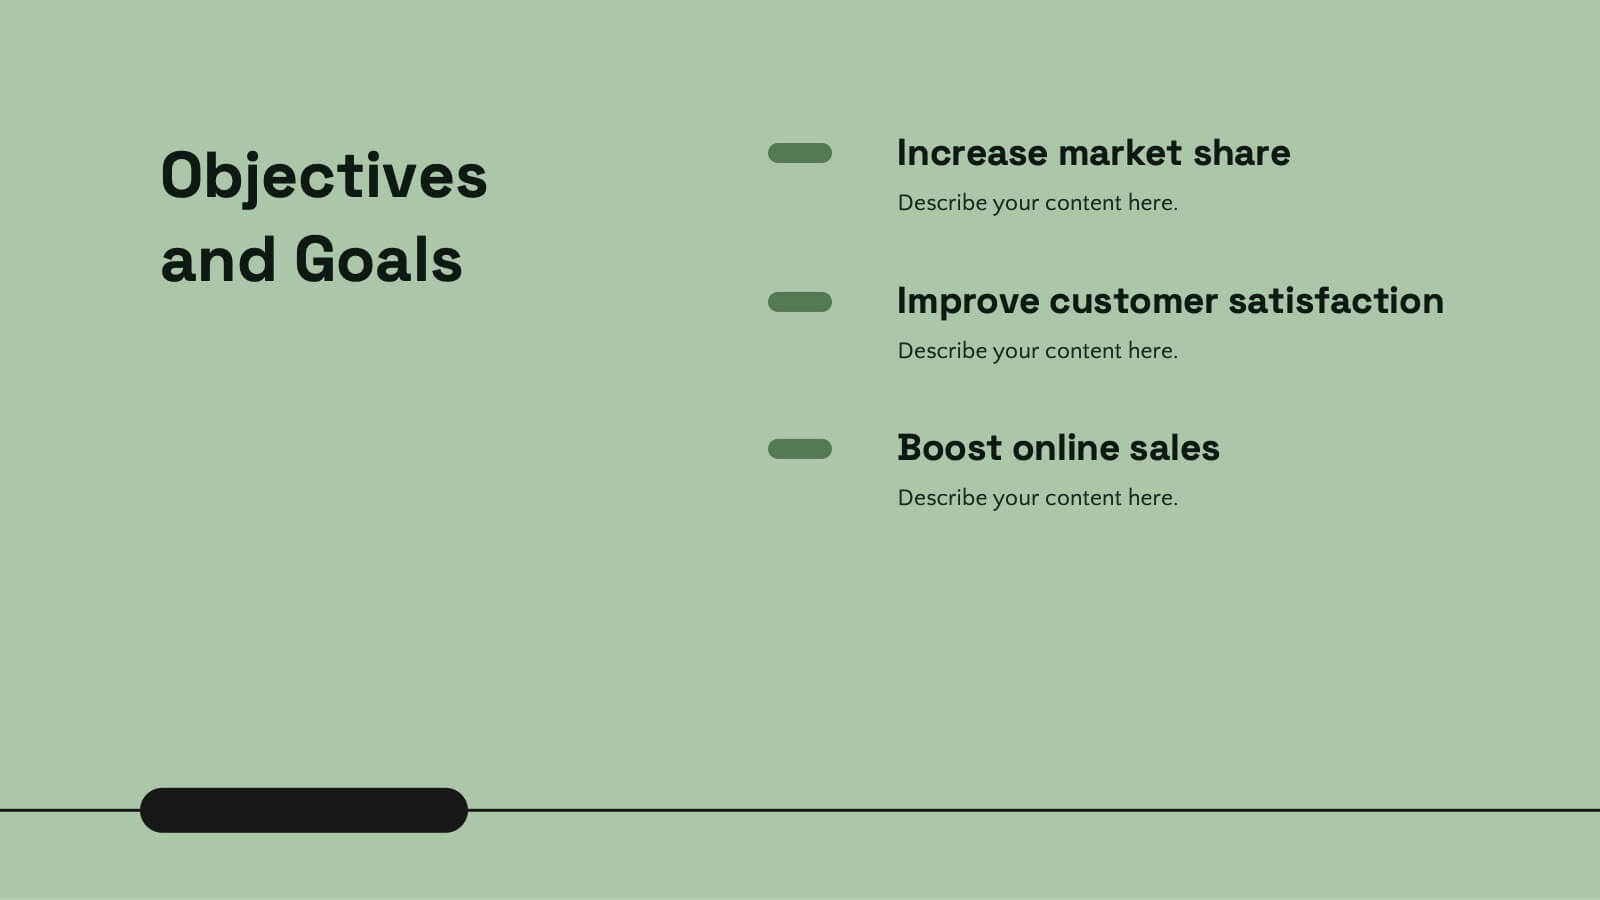
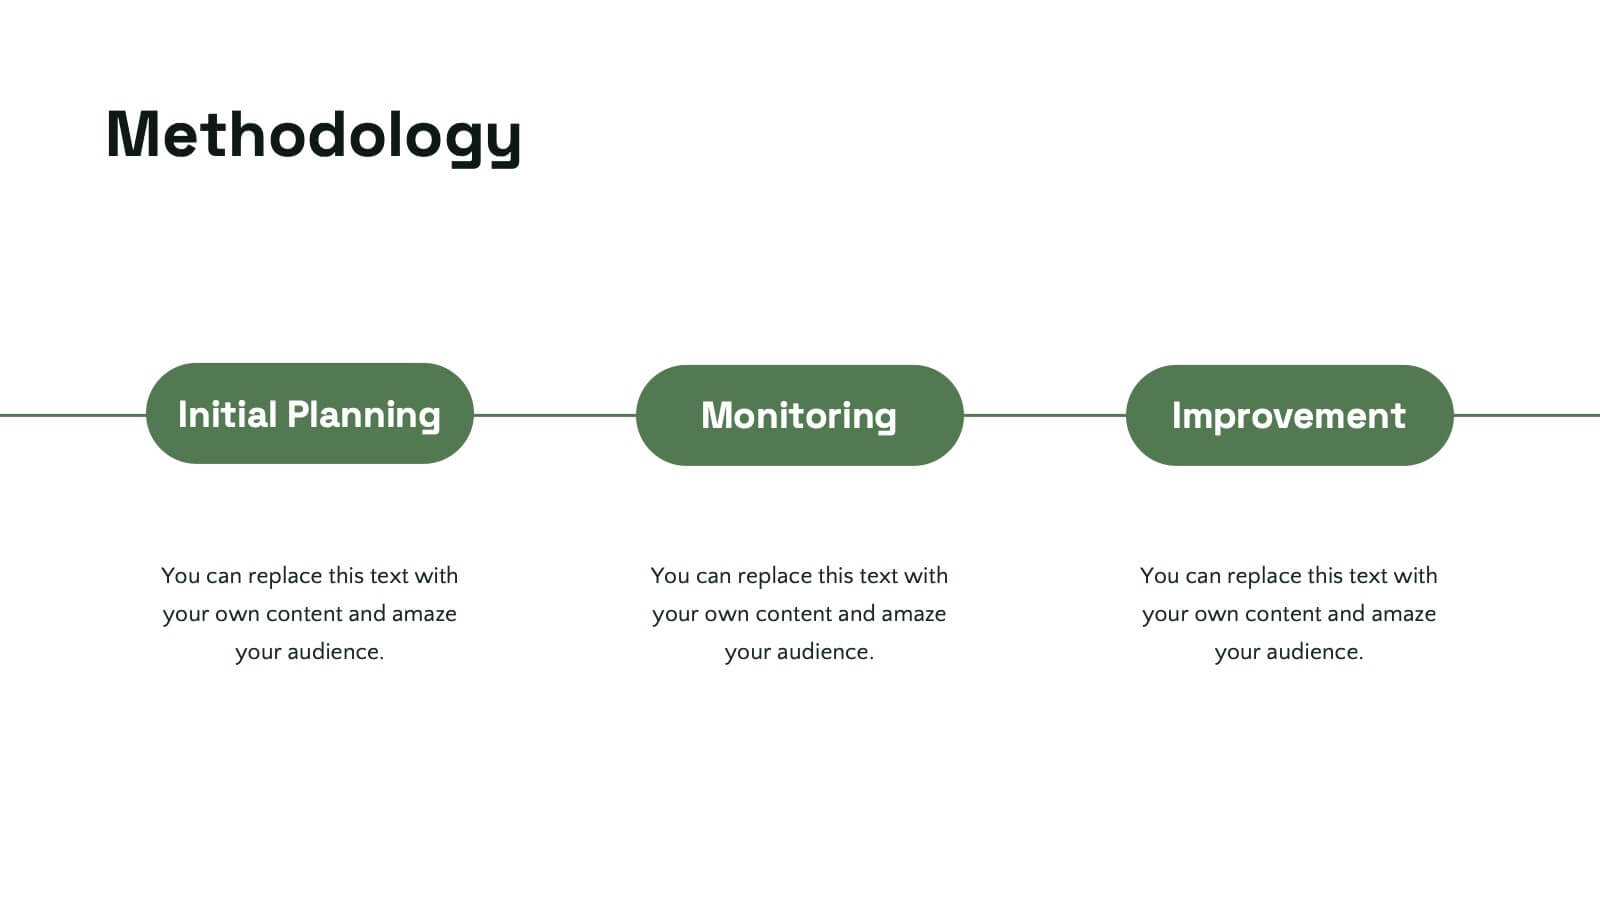
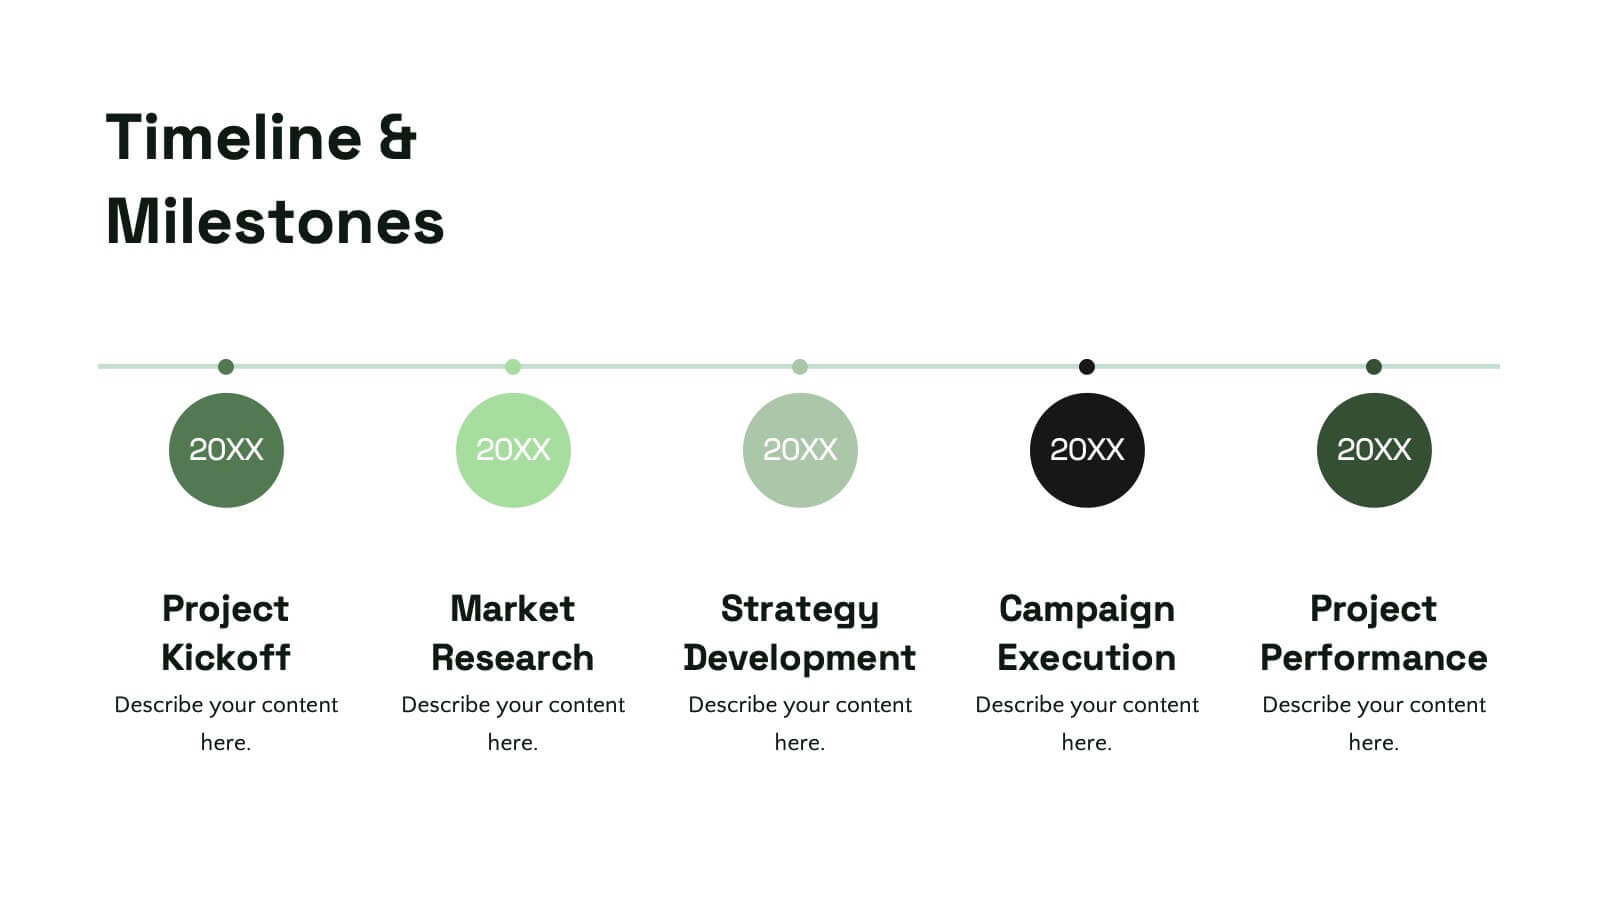
Tidal Design Proposal Presentation
Elevate your pitch with this sleek design proposal template! Perfect for presenting project details, objectives, methodology, and milestones, it ensures your ideas stand out. Impress stakeholders with clear, structured slides and professional aesthetics. Compatible with PowerPoint, Keynote, and Google Slides for a seamless presentation experience across all platforms.


4 slides
Creative Thinking and Brain Functions Presentation
Illuminate cognitive processes with the Creative Thinking and Brain Functions Presentation. Featuring a clean mind map-style layout with illustrated heads and title blocks, this slide is ideal for showcasing mental models, decision paths, or concept relationships. Fully editable in PowerPoint, Canva, and Google Slides for effortless customization.


6 slides
Six Sigma DMAIC Method Presentation
Bring clarity and momentum to your improvement plan with this dynamic presentation, designed to visually guide teams through each stage of a structured problem-solving process. It helps you present goals, insights, and actions with confidence while keeping the workflow clear and engaging. Fully compatible with PowerPoint, Keynote, and Google Slides.


6 slides
Business Strategy Wheel Presentation
Bring your ideas full circle with this dynamic and colorful presentation design. Perfect for illustrating key strategies, continuous improvement cycles, or interconnected business concepts, it transforms complex processes into simple, engaging visuals. Fully customizable and compatible with PowerPoint, Keynote, and Google Slides for effortless editing and professional presentation.


5 slides
RAPID Framework for Business Strategy
Clarify decision-making roles with confidence using this vibrant business strategy framework. This template visualizes the RAPID model—Recommend, Agree, Perform, Input, Decide—in a clear flow that simplifies collaboration and speeds up strategy execution. Ideal for leadership teams and cross-functional planning. Works seamlessly in PowerPoint, Keynote, and Google Slides.


5 slides
Optimized Process Flow Diagram Presentation
Streamline workflows with the Optimized Process Flow Diagram. This professional template visualizes key business processes for efficient decision-making and execution. Designed for project managers, analysts, and strategists, it ensures a clear, structured overview of sequential steps. Fully editable and compatible with PowerPoint, Keynote, and Google Slides.


3 slides
Ishikawa Diagram Template Presentation
Bring clarity to complex challenges with a clean, structured visual that helps teams trace issues back to their true causes. This presentation outlines key factors, organizes insights, and supports decision-making with an intuitive, step-by-step layout. Ideal for problem-solving sessions and strategy workshops. Fully compatible with PowerPoint, Keynote, and Google Slides.


5 slides
Home Investment and Property Value Presentation
Visualize key real estate insights with this skyline-themed slide, ideal for showcasing home investment data and market value trends. Designed for realtors, analysts, or housing consultants, it features a cityscape layout for clear comparison. Fully editable in PowerPoint, Keynote, and Google Slides for effortless customization and polished presentations.


5 slides
Innovation in Digital Technologies Presentation
Highlight key advancements with this Innovation in Digital Technologies Presentation. Designed with four modern icon segments, this slide helps communicate your digital transformation journey clearly. Ideal for showcasing emerging tools, platforms, or strategies. Fully editable in Canva, PowerPoint, or Google Slides for seamless integration into any tech-focused presentation.