Premium Credit Card Infographic
PowerPoint Template and Google Slides Theme


Features
- 7 Unique slides
- Fully editable and easy to edit in Microsoft Powerpoint, Keynote and Google Slides
- 16:9 widescreen layout
- Clean and professional designs
- Export to JPG, PDF or send by email
- Remove from favorites
Powerpoint Template
1 MB
Google Slides Template
External link
Keynote Template
2 MB
Recommend
- Remove from favorites
Powerpoint Template
1 MB
Google Slides Template
External link
Keynote Template
1 MB
7 slides
Circle Target Infographic
The Circle Infographic is designed to increase the visual appeal and engagement of your content. This circle Infographics template is an awesome way to show off your data. This is a fun, colorful and energetic template that can be used for many different purposes such as business, marketing, sales and much more. This is perfect for any company that wants to show their scope, growth, and reach in a clear and concise way. The template is easy to use and customizable, so you can create your own unique infographic that shows off your brand's strengths. Easily change the colors and style to match your brand.
- Remove from favorites
Powerpoint Template
External link
Google Slides Template
External link
Keynote Template
External link
7 slides
World Map Population Infographic Presentation
A World Map is a representation of the Earth's surface, showing the outlines and its continents, countries, oceans, and other features. This template is designed to show the distribution of the world's population in a visually stunning way. Quickly and easily customize with your own data and you'll have an infographic that will engage your audience and convey your message. It comes in three different colors, so you can divide it how you need and change the color of certain sections. This template also includes several labels with colors, and charts showing distribution across countries.
- Remove from favorites
Powerpoint Template
1 MB
Google Slides Template
External link
Keynote Template
1 MB
5 slides
Hydrological Cycle Explained Presentation
Break down complex water systems with ease using the Hydrological Cycle Explained Presentation. This clean and modern slide illustrates each phase of the cycle—from precipitation to collection—with intuitive icons and a pipeline layout. Ideal for educational, environmental, or sustainability content. Fully editable in Canva, PowerPoint, Keynote, and Google Slides.
- Remove from favorites
Powerpoint Template
1 MB
Google Slides Template
External link
Keynote Template
1 MB
4 slides
Objectives and Results Strategy Tracking Presentation
Track progress with clarity using the Objectives and Results Strategy Tracking Presentation. This sleek, minimalist layout helps visualize how each objective connects to measurable outcomes along a strategic path. Ideal for OKR reviews, quarterly goal updates, and performance check-ins. Fully customizable in PowerPoint, Canva, Keynote, and Google Slides.
- Remove from favorites
Powerpoint Template
1 MB
Google Slides Template
External link
Keynote Template
1 MB
7 slides
Executive Summary Infographic Presentation Template
An Executive Summary is a document that provides an overview of the main points of a larger report. It is often written to share with individuals who may not have time to review the entire report. The executive summary provides a summary that sets out what's in the report, who it is written for, what it covers and why it's important. Use this template to create a powerful summary, which makes it easier to communicate your engagement results and outline your most important points. This template was designed to suggest a number of ways to enhance your executive summary and make it more persuasive.
- Remove from favorites
Powerpoint Template
1 MB
Google Slides Template
External link
Keynote Template
1 MB
5 slides
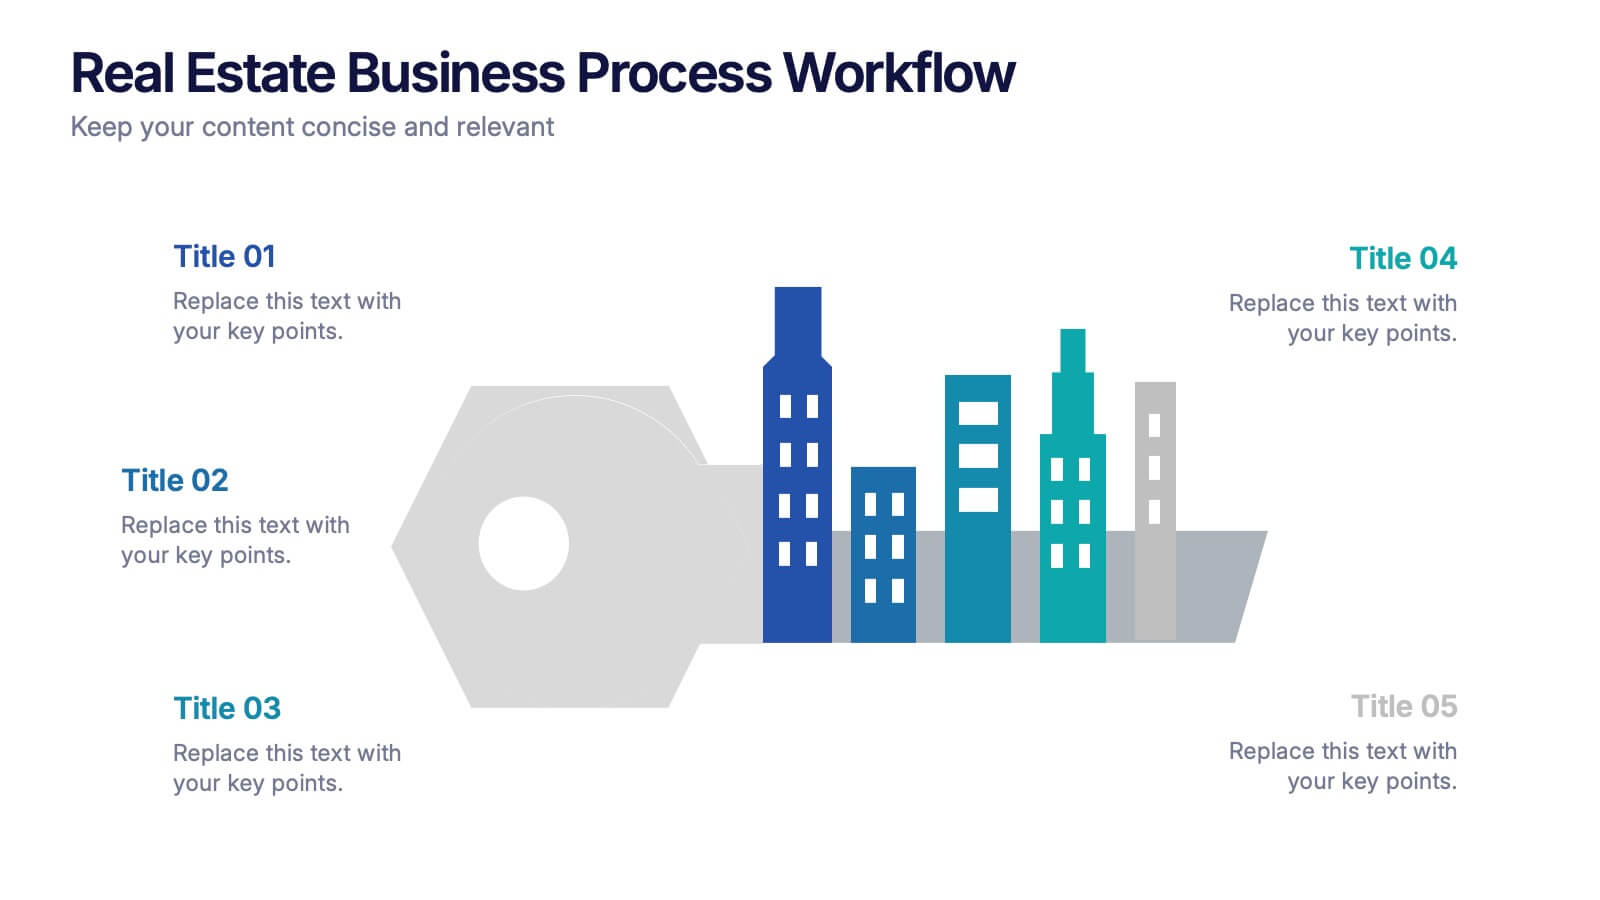
Real Estate Business Process Workflow Presentation
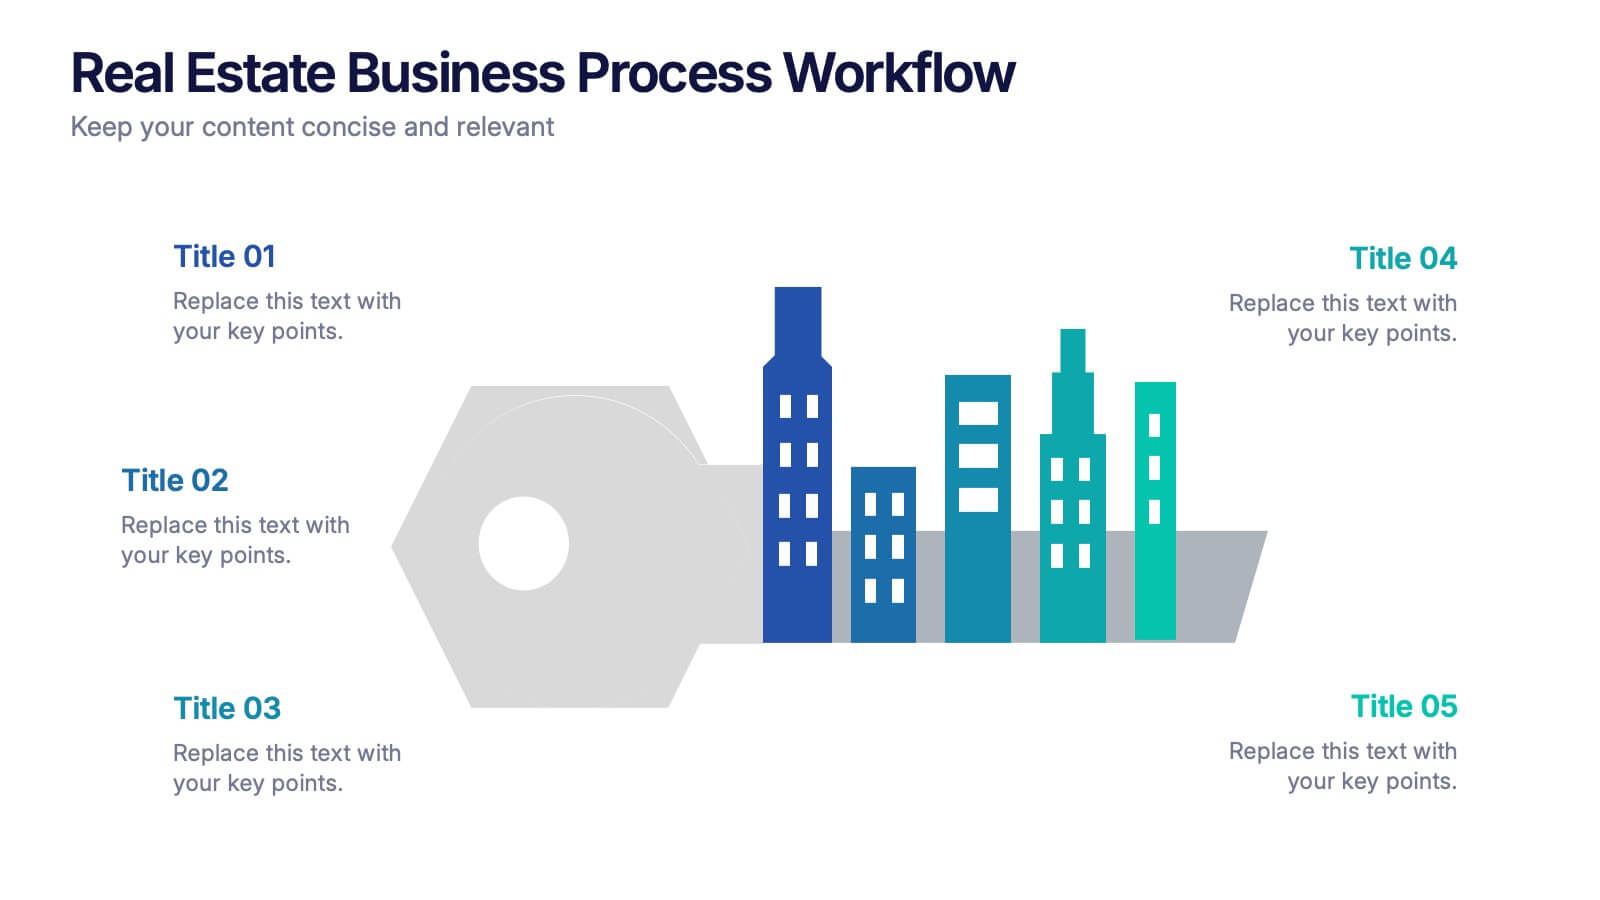
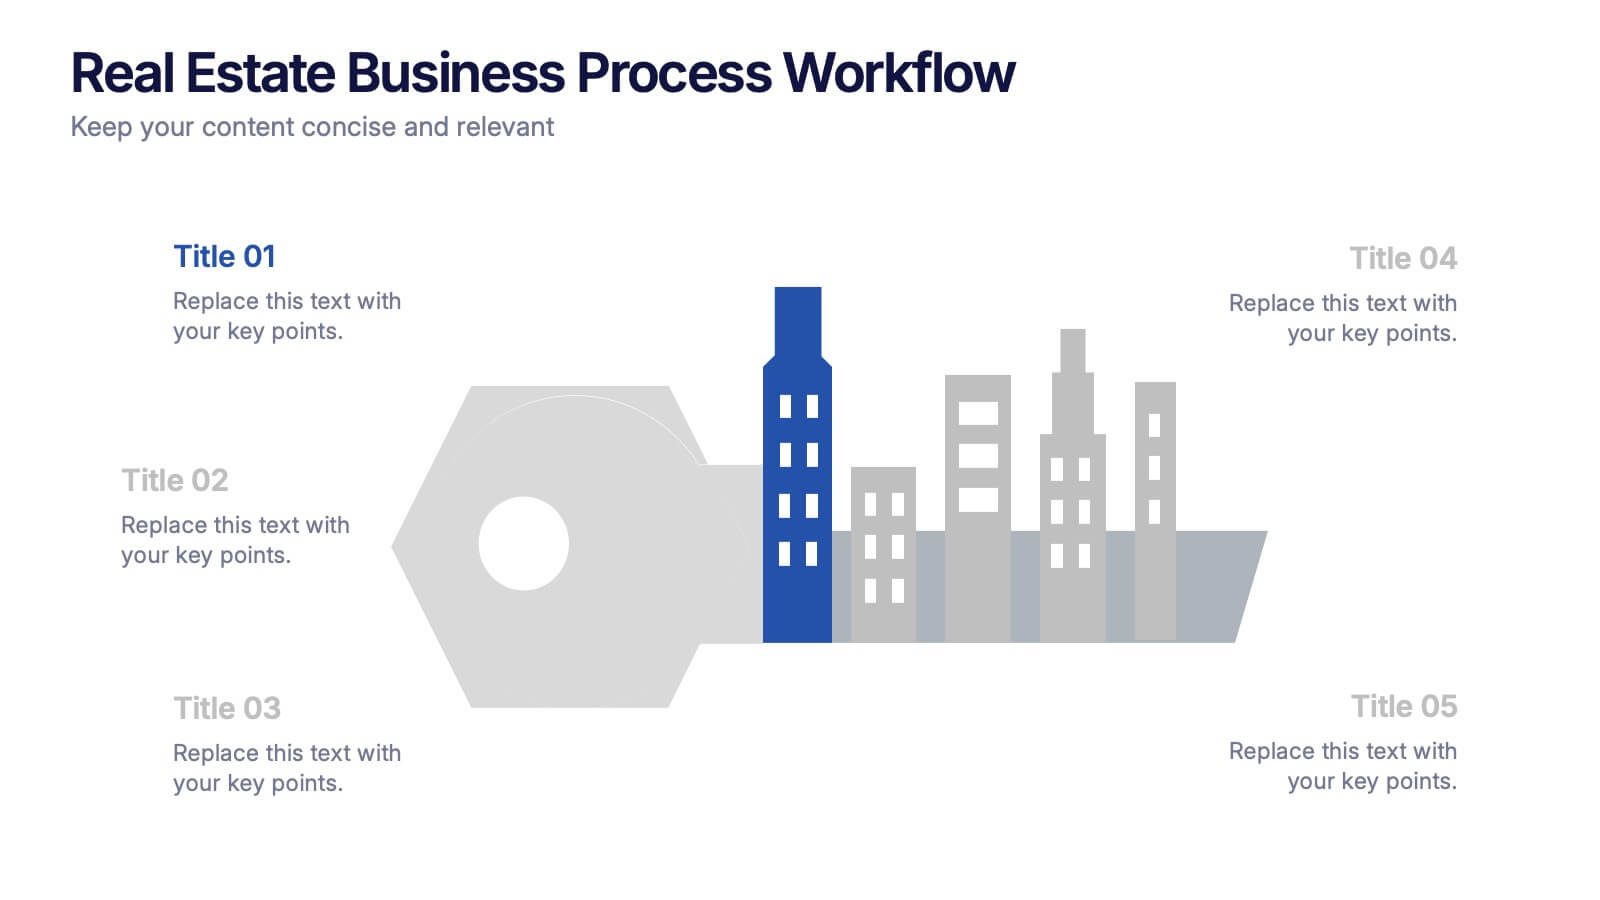
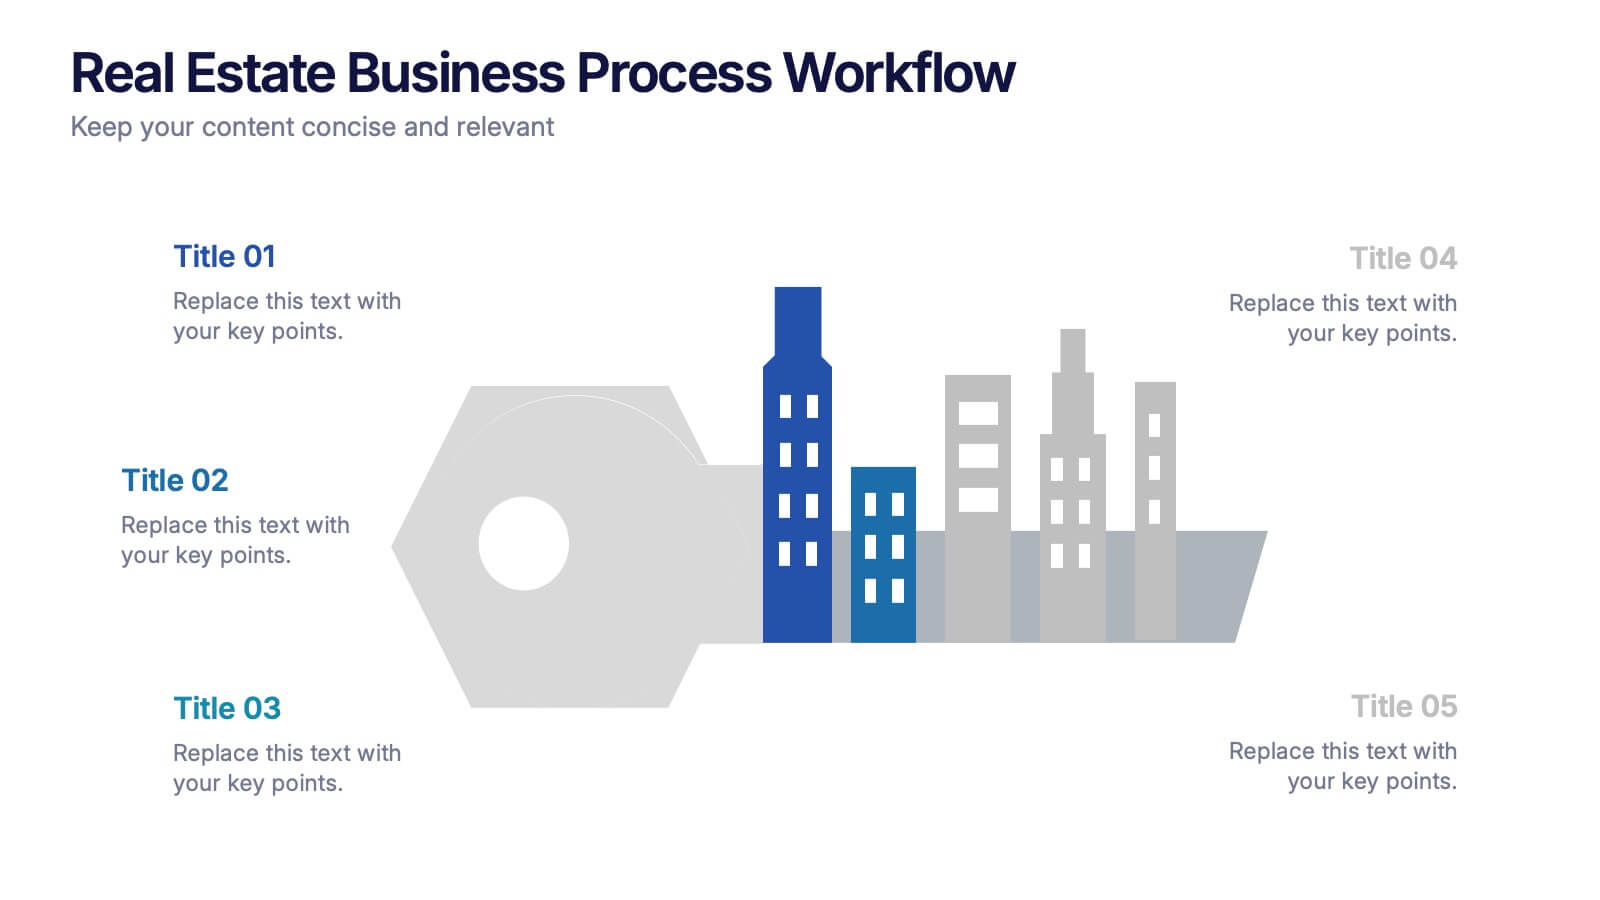
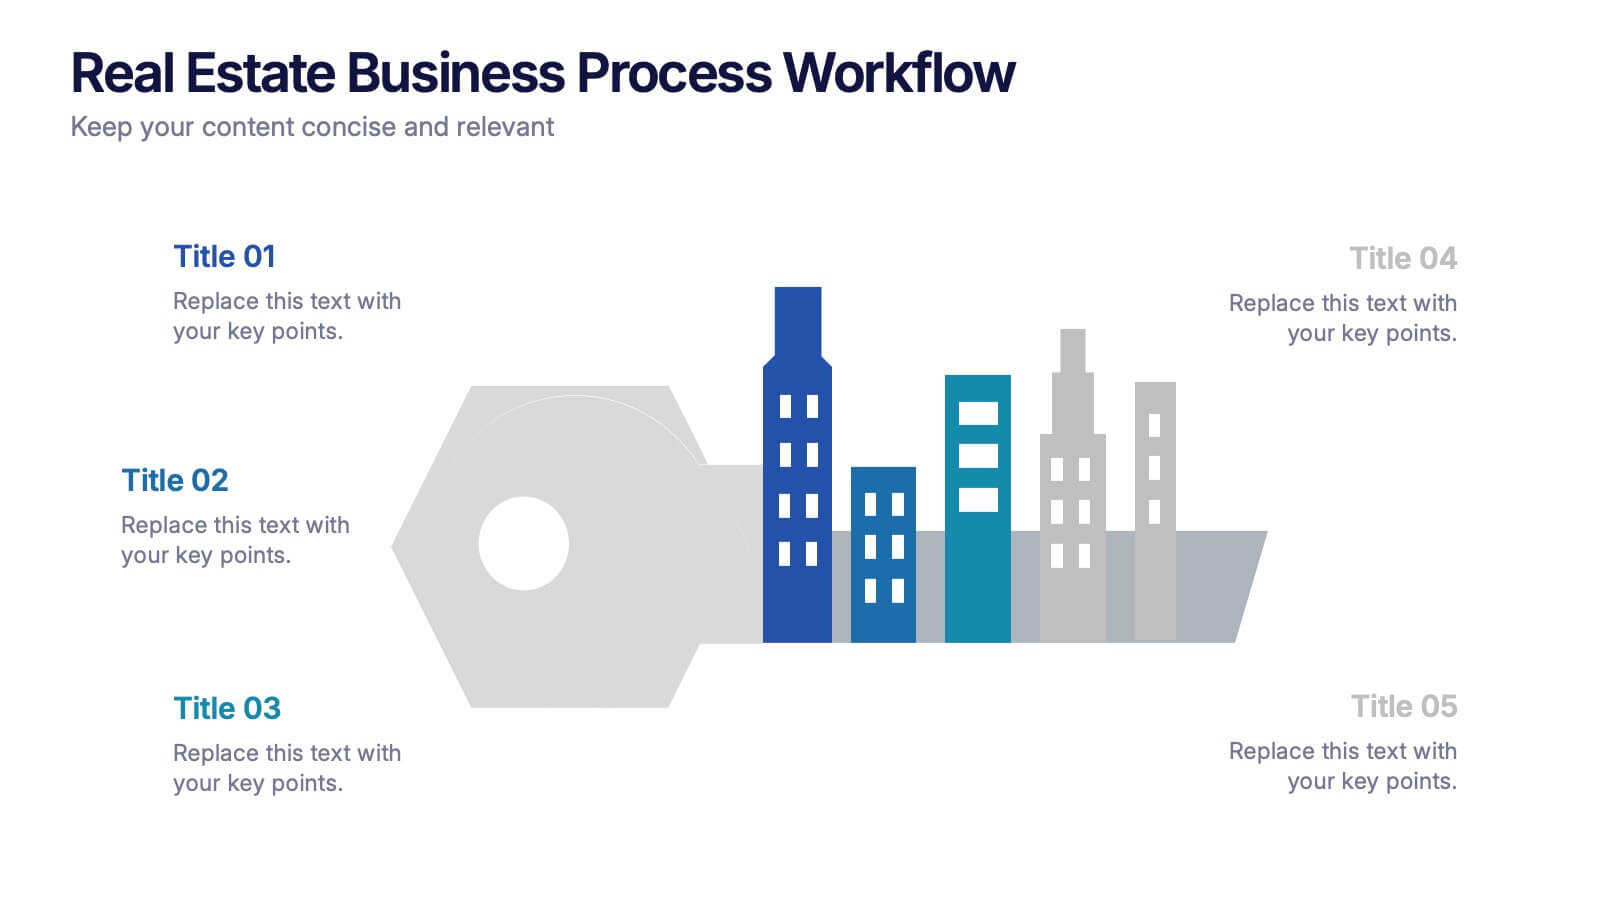
Streamline property operations with this real estate workflow template, designed to visualize each stage from acquisition to closing. Featuring a modern cityscape graphic and five-step layout, it’s perfect for showcasing processes, timelines, or strategies. Fully editable in Canva, PowerPoint, or Google Slides for professional, industry-specific presentations.
- Remove from favorites
Powerpoint Template
1 MB
Google Slides Template
External link
Keynote Template
1 MB
4 slides
HR Policies and Employee Management Presentation
Clearly outline your workplace strategies with this HR Policies and Employee Management slide. Featuring four color-coded segments alongside an illustration of employee analysis, this layout is ideal for presenting onboarding steps, employee benefits, internal policies, or training procedures. Fully editable and compatible with PowerPoint, Keynote, and Google Slides for seamless customization.
- Remove from favorites
Powerpoint Template
1 MB
Google Slides Template
External link
Keynote Template
2 MB
8 slides
Employee Onboarding Process
Guide new hires with clarity using the Employee Onboarding Process Presentation. This clean, step-by-step visual is perfect for HR managers, team leads, and company trainers. It includes four distinct onboarding phases, each with icons, titles, and editable descriptions to explain the key tasks in each stage—from welcome orientation to integration. Choose between dark and light background versions to suit your branding, and easily edit in PowerPoint, Keynote, or Google Slides.
- Remove from favorites
Powerpoint Template
1 MB
Google Slides Template
External link
Keynote Template
2 MB
5 slides
Climate Change Activism Infographics
Climate change activism refers to the efforts of individuals, organizations, and communities that are dedicated to raising awareness about the urgent need to address and mitigate the impacts of climate change. These vertical infographics are powerful and visually compelling presentations that aim to raise awareness about the pressing issue of climate change and inspire action towards a sustainable future. This template is ideal for environmental organizations, activists, educators, and anyone seeking to educate the public about climate change and the urgent need for collective action. Fully compatible with powerpoint, Keynote, and Google Slides.
- Remove from favorites
Powerpoint Template
1 MB
Google Slides Template
External link
Keynote Template
1 MB
6 slides
System Maintenance and Support Presentation
Streamline your technical processes with the System Maintenance and Support Presentation. This slide features a clean alphabetical list layout (A–E) paired with icons and concise text areas—ideal for illustrating maintenance protocols, support categories, or troubleshooting stages. The right-side wrench graphic adds a visual metaphor for IT upkeep. Fully editable in PowerPoint, Keynote, and Google Slides.
- Remove from favorites
Powerpoint Template
1 MB
Google Slides Template
External link
Keynote Template
1 MB
6 slides
Demographic Data Analysis Presentation
The "Demographic Data Analysis" presentation effectively visualizes demographic splits using a simple yet engaging pie chart. The template features a clean layout with distinct sections labeled for different demographic metrics, represented by the percentage splits of 35% and 65%. Each section includes placeholder text for inserting detailed insights, making it an excellent tool for presentations that need to communicate demographic data clearly and attractively. The design is versatile and can be adapted for various analysis needs in business or research contexts.
- Remove from favorites
Powerpoint Template
1 MB
Google Slides Template
External link
Keynote Template
1 MB
5 slides
2024 Financial Report Summary Presentation
Turn complex financial data into a clear visual story that’s easy to follow and engaging to present. This clean, data-focused design helps highlight yearly performance, key insights, and budget breakdowns with precision. Fully editable and compatible with PowerPoint, Keynote, and Google Slides for effortless customization and presentation delivery.
- Remove from favorites
Powerpoint Template
1 MB
Google Slides Template
External link
Keynote Template
1 MB
6 slides
Process Direction Flow Mapping
Showcase linear progress with clarity using the Process Direction Flow Mapping Presentation. This layout features a clean, step-by-step directional flow with five stages, ideal for outlining project phases, business workflows, or timeline milestones. Each stage is color-coded with editable text areas, making it easy to customize and adapt for PowerPoint, Keynote, or Google Slides.
- Remove from favorites
Powerpoint Template
1 MB
Google Slides Template
External link
Keynote Template
2 MB
10 slides
Projects Completion Checklist Presentation
Keep every milestone visible and celebrate progress with a clean, structured layout designed to track project achievements. This presentation helps teams communicate goals, timelines, and completed tasks clearly and professionally. Fully customizable and compatible with PowerPoint, Keynote, and Google Slides for seamless editing and polished project reporting.
- Remove from favorites
Powerpoint Template
1 MB
Google Slides Template
External link
Keynote Template
1 MB
6 slides
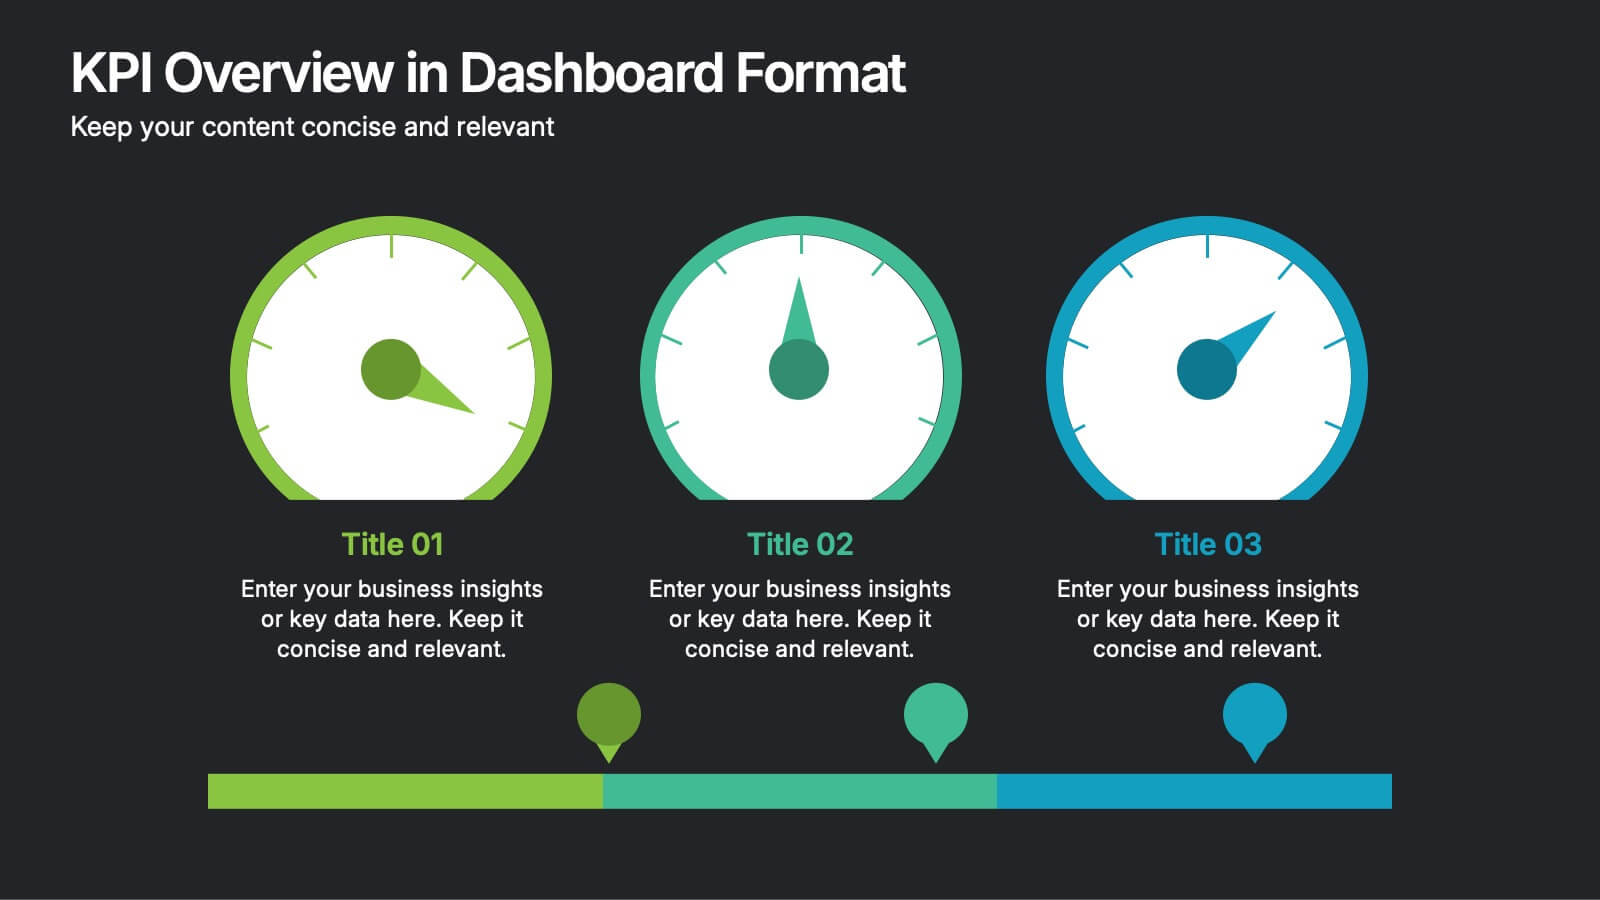
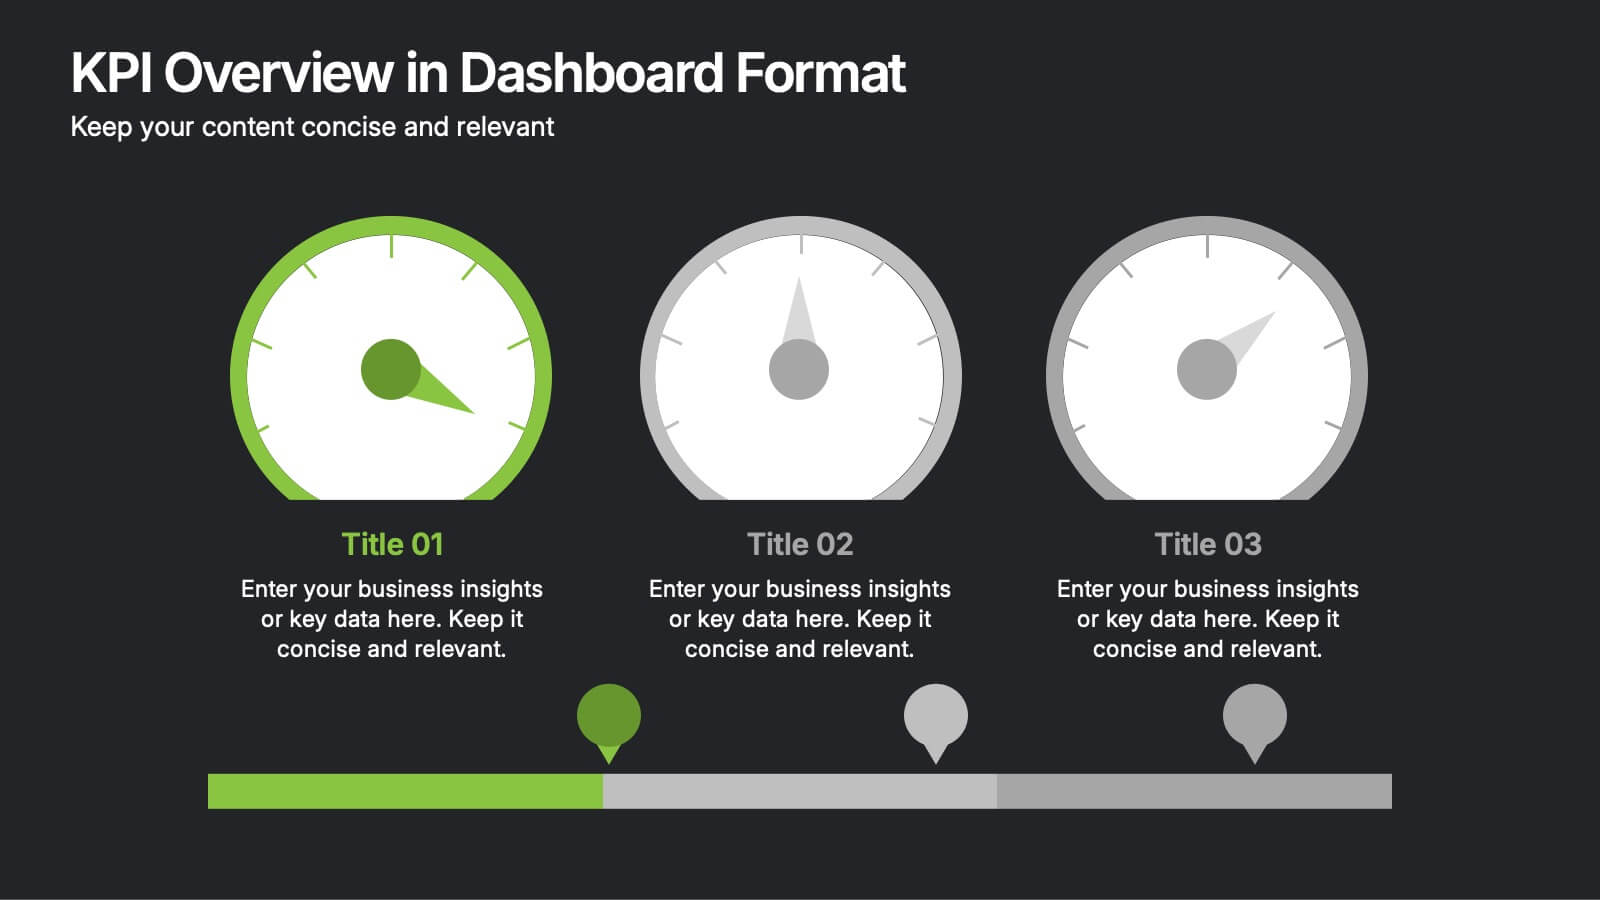
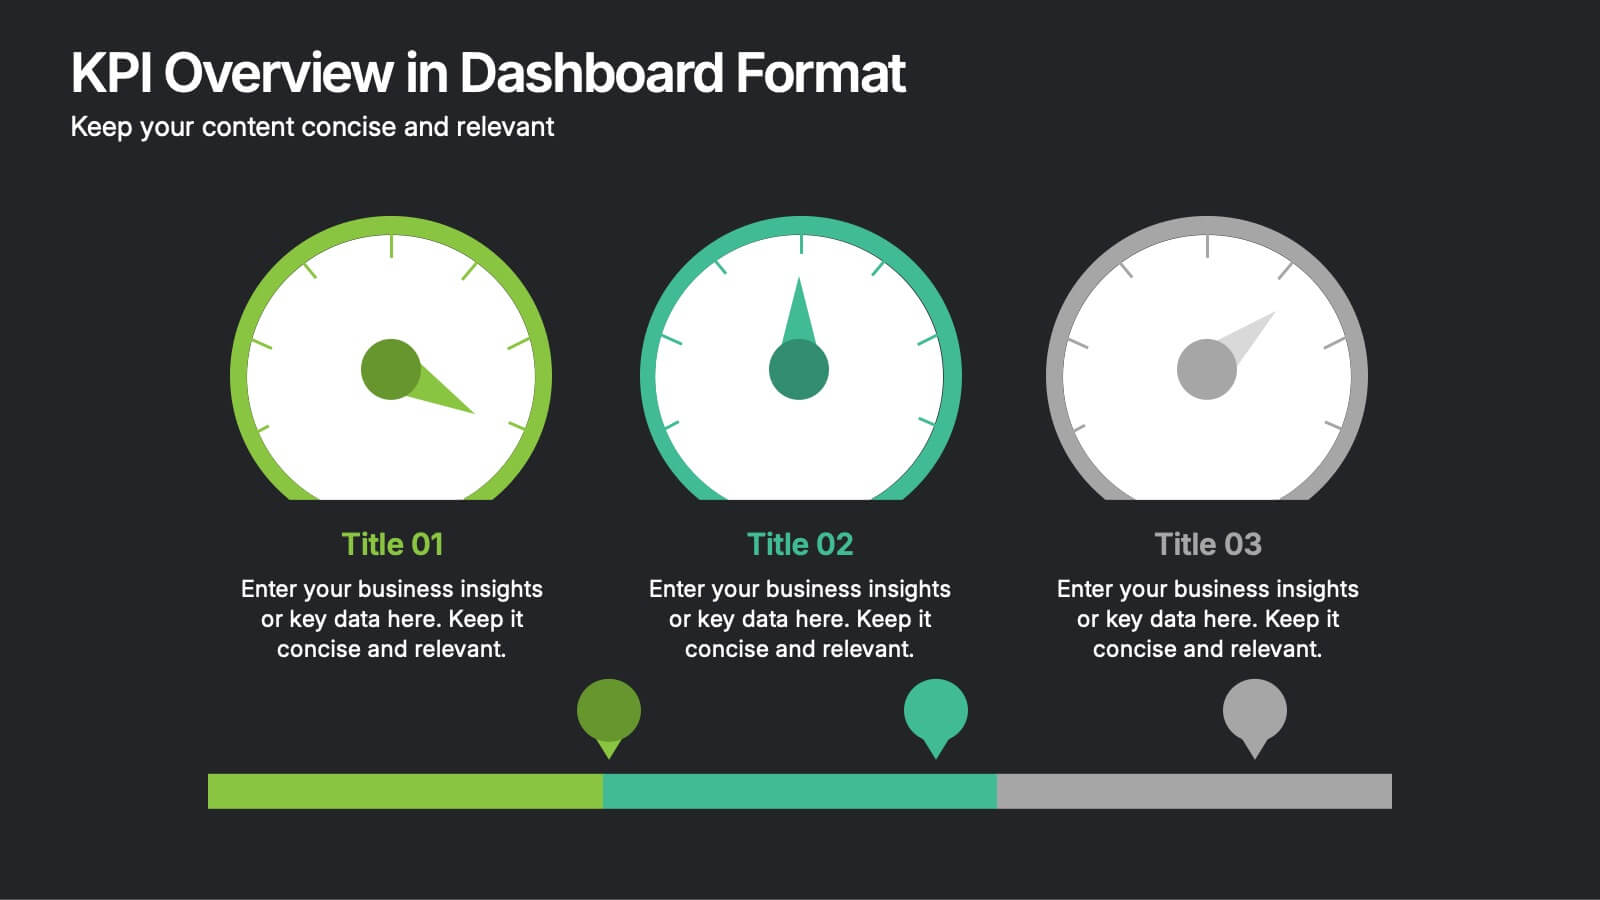
KPI Overview in Dashboard Format Presentation
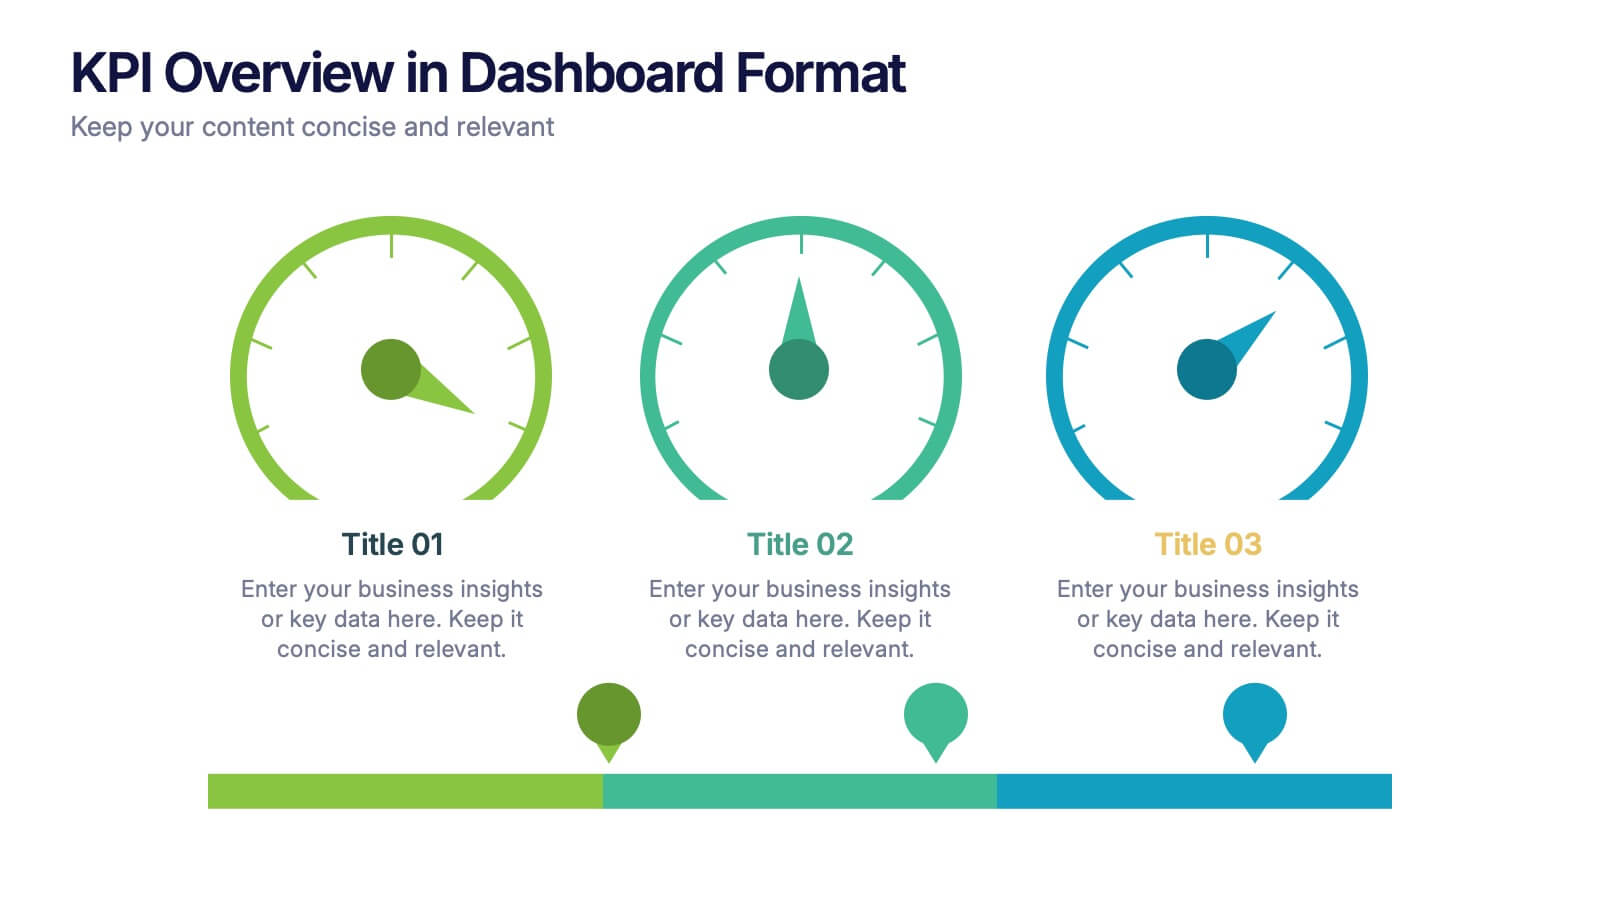
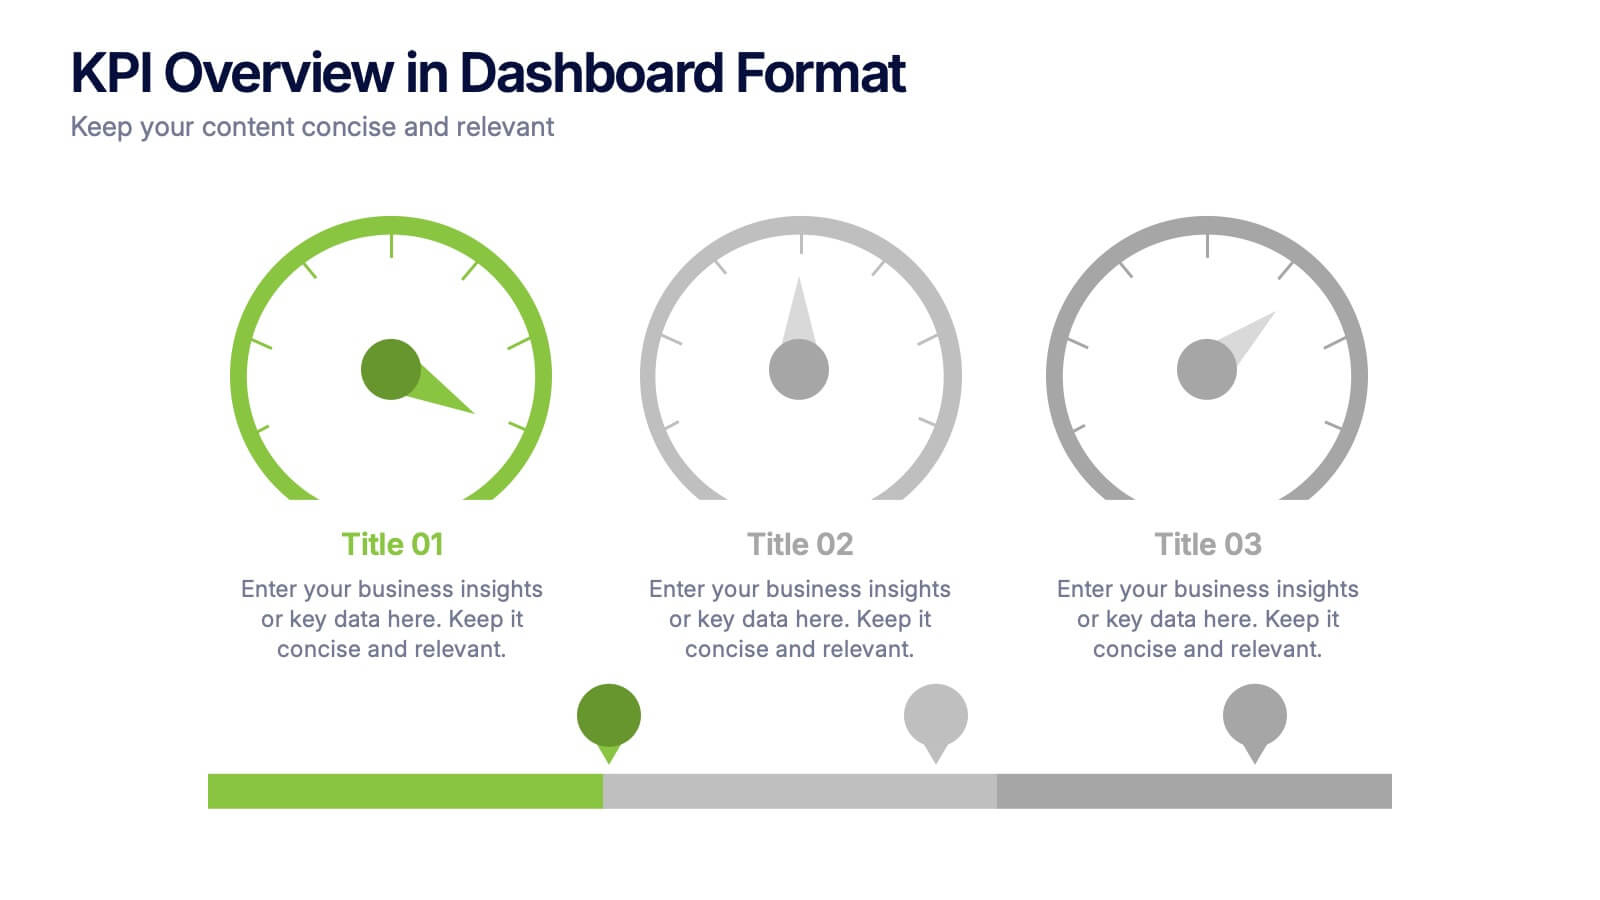
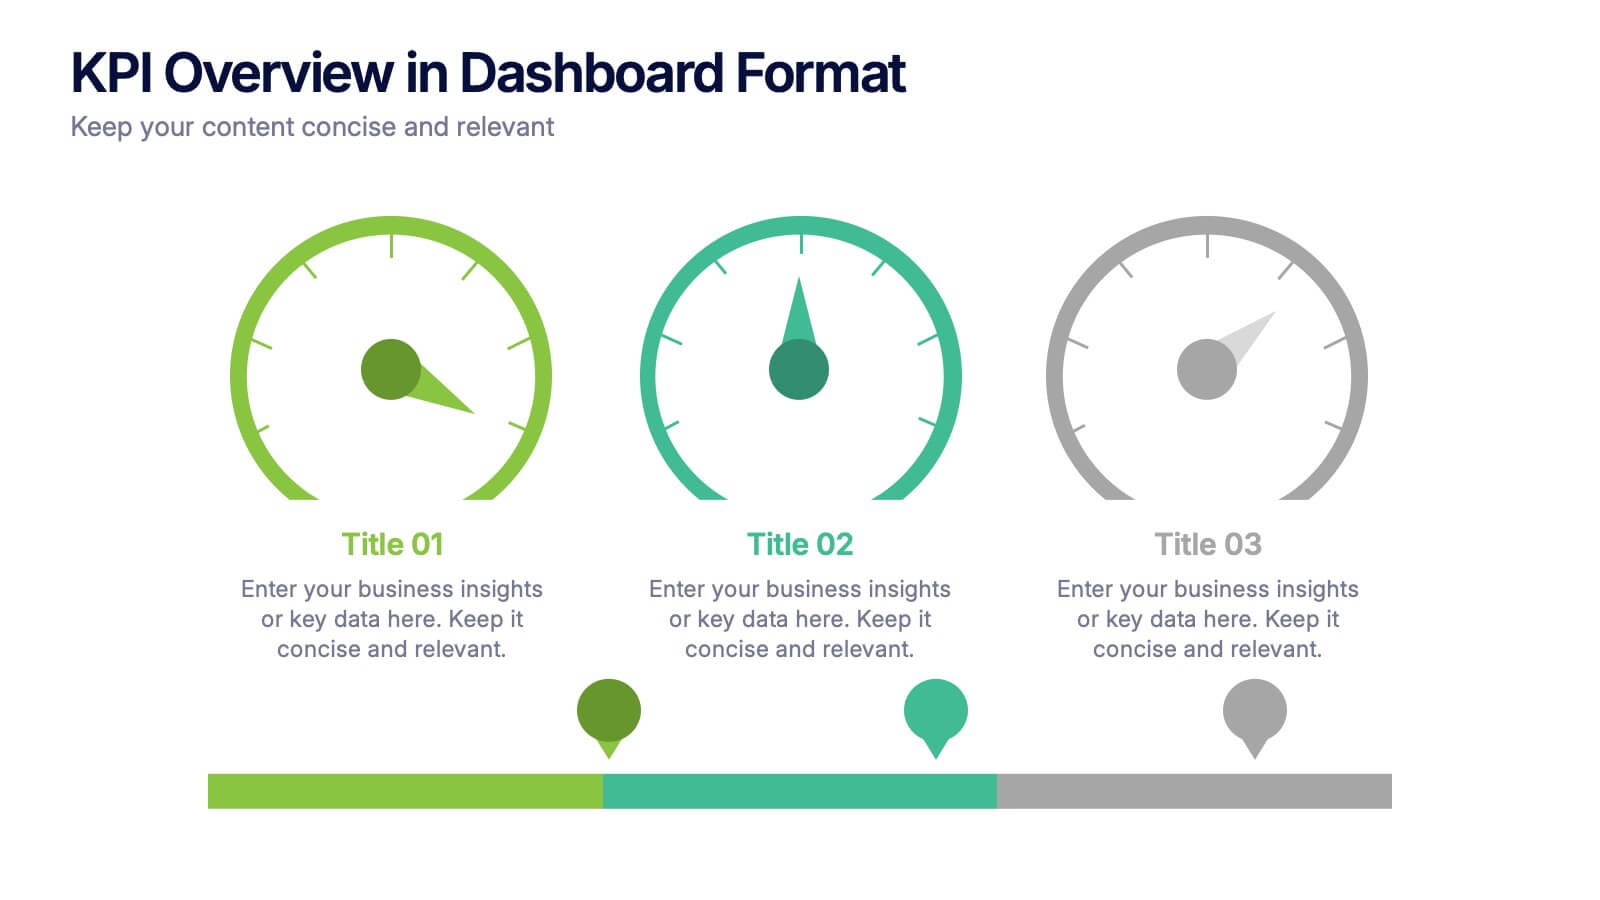
Track performance at a glance with this KPI Overview in Dashboard Format presentation. Featuring visual gauge meters and progress indicators, it's perfect for reporting on targets, performance metrics, and business KPIs. Clean and modern layout, fully customizable in Canva, PowerPoint, and Google Slides to match your data visualization needs.
- Remove from favorites
Powerpoint Template
1 MB
Google Slides Template
External link
Keynote Template
1 MB
5 slides
Global Nonprofit Help Infographics
A global nonprofit organization is a type of organization that operates on an international scale and focuses on making a positive impact on a global scale. These vertical infographics focuses on the impact and importance of nonprofit organizations worldwide. This is ideal for showcasing the achievements and goals of nonprofits in addressing various global issues, such as poverty, healthcare, and environmental conservation. The infographics include a collection of captivating icons and illustrations related to nonprofit work. These slides allow you to present compelling stories, case studies, and success stories that demonstrate the real-world impact of nonprofit work.
- Remove from favorites
Powerpoint Template
1 MB
Google Slides Template
External link
Keynote Template
1 MB
6 slides
Porter's Five Forces Market Analysis Presentation
Gain a competitive edge with this Porter's Five Forces market analysis template! Designed to help businesses assess industry dynamics, this structured layout highlights competitive rivalry, supplier power, buyer influence, new market entries, and substitute threats. Perfect for strategists and analysts. Fully customizable and compatible with PowerPoint, Keynote, and Google Slides.


