


Features
- 8 Unique Slides
- Fully editable and easy to edit in Microsoft Powerpoint, Keynote and Google Slides
- 16:9 widescreen layout
- Clean and professional designs
- Export to JPG, PDF or send by email


Do you have any questions?
Recommend


8 slides
Healthcare Data Analysis Presentation
The "Healthcare Data Analysis Presentation" template offers a streamlined visual representation ideal for communicating complex healthcare data insights effectively. Designed with clarity in mind, it features sleek graphics symbolizing medical elements and clear percentage tags that quantify data in an immediately understandable way. This template facilitates the presentation of key data such as patient outcomes, treatment efficacy, or operational efficiency within healthcare settings. Its visual simplicity makes it an excellent choice for healthcare professionals and administrators who need to convey detailed statistics and results to stakeholders, ensuring that the key points are easily digestible and actionable.


5 slides
Strategic Budget Planning Forecasting
Tired of messy spreadsheets? This clean and creative template makes budget forecasting easier to visualize and share. Centered around a playful piggy bank illustration, it lets you outline strategic goals, savings plans, and key metrics in a format that’s easy to follow. Fully compatible with PowerPoint, Keynote, and Google Slides.


6 slides
Business Challenge Identification Presentation
Spotting roadblocks has never looked this good! This infographic presentation template helps you map out key pain points across departments or processes, making it easier to analyze, discuss, and resolve challenges visually. It’s a perfect tool for business strategy teams and consultants. Fully compatible with PowerPoint, Keynote, and Google Slides.


7 slides
Solution Infographics Presentation Template
Featuring our solution Infographic template, We have a solution for your presentation problems. Give your next presentation the edge with this template, that allows you to present the perfect solutions to your audience. All the content is completely customizable and the built-in icons can be replaced with your own text and illustrations. Choose from the various themes available, and make it fit your needs. This template contains all the elements needed to make your infographic presentation pop! graphs, photos and a minimal style makes this design perfect for any kind of project.


21 slides
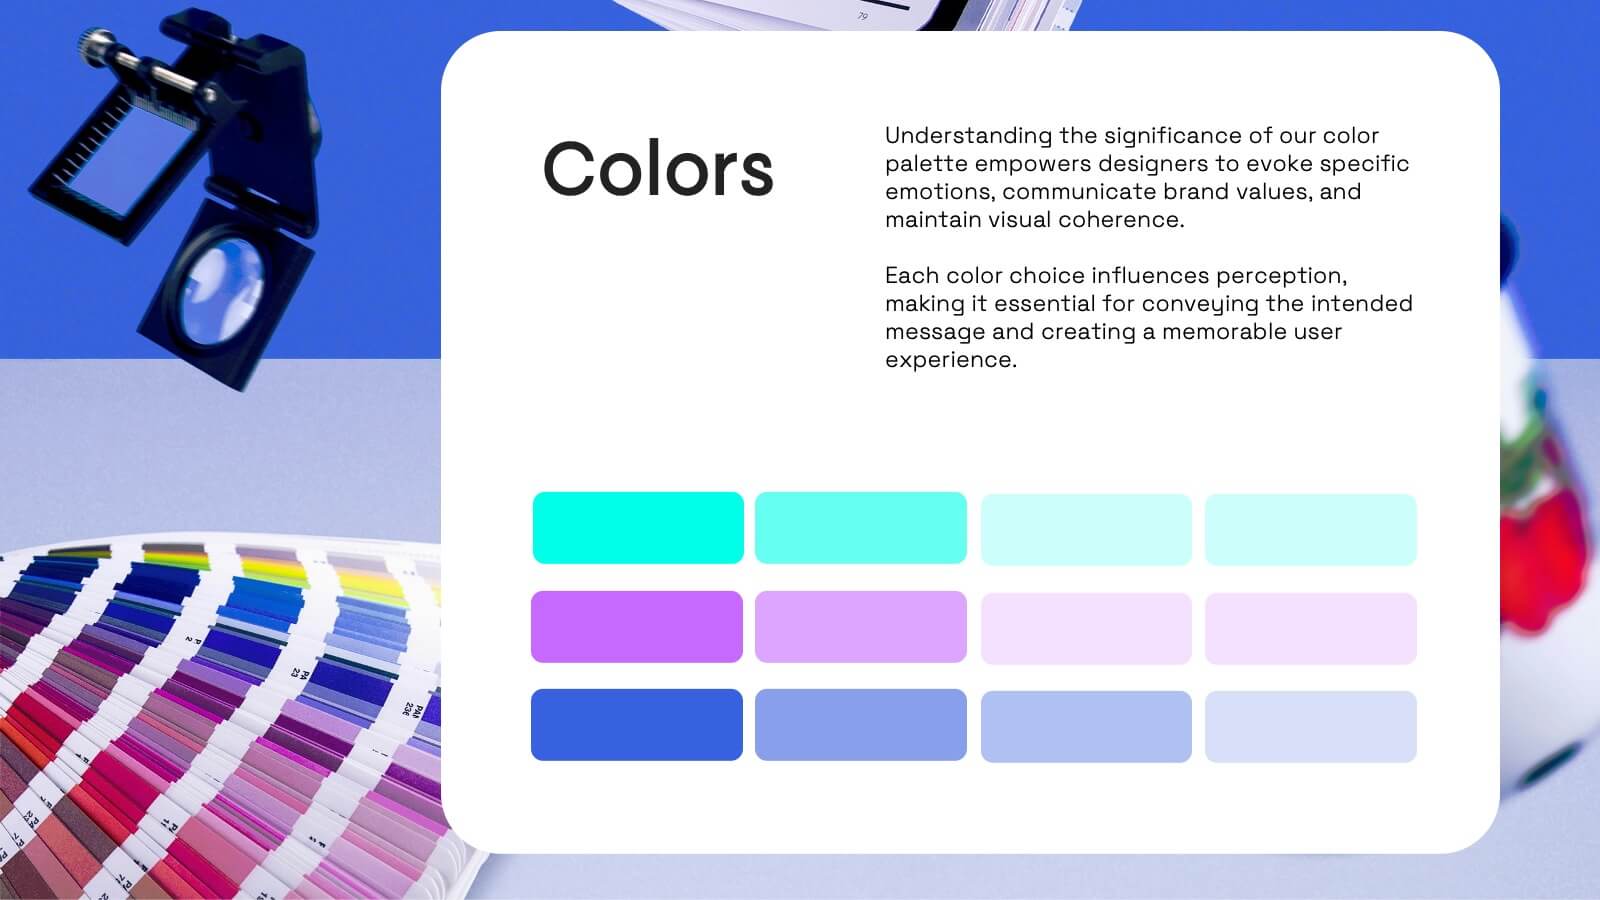
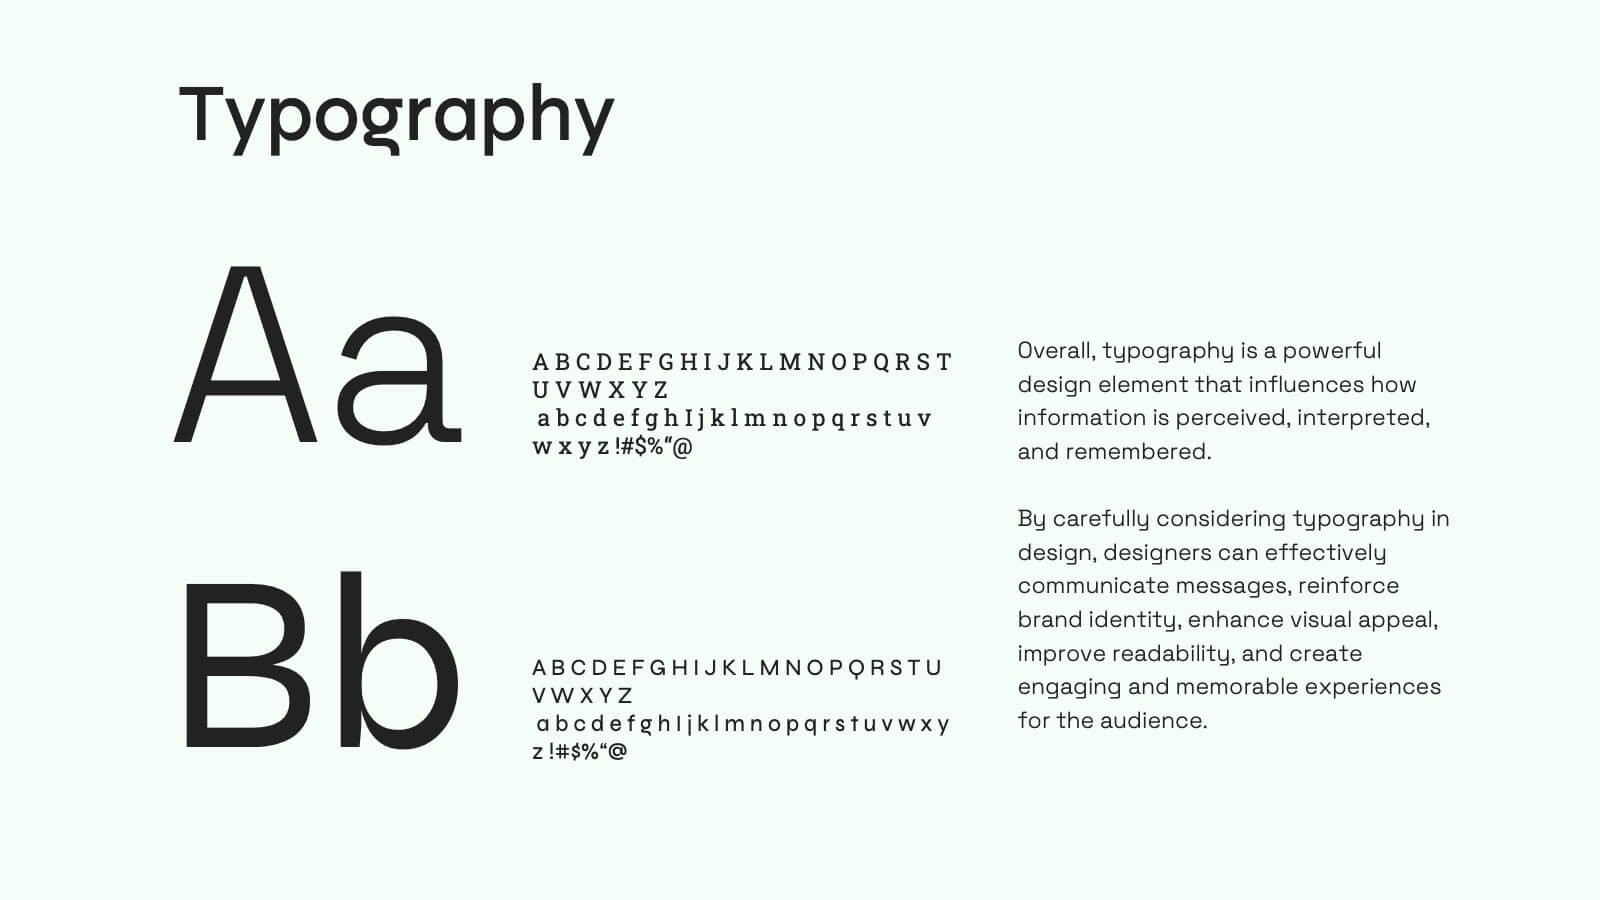
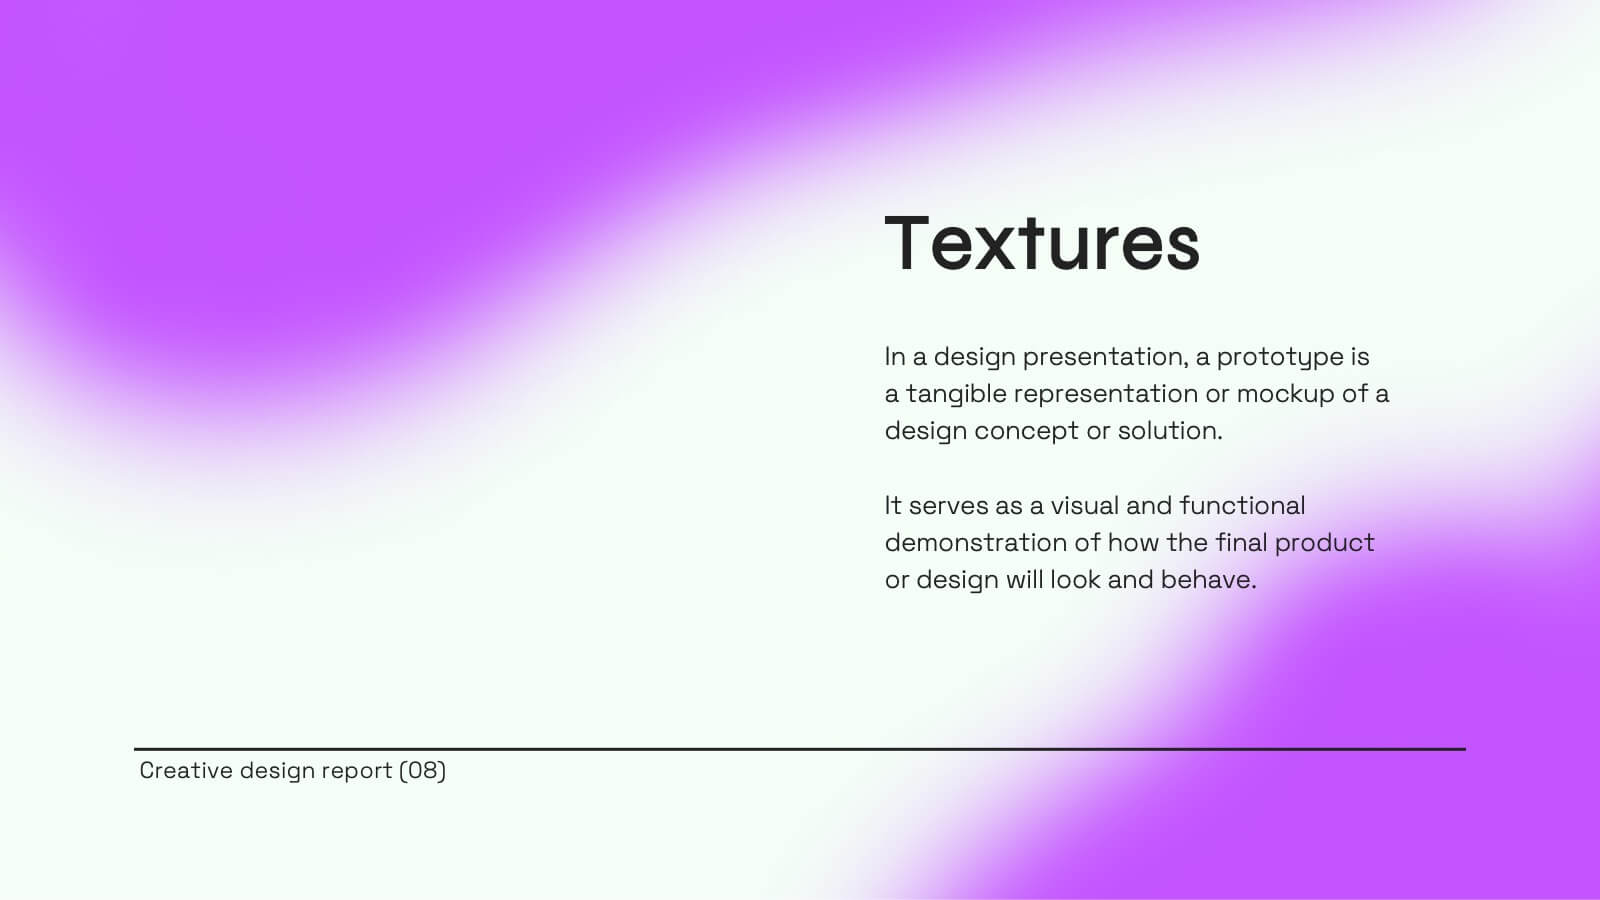
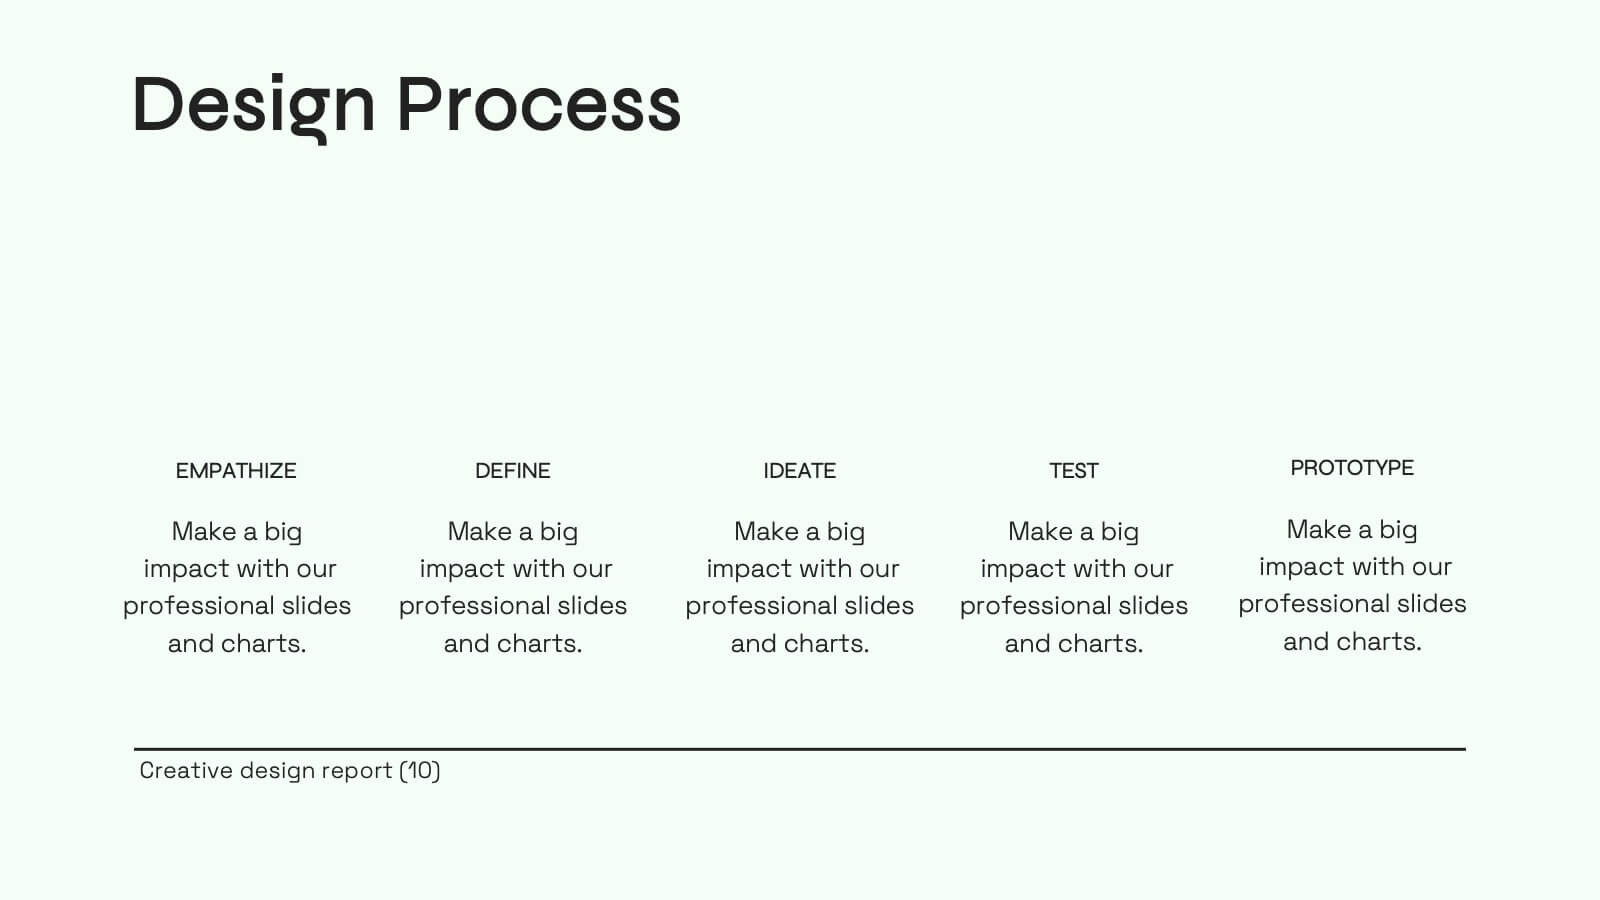
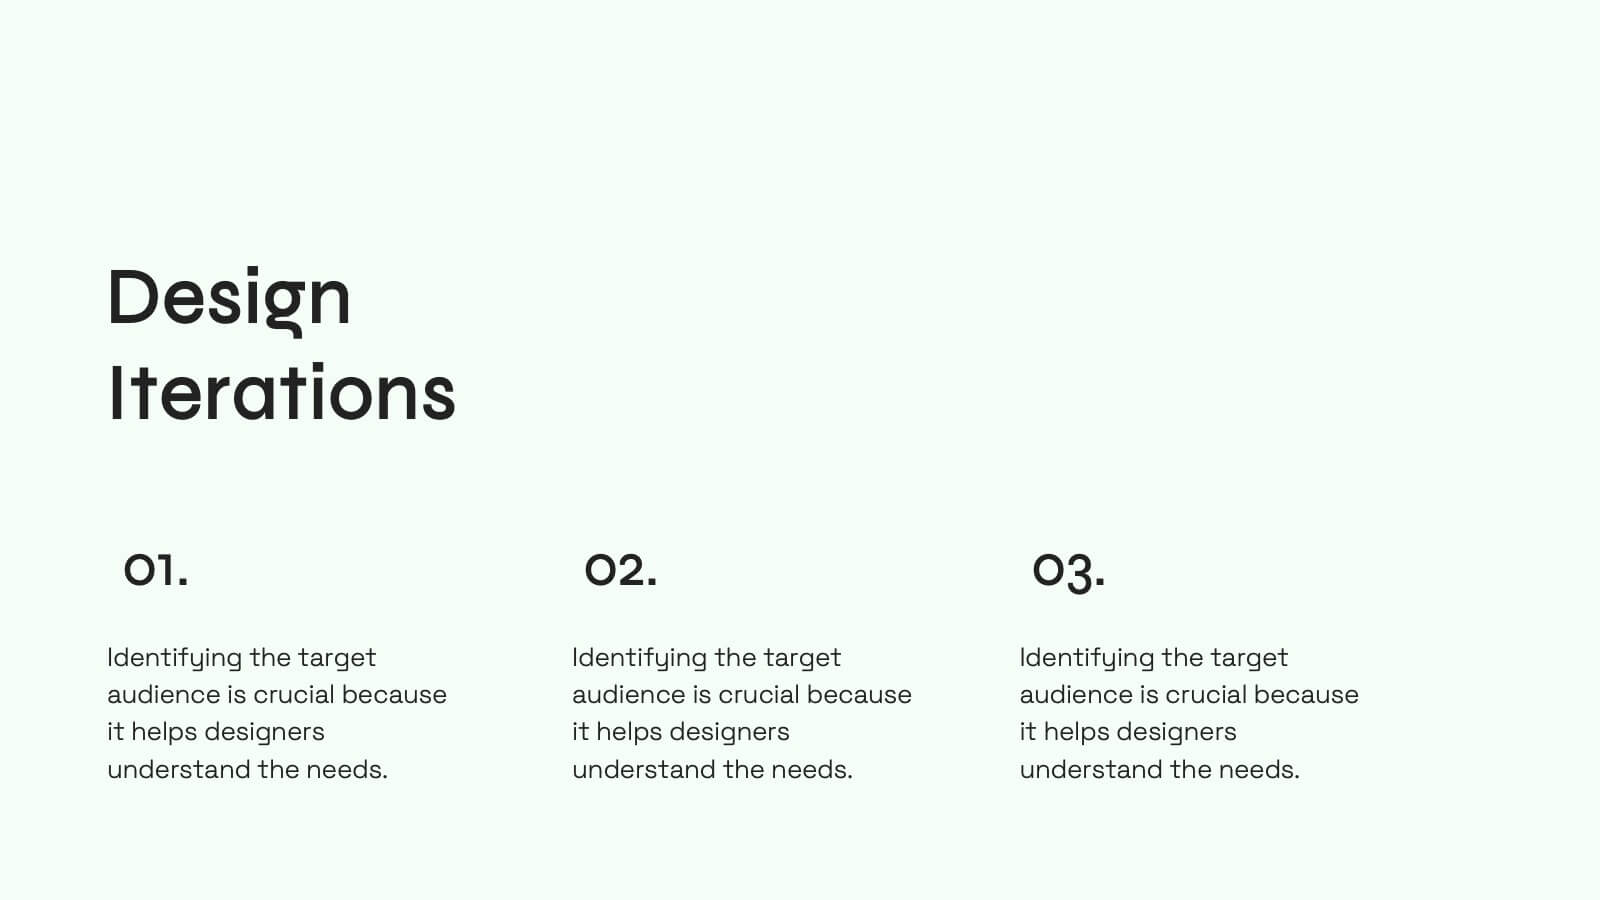
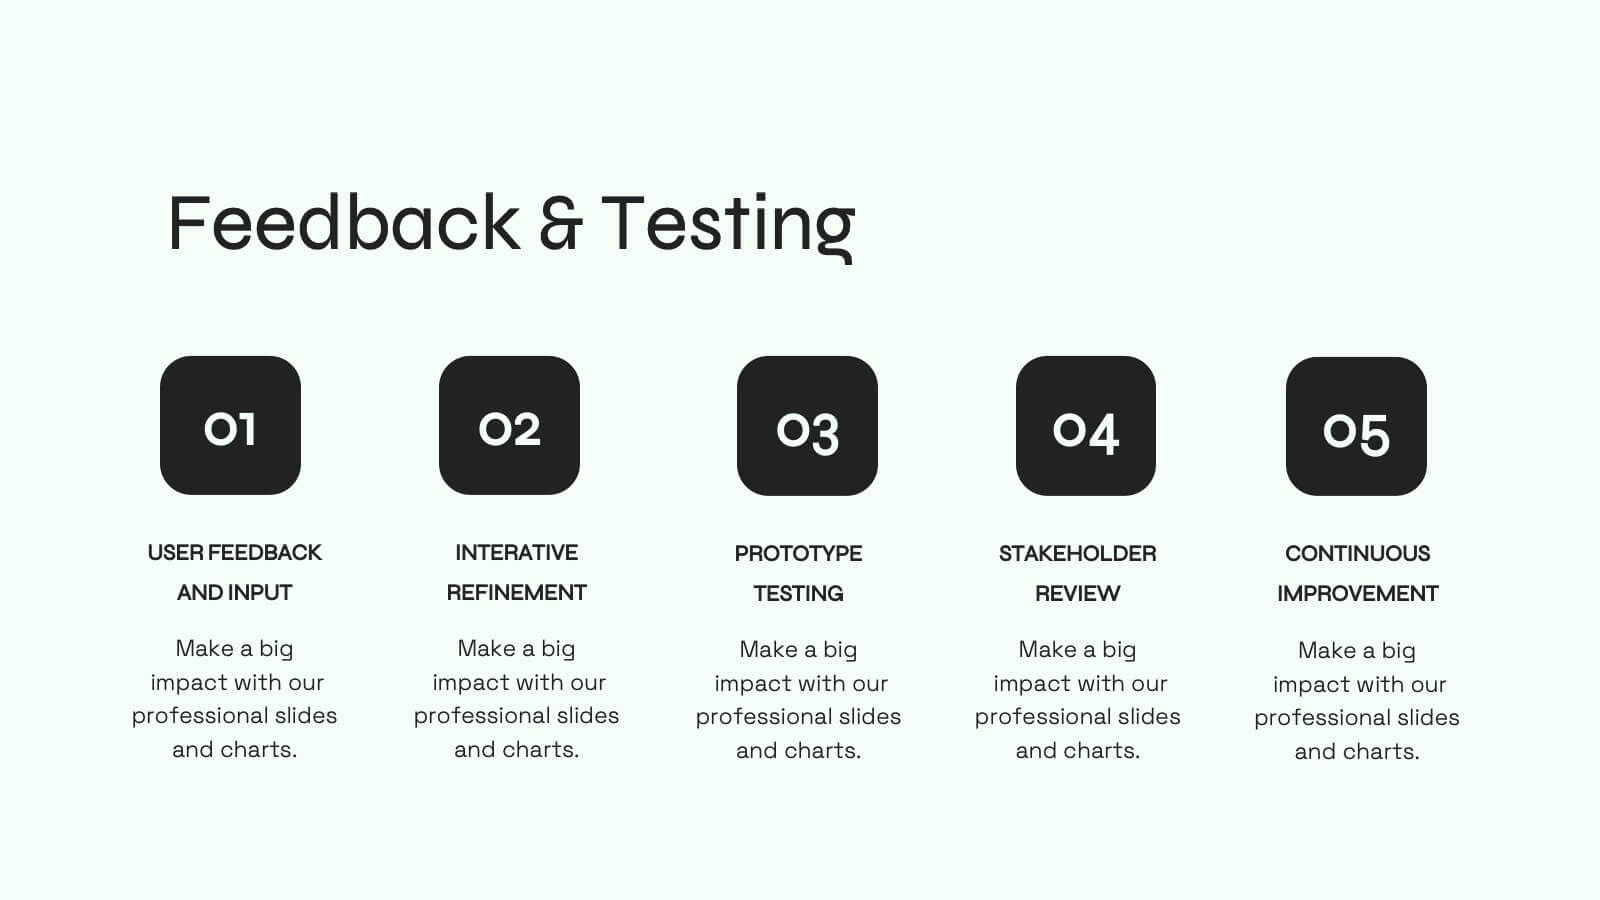
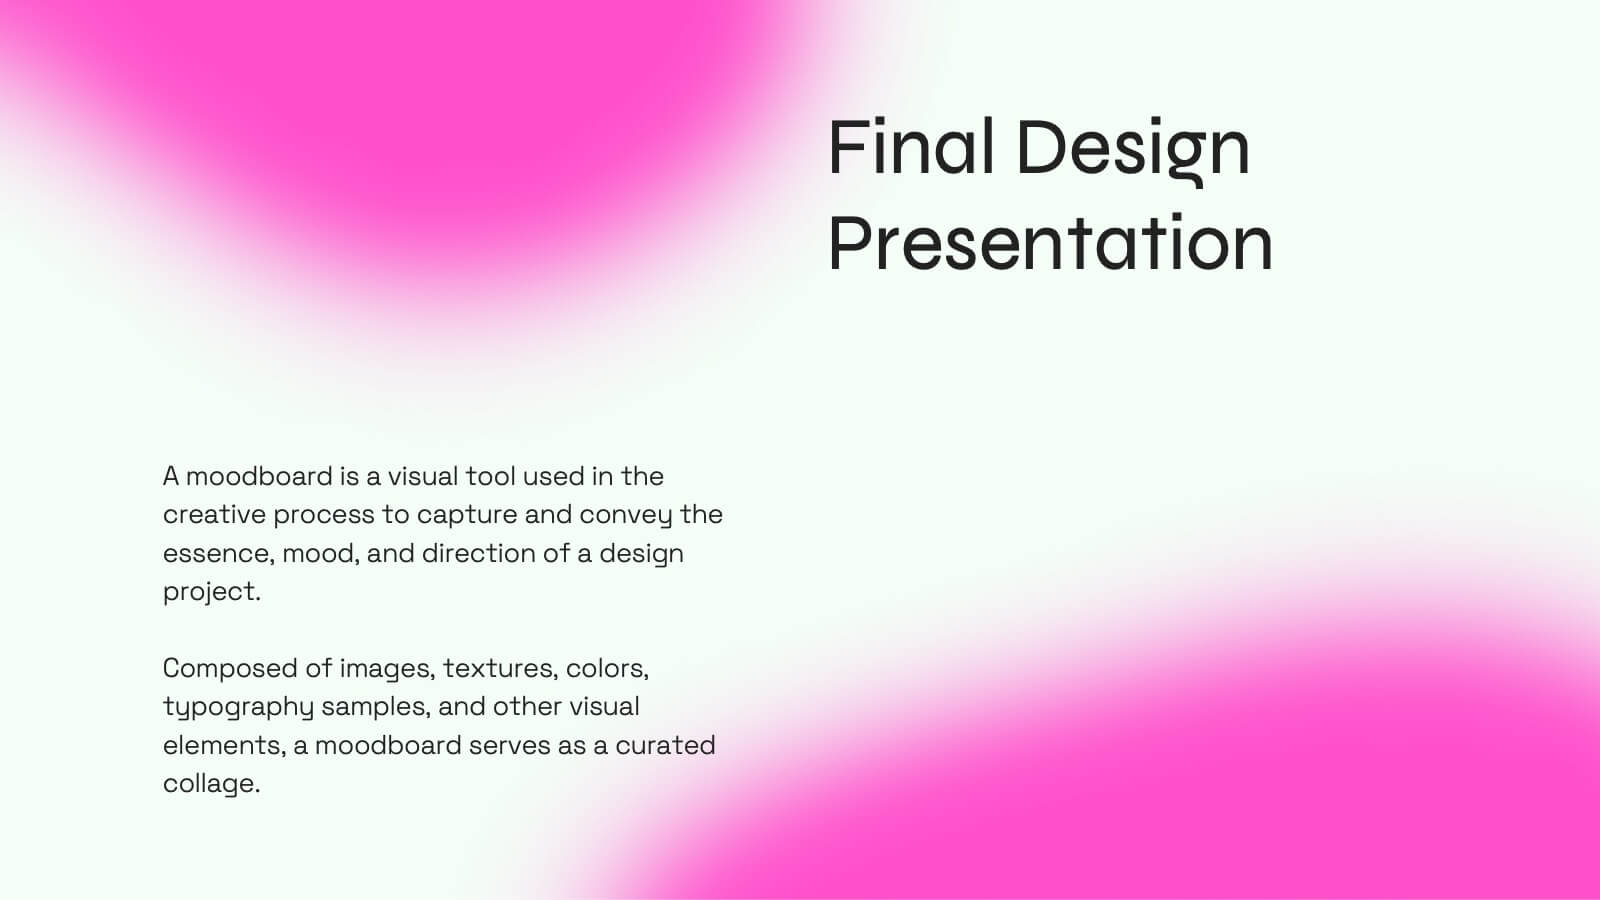
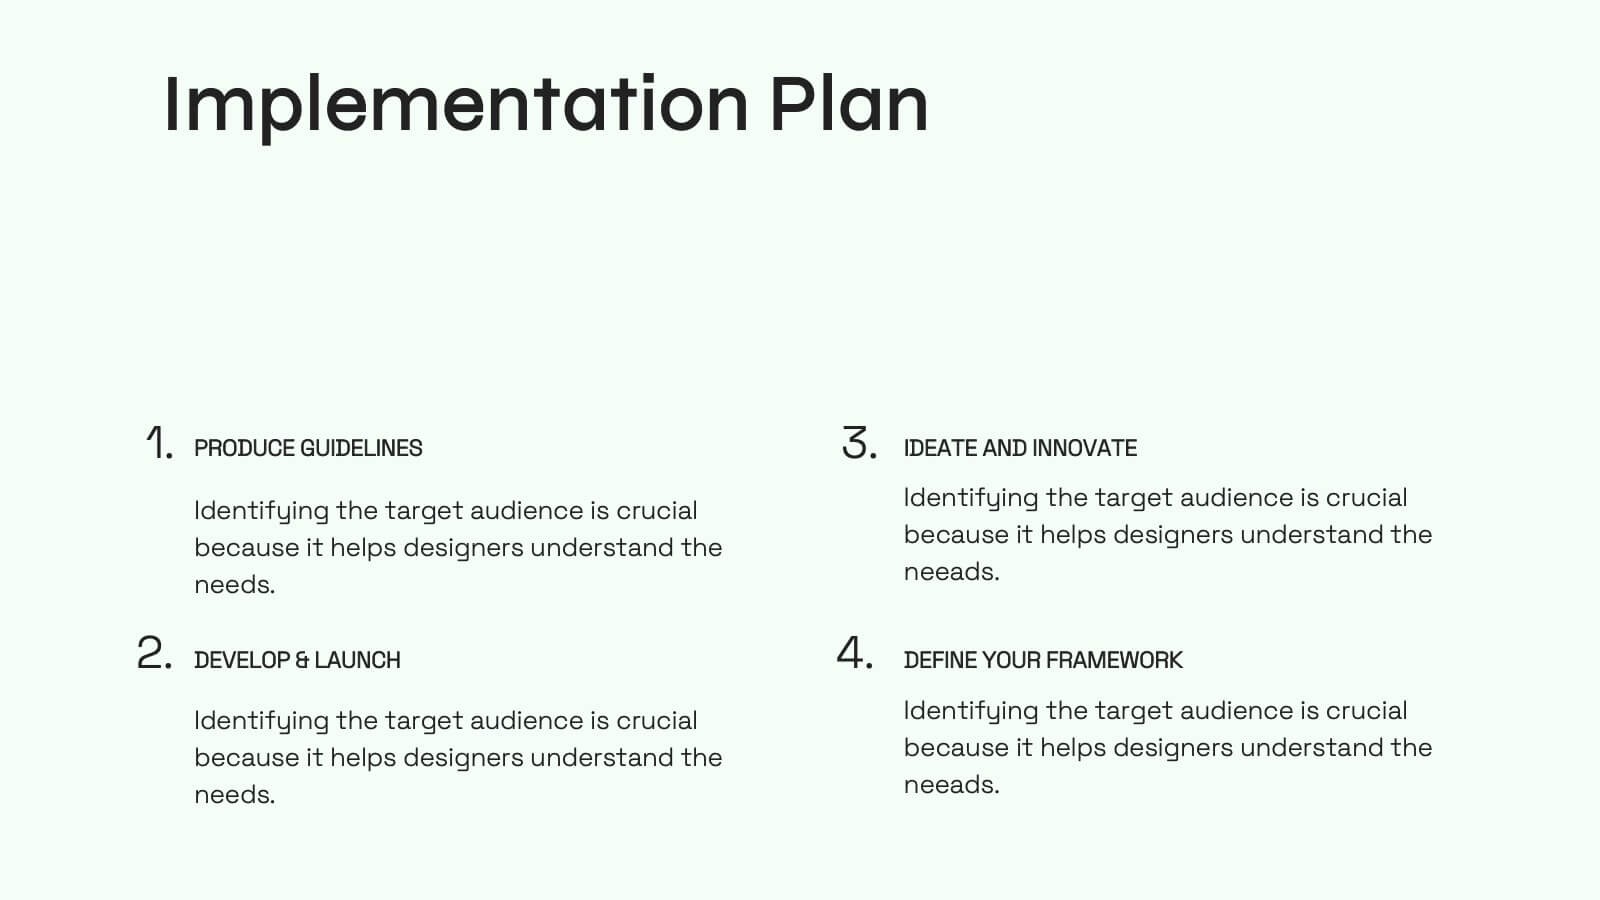
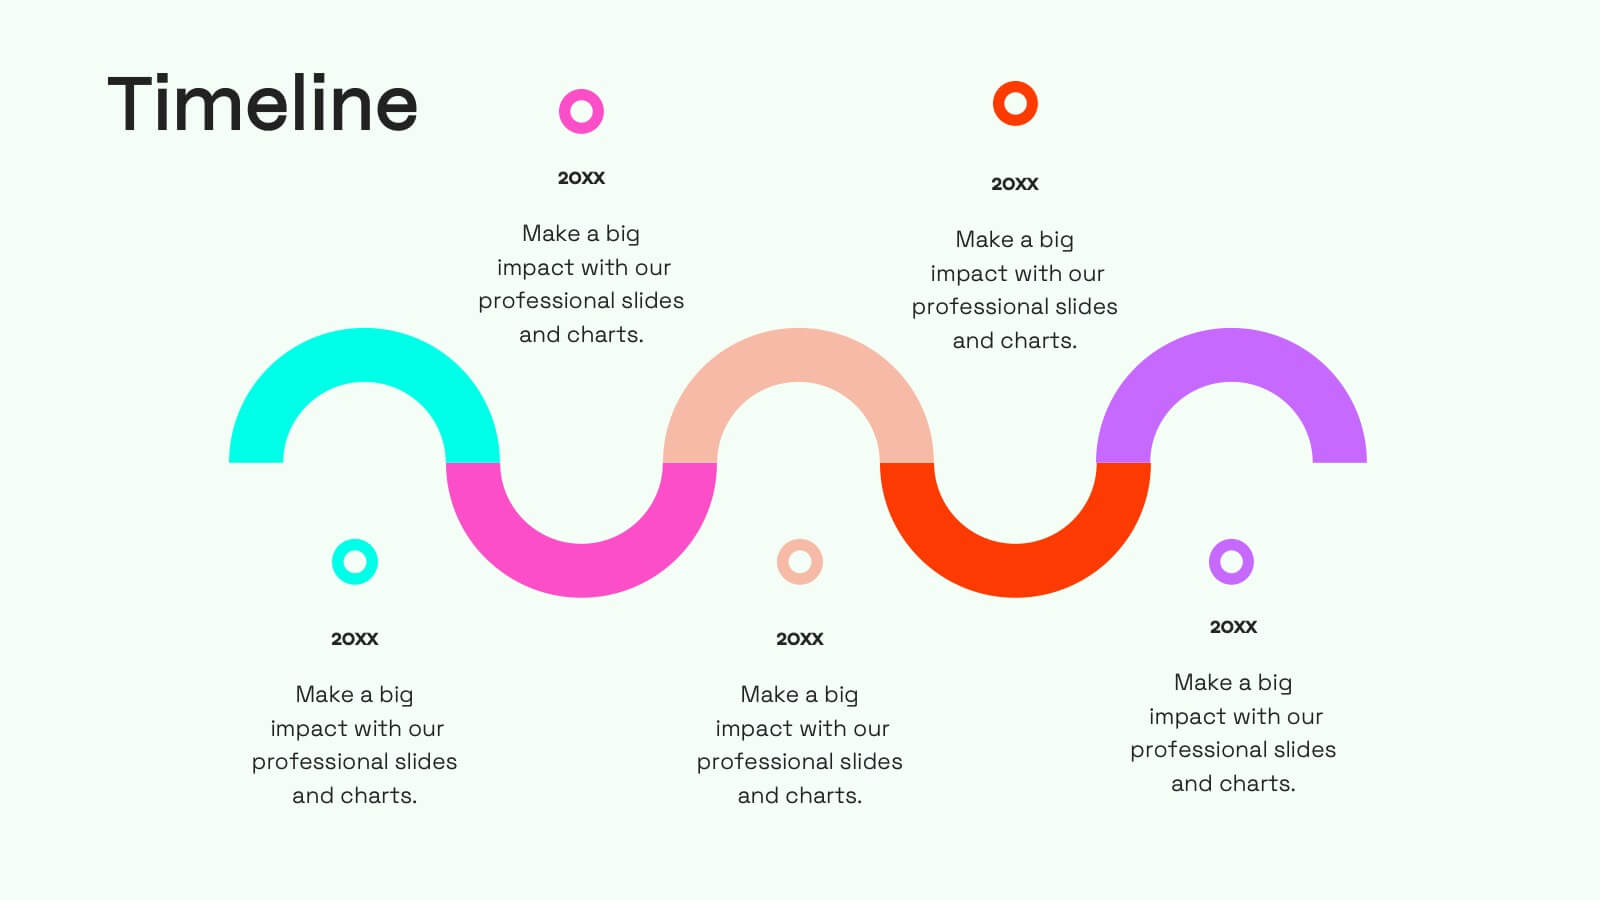
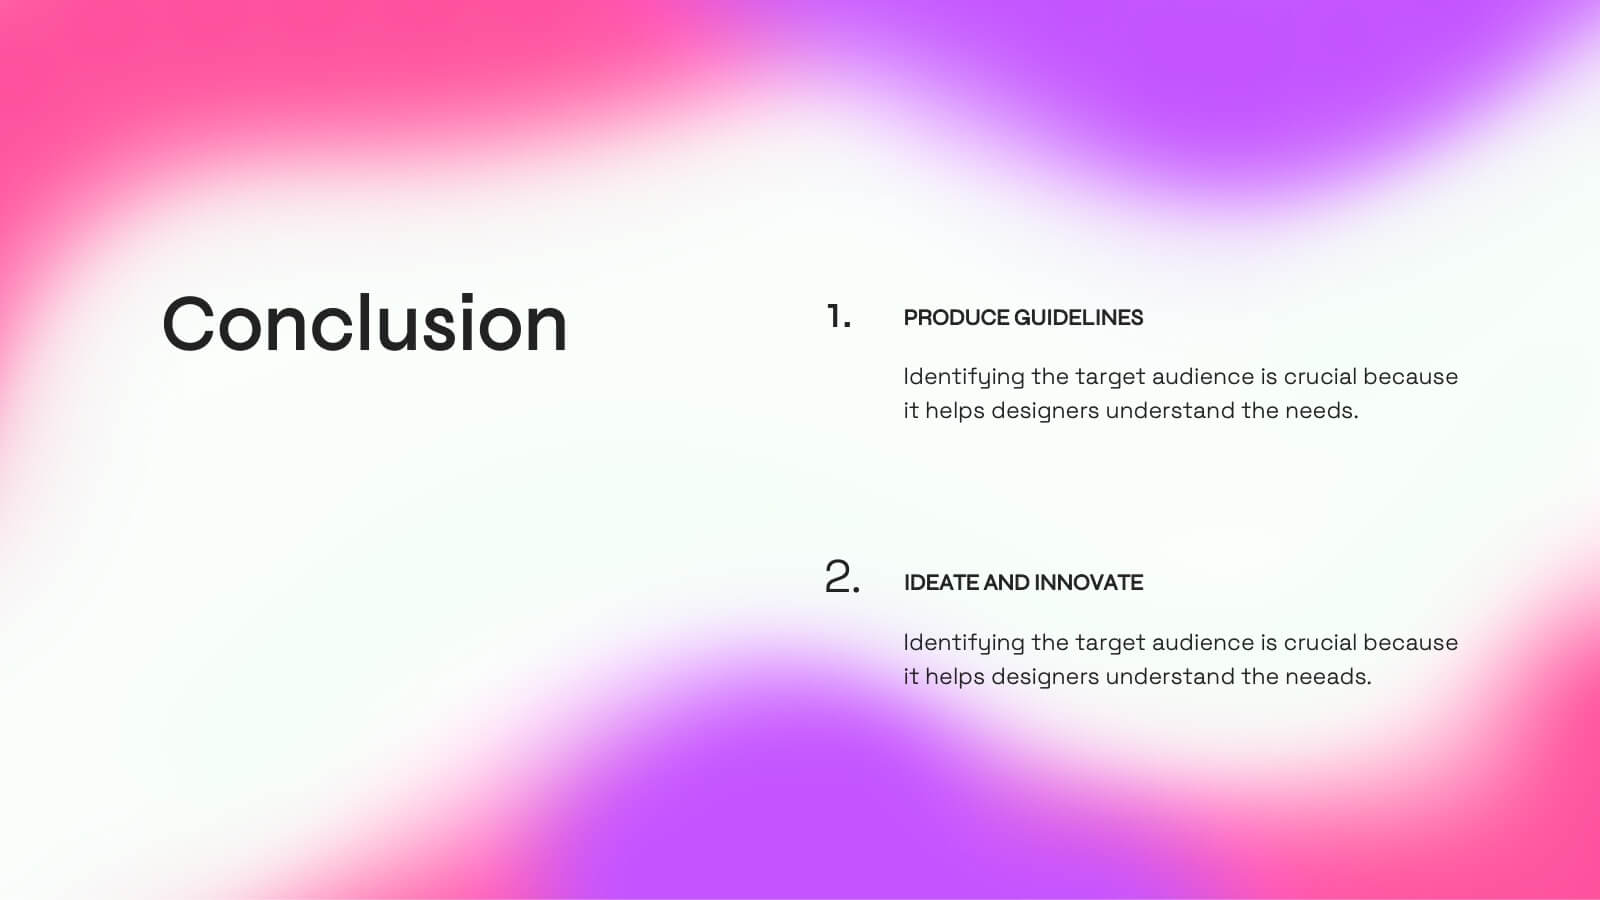
Jade Creative Design Report Presentation
Transform your design report into a captivating visual experience with this elegant jade-themed presentation template! Ideal for showcasing your creative projects, it effectively highlights key concepts, methodologies, and outcomes in a polished format. With its striking design, your work will impress clients and stakeholders alike. Compatible with PowerPoint, Keynote, and Google Slides.


8 slides
3-Layered Circular Logic Presentation
Visualize layered processes with this 3-step circular logic diagram. Perfect for illustrating progressive systems, tiered strategies, or interrelated components. Each ring represents a distinct phase, complete with editable icons and text. Compatible with PowerPoint, Keynote, and Google Slides—ideal for business models, strategic frameworks, or simplified logic breakdowns.


26 slides
Operational Efficiency Tips Purple Presentation
Optimize your team's workflow and showcase your strategies for improved performance with this operational efficiency template. The vibrant purples and dynamic design invite viewers into a world where streamlined processes and clear objectives lead to success. Lay out the steps of your action plan, from the CEO's vision to the team's execution, with a variety of slides designed for clear communication. Charts and diagrams turn complex data into easy-to-follow visuals, while mockups provide a real-world view of your tools and platforms. Tailored for use in popular presentation software, this set of slides is an excellent aid for managers and consultants aiming to present plans that boost productivity and cut down waste. It’s all about making the complex simple and achieving more with less, helping your audience see the path to a leaner and more effective operation.


4 slides
Leadership Training Framework Presentation
Inspire growth and guide your team toward success with this clear and modern presentation layout. Designed to illustrate leadership principles, development stages, and coaching strategies, it helps communicate training goals with professionalism and ease. Fully customizable and compatible with PowerPoint, Keynote, and Google Slides for seamless use across platforms.


6 slides
Root Cause Analysis of Key Problems Presentation
Get to the heart of business issues with this Root Cause Analysis of Key Problems presentation. This template helps you break down complex challenges into actionable components: Who, What, When, Where, Why, and How. Clean, color-coded arrows ensure clarity. Ideal for strategic reviews and process optimization. Fully editable in Canva, PowerPoint, and Google Slides.


6 slides
3D Shapes Infographic
3D shapes, also known as three-dimensional shapes or solids, are geometric figures that have three dimensions: length, width, and height (or depth). This Infographic visually explains various three-dimensional geometric shapes, their properties, and real-world applications. With this template you can summarize the benefits of the 3D Shapes in simplifying the understanding of complex shapes and encouraging practical applications in various fields. This infographic is the perfect study aid for students preparing for geometry exams. This is fully customizable and compatible with Powerpoint, Keynote, and Google Slides.


7 slides
Asia Map Economy Infographic
Delve into the economic landscape of Asia with our series of infographic slides designed to outline key economic indicators across the continent. These templates provide a comprehensive visual representation of various economic data, including GDP growth, trade volumes, and sector-specific performance, making them invaluable for analysts, educators, and business professionals. Each infographic features a detailed map of Asia, annotated with data points and statistics that highlight economic trends and disparities between nations. The use of contrasting colors and clear, legible fonts ensures that the information is accessible and engaging. Graphs and charts are integrated within the map, offering a dynamic overview of the economic health of the region. These templates are fully customizable, allowing you to tailor the content to specific presentations or reports. Whether used in academic environments, corporate settings, or public presentations, these slides help to communicate complex economic concepts in a visually appealing and straightforward manner.


6 slides
Numbered Steps Diagram Presentation
Watch your workflow come to life as each step rises in a clean, structured path that makes progress easy to follow. This presentation guides audiences through sequential actions with clarity, helping simplify processes, plans, or instructions. Perfect for business, training, or project teams. Fully compatible with PowerPoint, Keynote, and Google Slides.


7 slides
Africa Colonization Map Infographic
Embark on a historical exploration with our meticulously designed Africa colonization map infographic. Colored with the earthy green, the profound blue, the intense red, and the radiant yellow, our template serves as a vivid chronicle of Africa's colonial past. Detailed with sharp infographics, emblematic icons, and region-specific image placeholders, it provides a comprehensive overview of colonial footprints across the continent. Expertly adapted for Powerpoint, Keynote, or Google Slides. An invaluable tool for historians, educators, or anyone delving into the complex colonial history of Africa. Traverse with understanding; let each slide unveil a chapter of Africa's storied past.


6 slides
McKinsey 7S Advantage Infographic
The McKinsey 7S model is a strategic management framework developed by consulting firm McKinsey & Company in the 1980s. This infographic template helps explain and understand the McKinsey 7S framework, a widely used management model for organizational effectiveness. This template provides an informative overview of the seven key elements of the framework, their interrelationships, and their impact on organizational performance. This template is designed for professionals, consultants, or anyone interested in understanding and applying the McKinsey 7S framework. Fully customizable and compatible with Powerpoint, Keynote, and Google Slides.


4 slides
Business Challenge Overview Presentation
Kick off your message with a dynamic overview that makes complex challenges feel clear, visual, and manageable. This presentation helps you break down obstacles, compare factors, and guide teams toward smarter decisions with an organized, flowing layout. Fully compatible with PowerPoint, Keynote, and Google Slides.


7 slides
Communication Styles Infographic
Dive into the diverse world of communication with our communication styles infographic. Set against a palette of blue, yellow, and white, this template offers a visual exploration of different communication methods and their nuances. Whether it's assertive, passive, aggressive, or passive-aggressive, understanding these styles is vital in both personal and professional settings. Ideal for corporate trainers, educators, students, or anyone aiming to improve their interpersonal skills. Crafted for clarity and compatibility, this infographic is an excellent addition to PowerPoint, Keynote, and Google Slides, ensuring your presentations resonate with both substance and style.


2 slides
Breast Cancer Awareness Infographics Presentation
Empower your message with a bold, meaningful design that spreads awareness and inspires action. This impactful layout uses visual balance and clear data points to highlight key statistics, health information, or campaign goals. Fully editable and compatible with PowerPoint, Keynote, and Google Slides for effortless customization and professional presentations.