


Features
- 6 Unique slides
- Fully editable and easy to edit in Microsoft Powerpoint, Keynote and Google Slides
- 16:9 widescreen layout
- Clean and professional designs
- Export to JPG, PDF or send by email


Do you have any questions?
Recommend


5 slides
Messaging Strategy and Flow Presentation
Communicate with clarity using this streamlined messaging strategy and flow presentation template. Designed to visualize the stages of message planning—from audience segmentation to final delivery—this layout helps teams align communication goals and channels. Ideal for marketing, PR, or internal comms presentations. Fully compatible with PowerPoint, Keynote, and Google Slides.


7 slides
Asia Map Overview Infographic
Dive into the vast and varied landscape of Asia with our collection of infographic slides designed to provide an insightful overview of the continent. These templates are ideal for educators, business professionals, and researchers looking to present data on Asia’s geography, demographics, economic status, and more. Each slide is meticulously crafted to display information clearly and attractively, using maps, charts, and icons to represent statistical data and trends across Asia. The different shades and colors used in the maps distinguish between countries, regions, or data points, making it easy for audiences to grasp complex information at a glance. These templates are fully customizable, enabling you to highlight specific areas or data according to your presentation needs. Whether discussing population growth, economic development, or environmental concerns, these slides are an excellent resource for conveying detailed information in a visually engaging format.


10 slides
Water Resource Management Presentation
Present your strategy with this clean and modern Water Resource Management slide. Featuring droplet graphics and percentage visuals, it's ideal for showcasing water usage, sustainability goals, or conservation data. Easily customizable with titles, icons, and insights. Compatible with PowerPoint, Keynote, and Google Slides for seamless editing.


6 slides
Cash Management Strategy Presentation
Break down your financial priorities with a bold, visual approach. This cash management slide uses a segmented dollar symbol to represent key areas like budgeting, reserves, expenses, and more—making it easy to track strategy points at a glance. Ideal for finance teams, planning sessions, or investor decks. Compatible with PowerPoint, Keynote, and Google Slides.


8 slides
Effective Learning Techniques Presentation
Optimize learning strategies with the Effective Learning Techniques Presentation template. This dynamic and structured design helps illustrate key educational approaches, training methods, and cognitive learning strategies. Perfect for educators, trainers, and instructional designers, this fully editable template ensures clarity and engagement. Compatible with PowerPoint, Keynote, and Google Slides for seamless integration into your presentations.


10 slides
Business Planning and Risk Assessment Presentation
Visualize risk levels and strategic priorities with this matrix-style business planning template. Ideal for mapping uncertainties against impact and likelihood, it supports clear, data-driven decisions. Fully customizable in PowerPoint, Keynote, and Google Slides—perfect for risk reports, operational planning, and stakeholder communication in corporate, finance, or project management settings.


5 slides
Social Distancing and Workplace Safety Presentation
Promote safety in the workplace with this modern and approachable slide layout. Designed around a central illustration of a masked employee at a desk, the slide includes four surrounding text areas with icons to highlight policies, procedures, or key reminders. Perfect for health protocols, return-to-office plans, or HR briefings. Fully editable in PowerPoint, Keynote, and Google Slides.


21 slides
Talestra Startup Pitch Deck Presentation
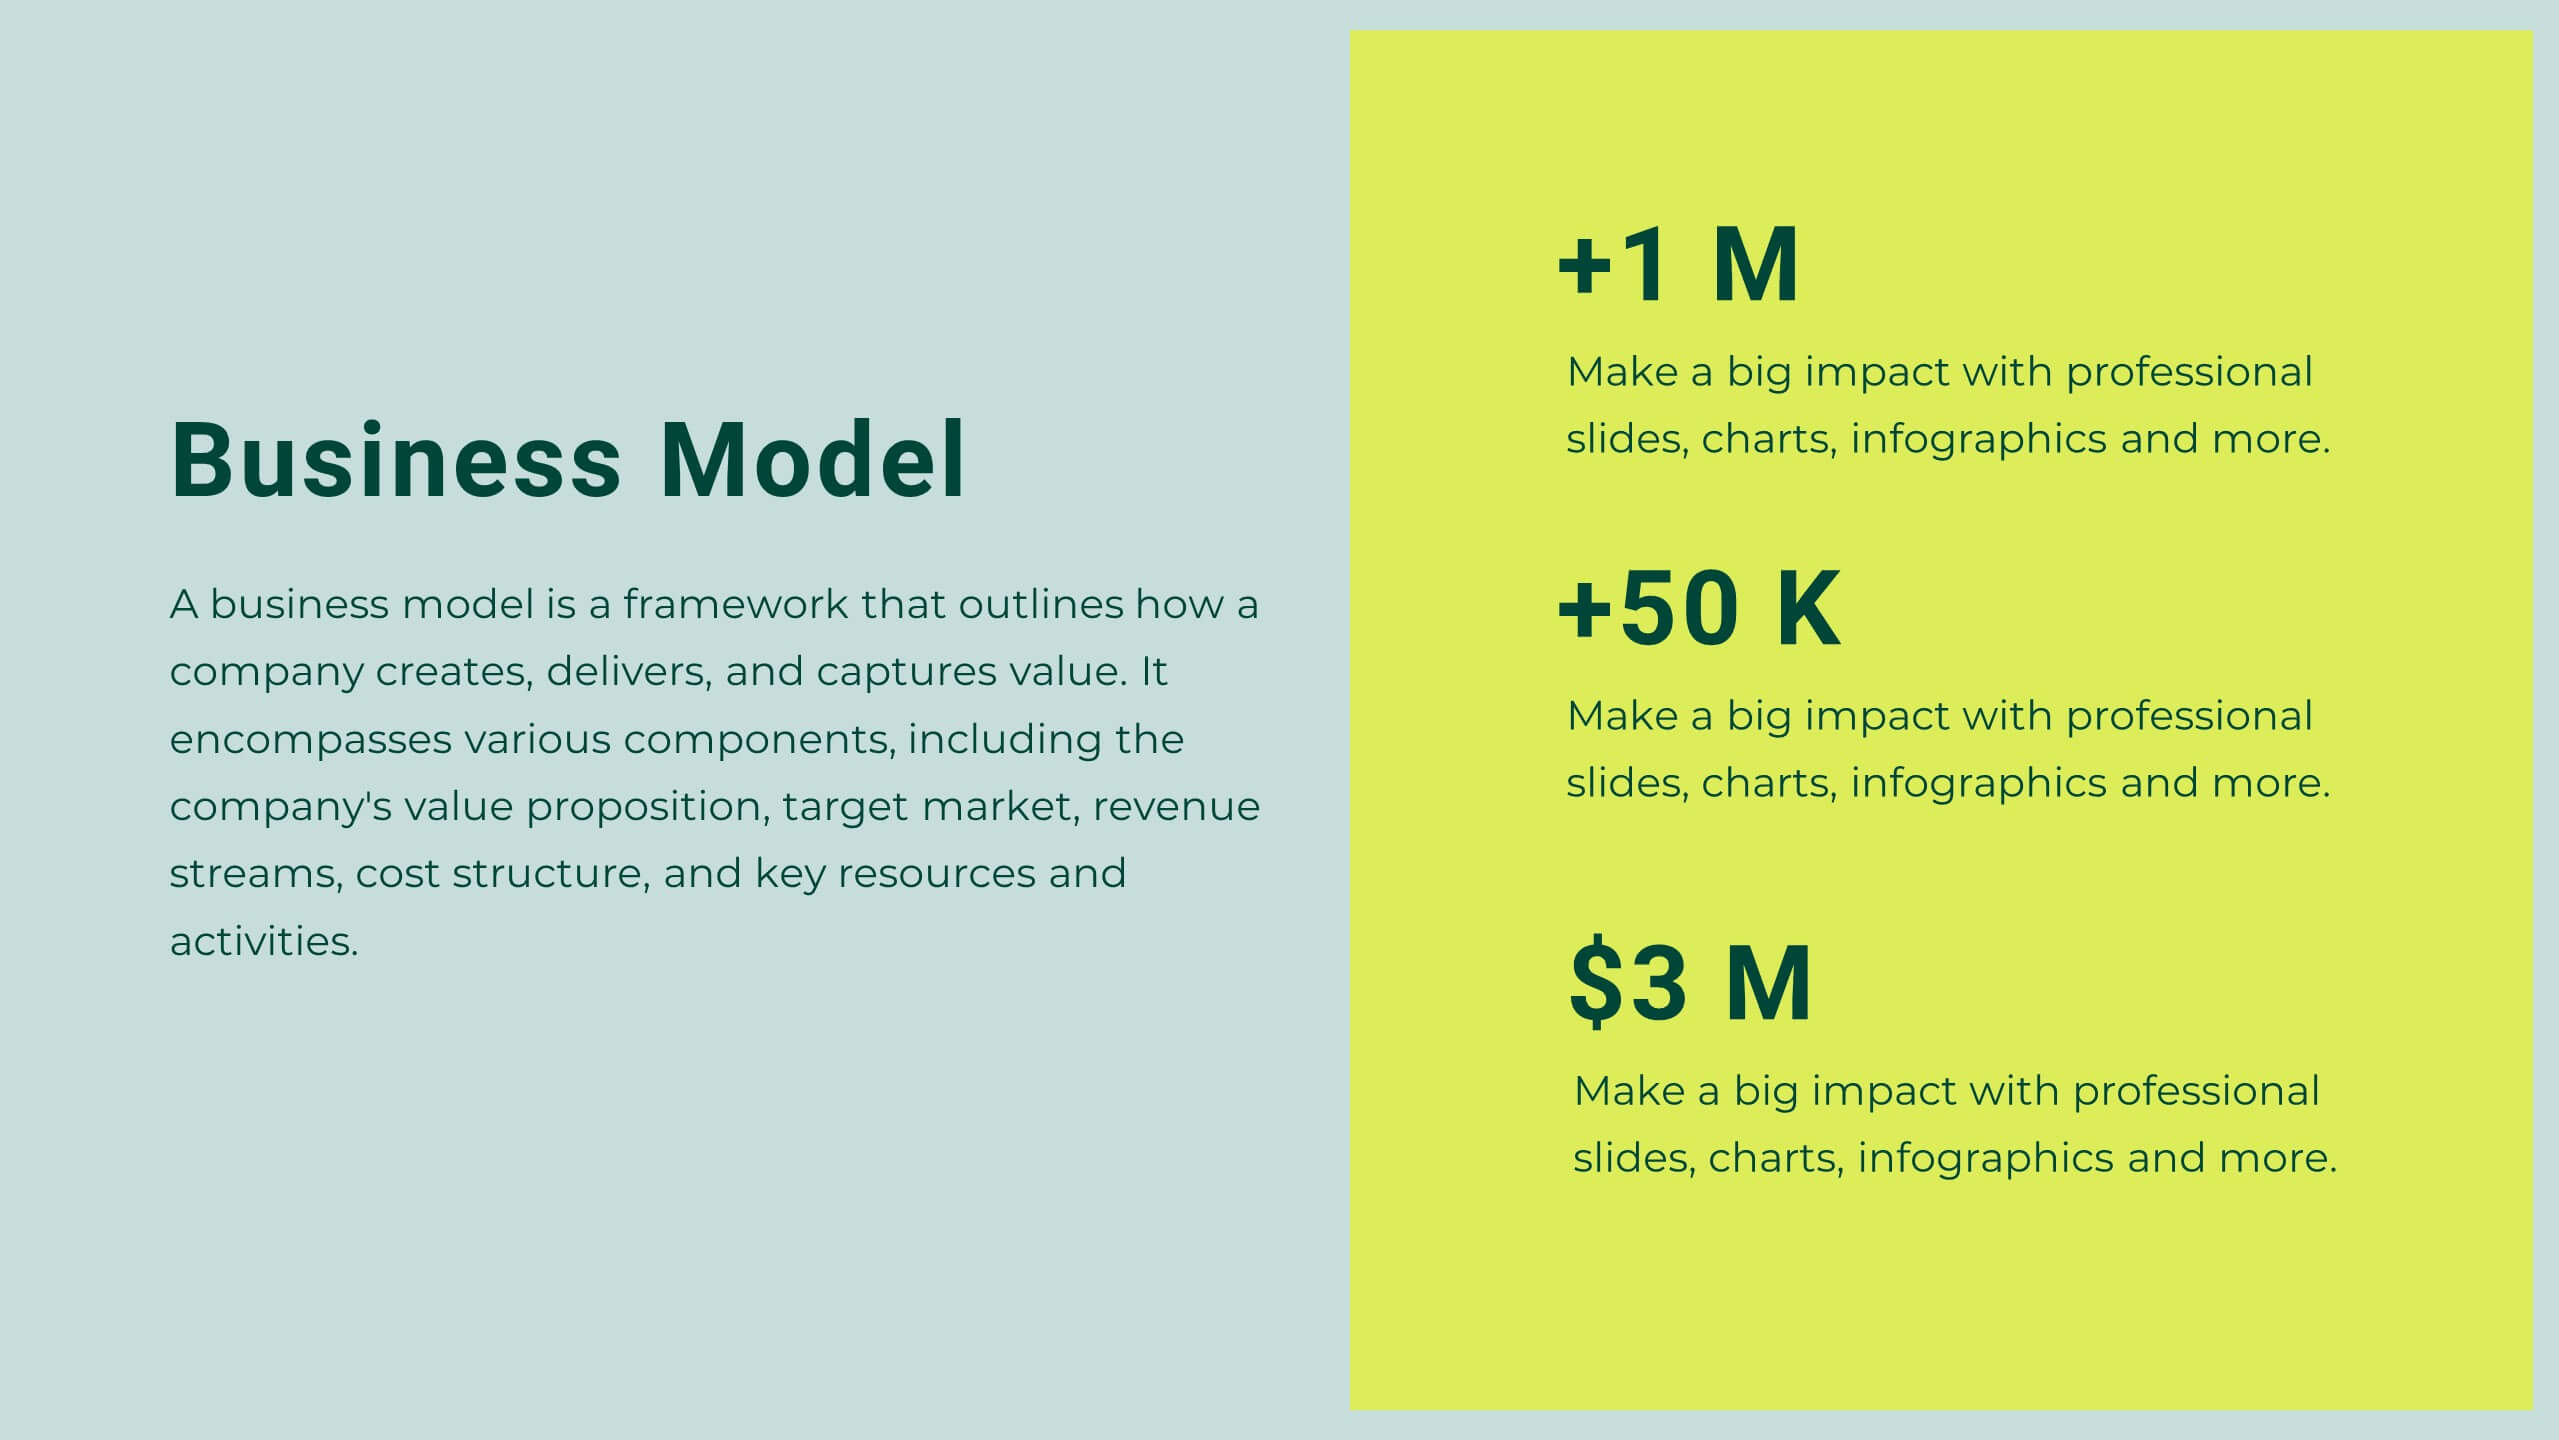
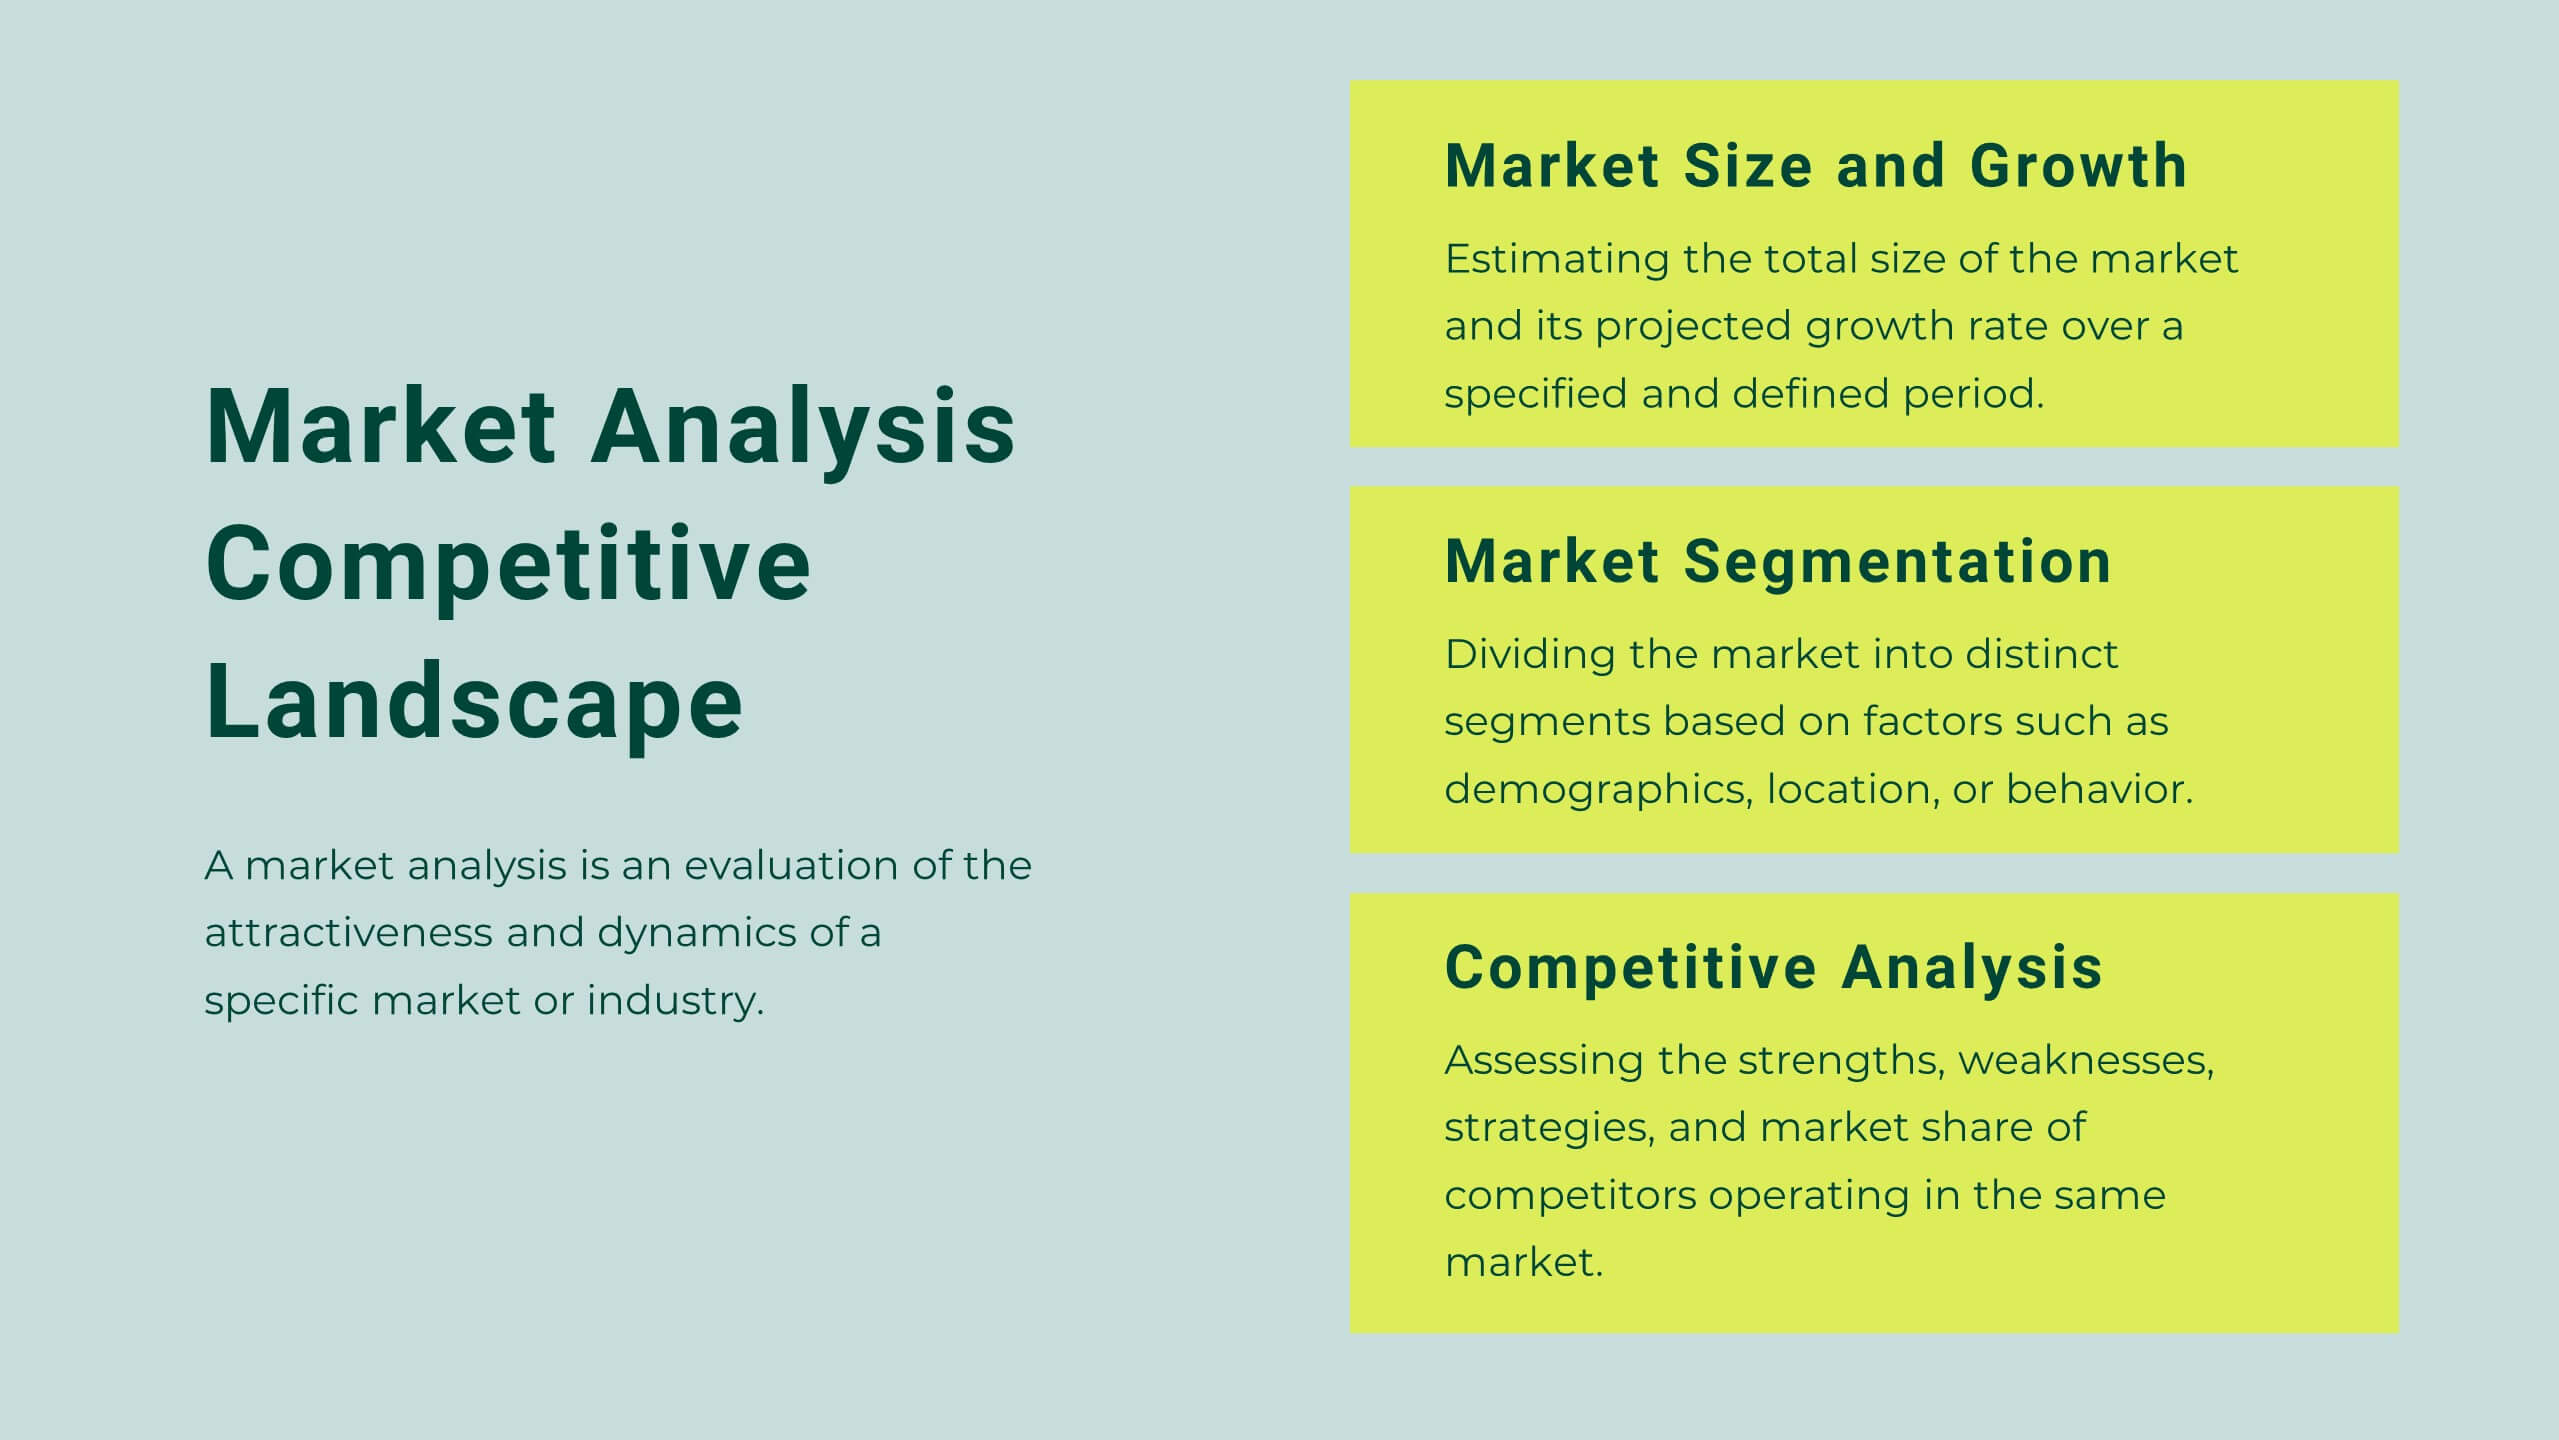
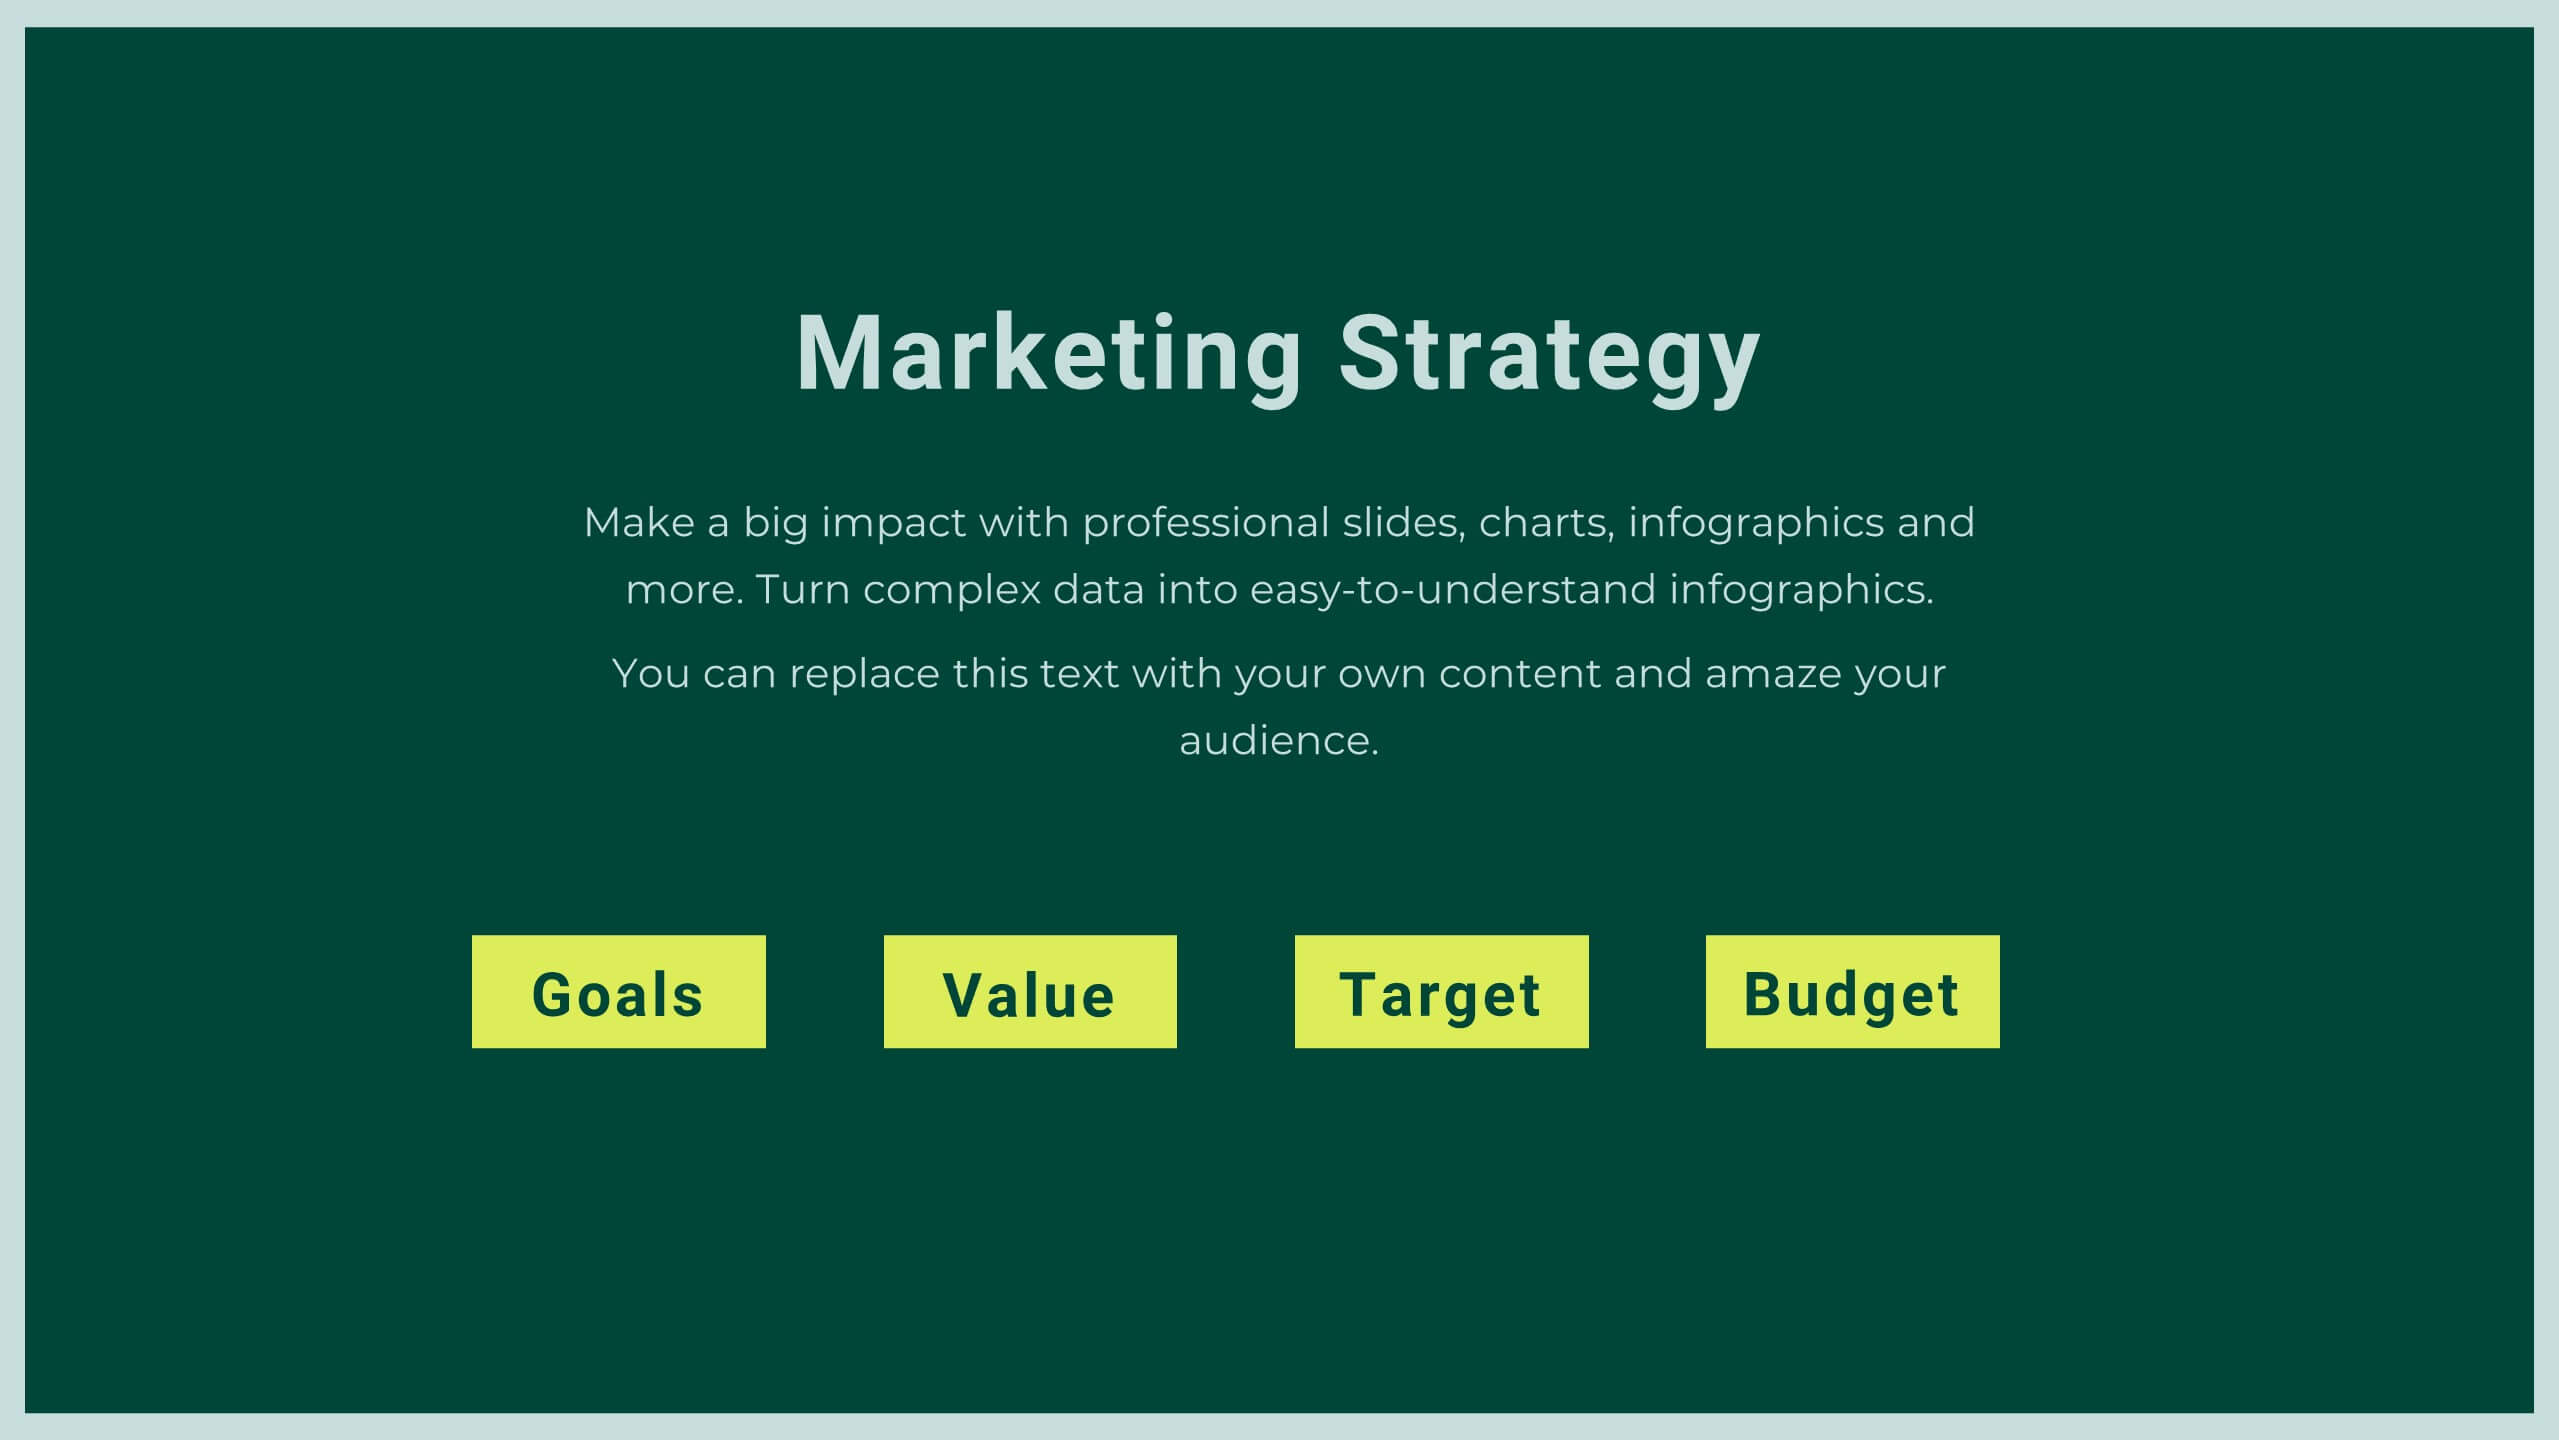
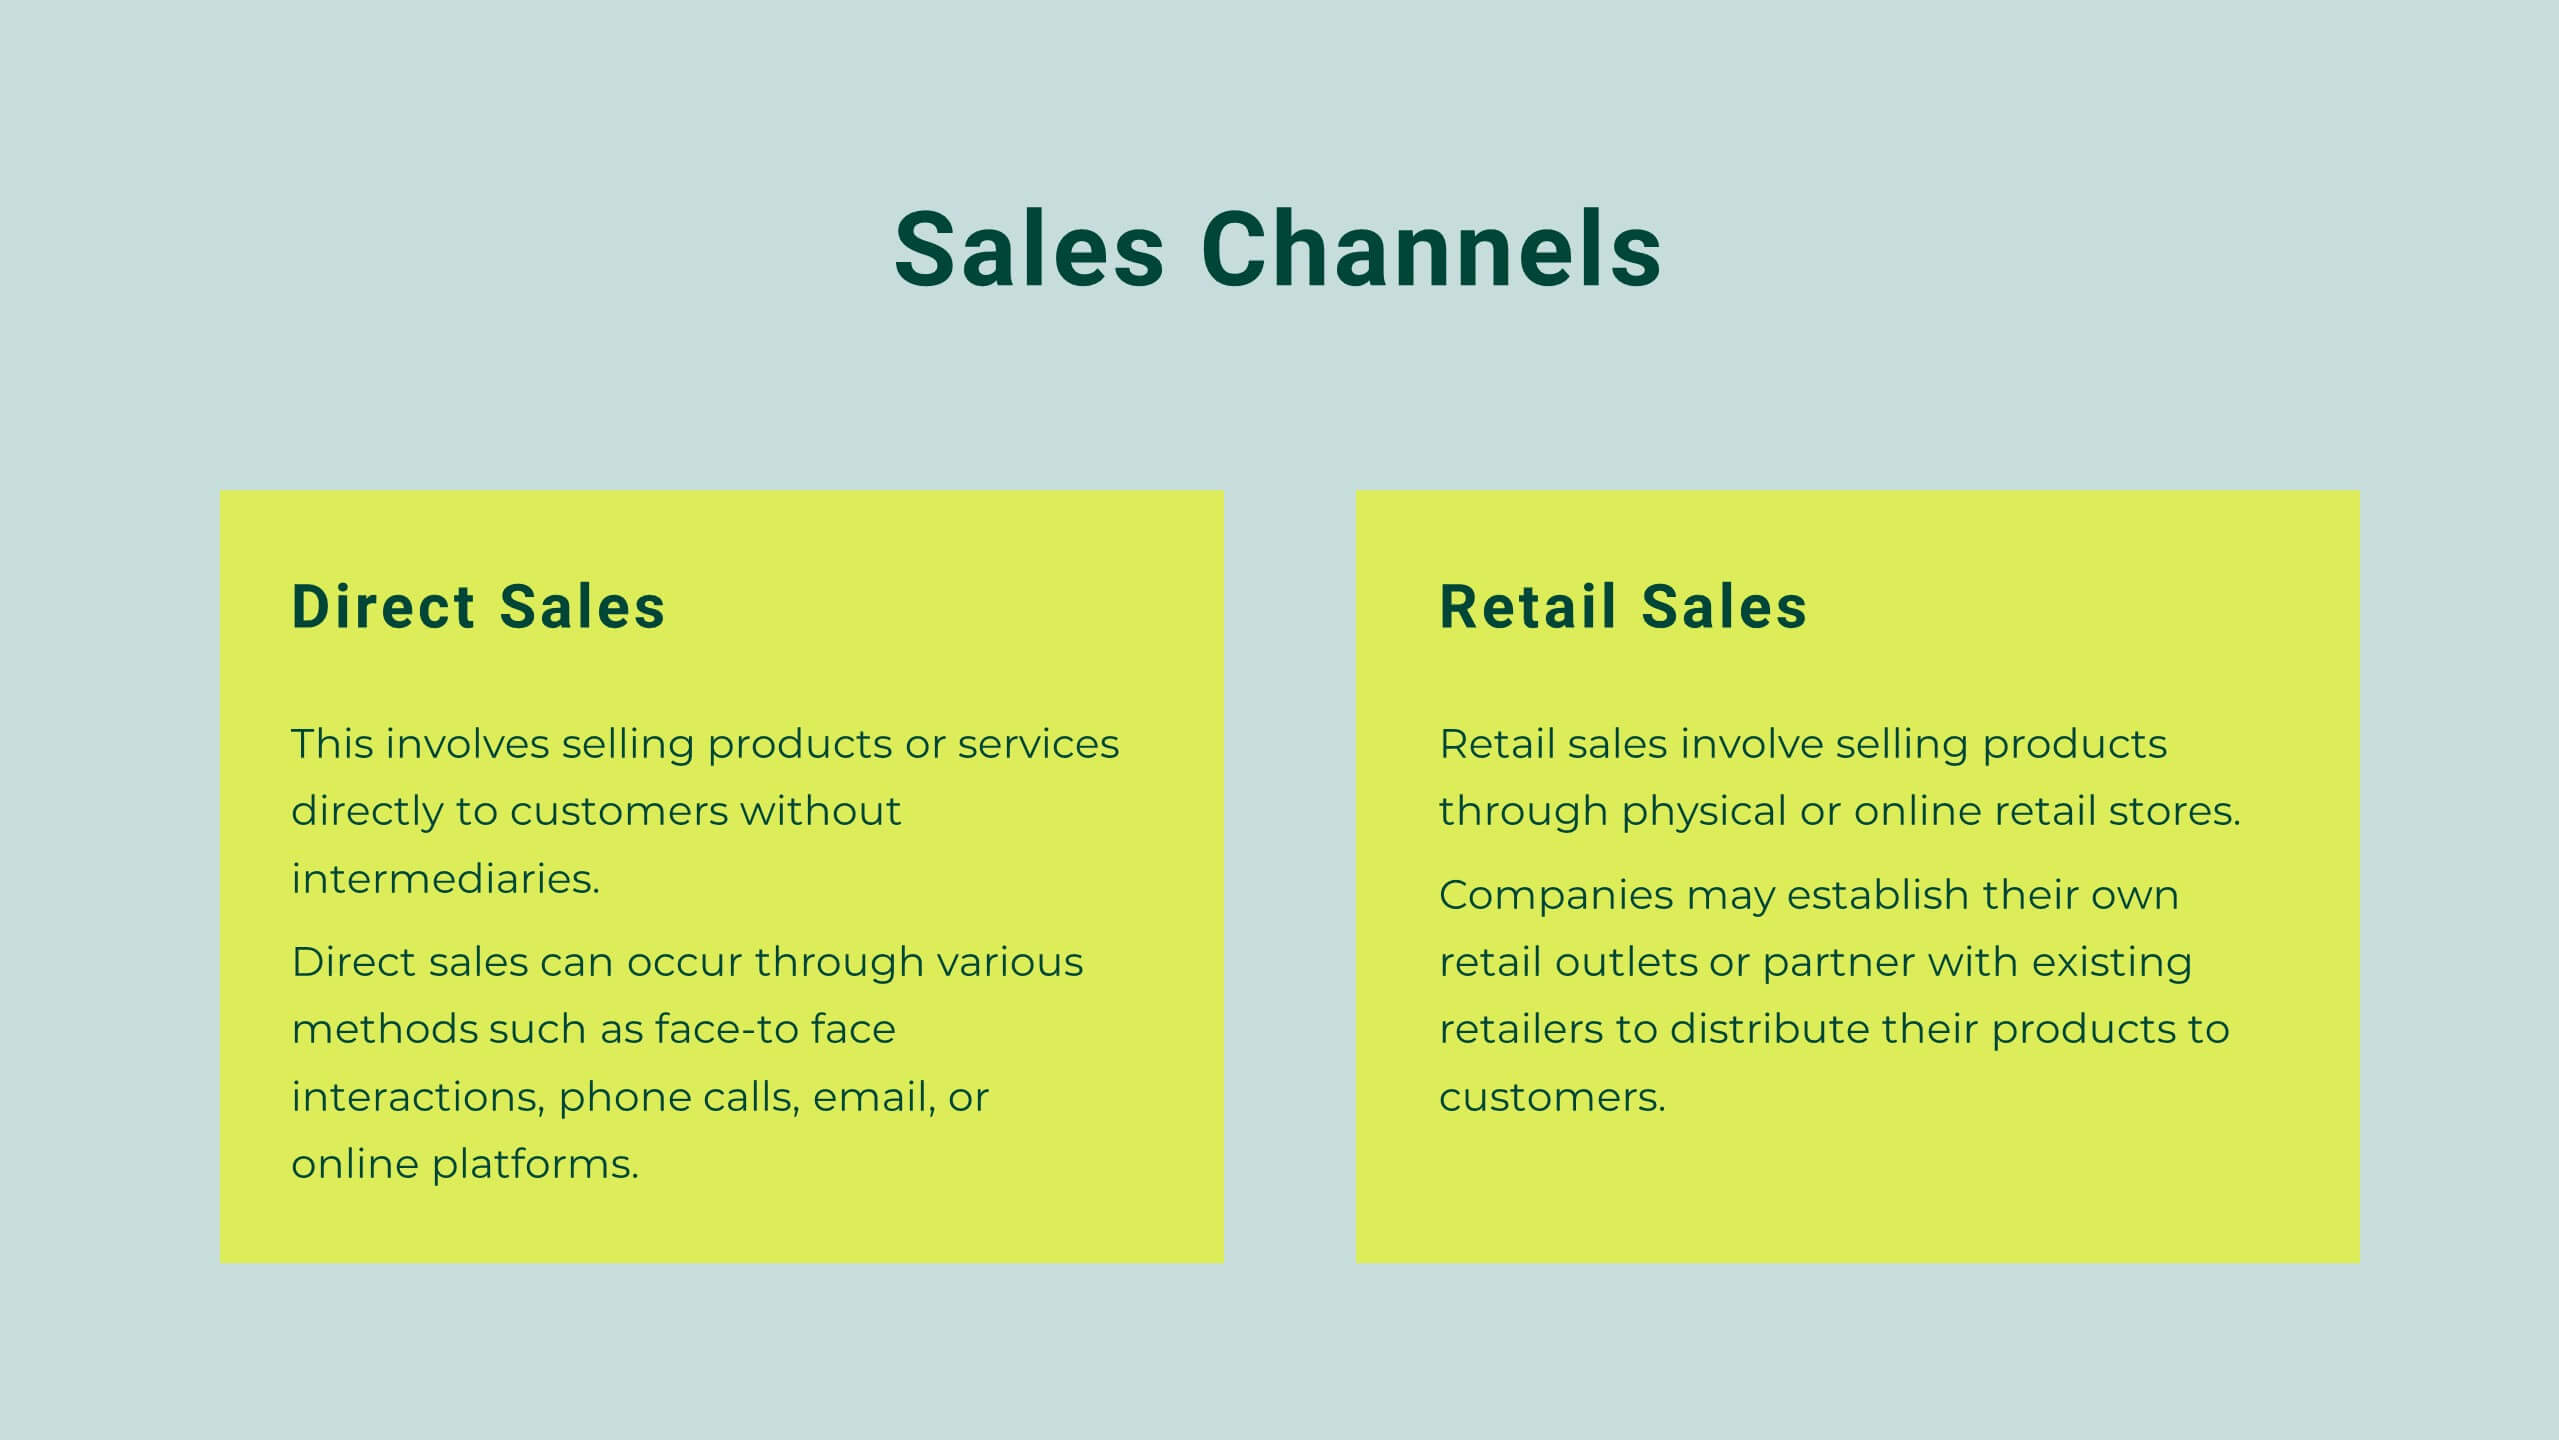
Make a strong first impression with this clean and modern startup pitch deck. Covering key areas such as mission and vision, market analysis, business model, growth plan, and financial overview, it's designed to captivate investors and stakeholders. Fully customizable and compatible with PowerPoint, Keynote, and Google Slides.


6 slides
Platform-Specific Social Strategy Presentation
Break down your marketing approach by channel using this clear, platform-focused timeline. Highlight strategies for TikTok, Facebook, Instagram, X, and email in a linear, easy-to-read format. Ideal for digital marketers, content teams, and social media managers. Fully editable in PowerPoint, Keynote, and Google Slides to match your brand and strategy.


21 slides
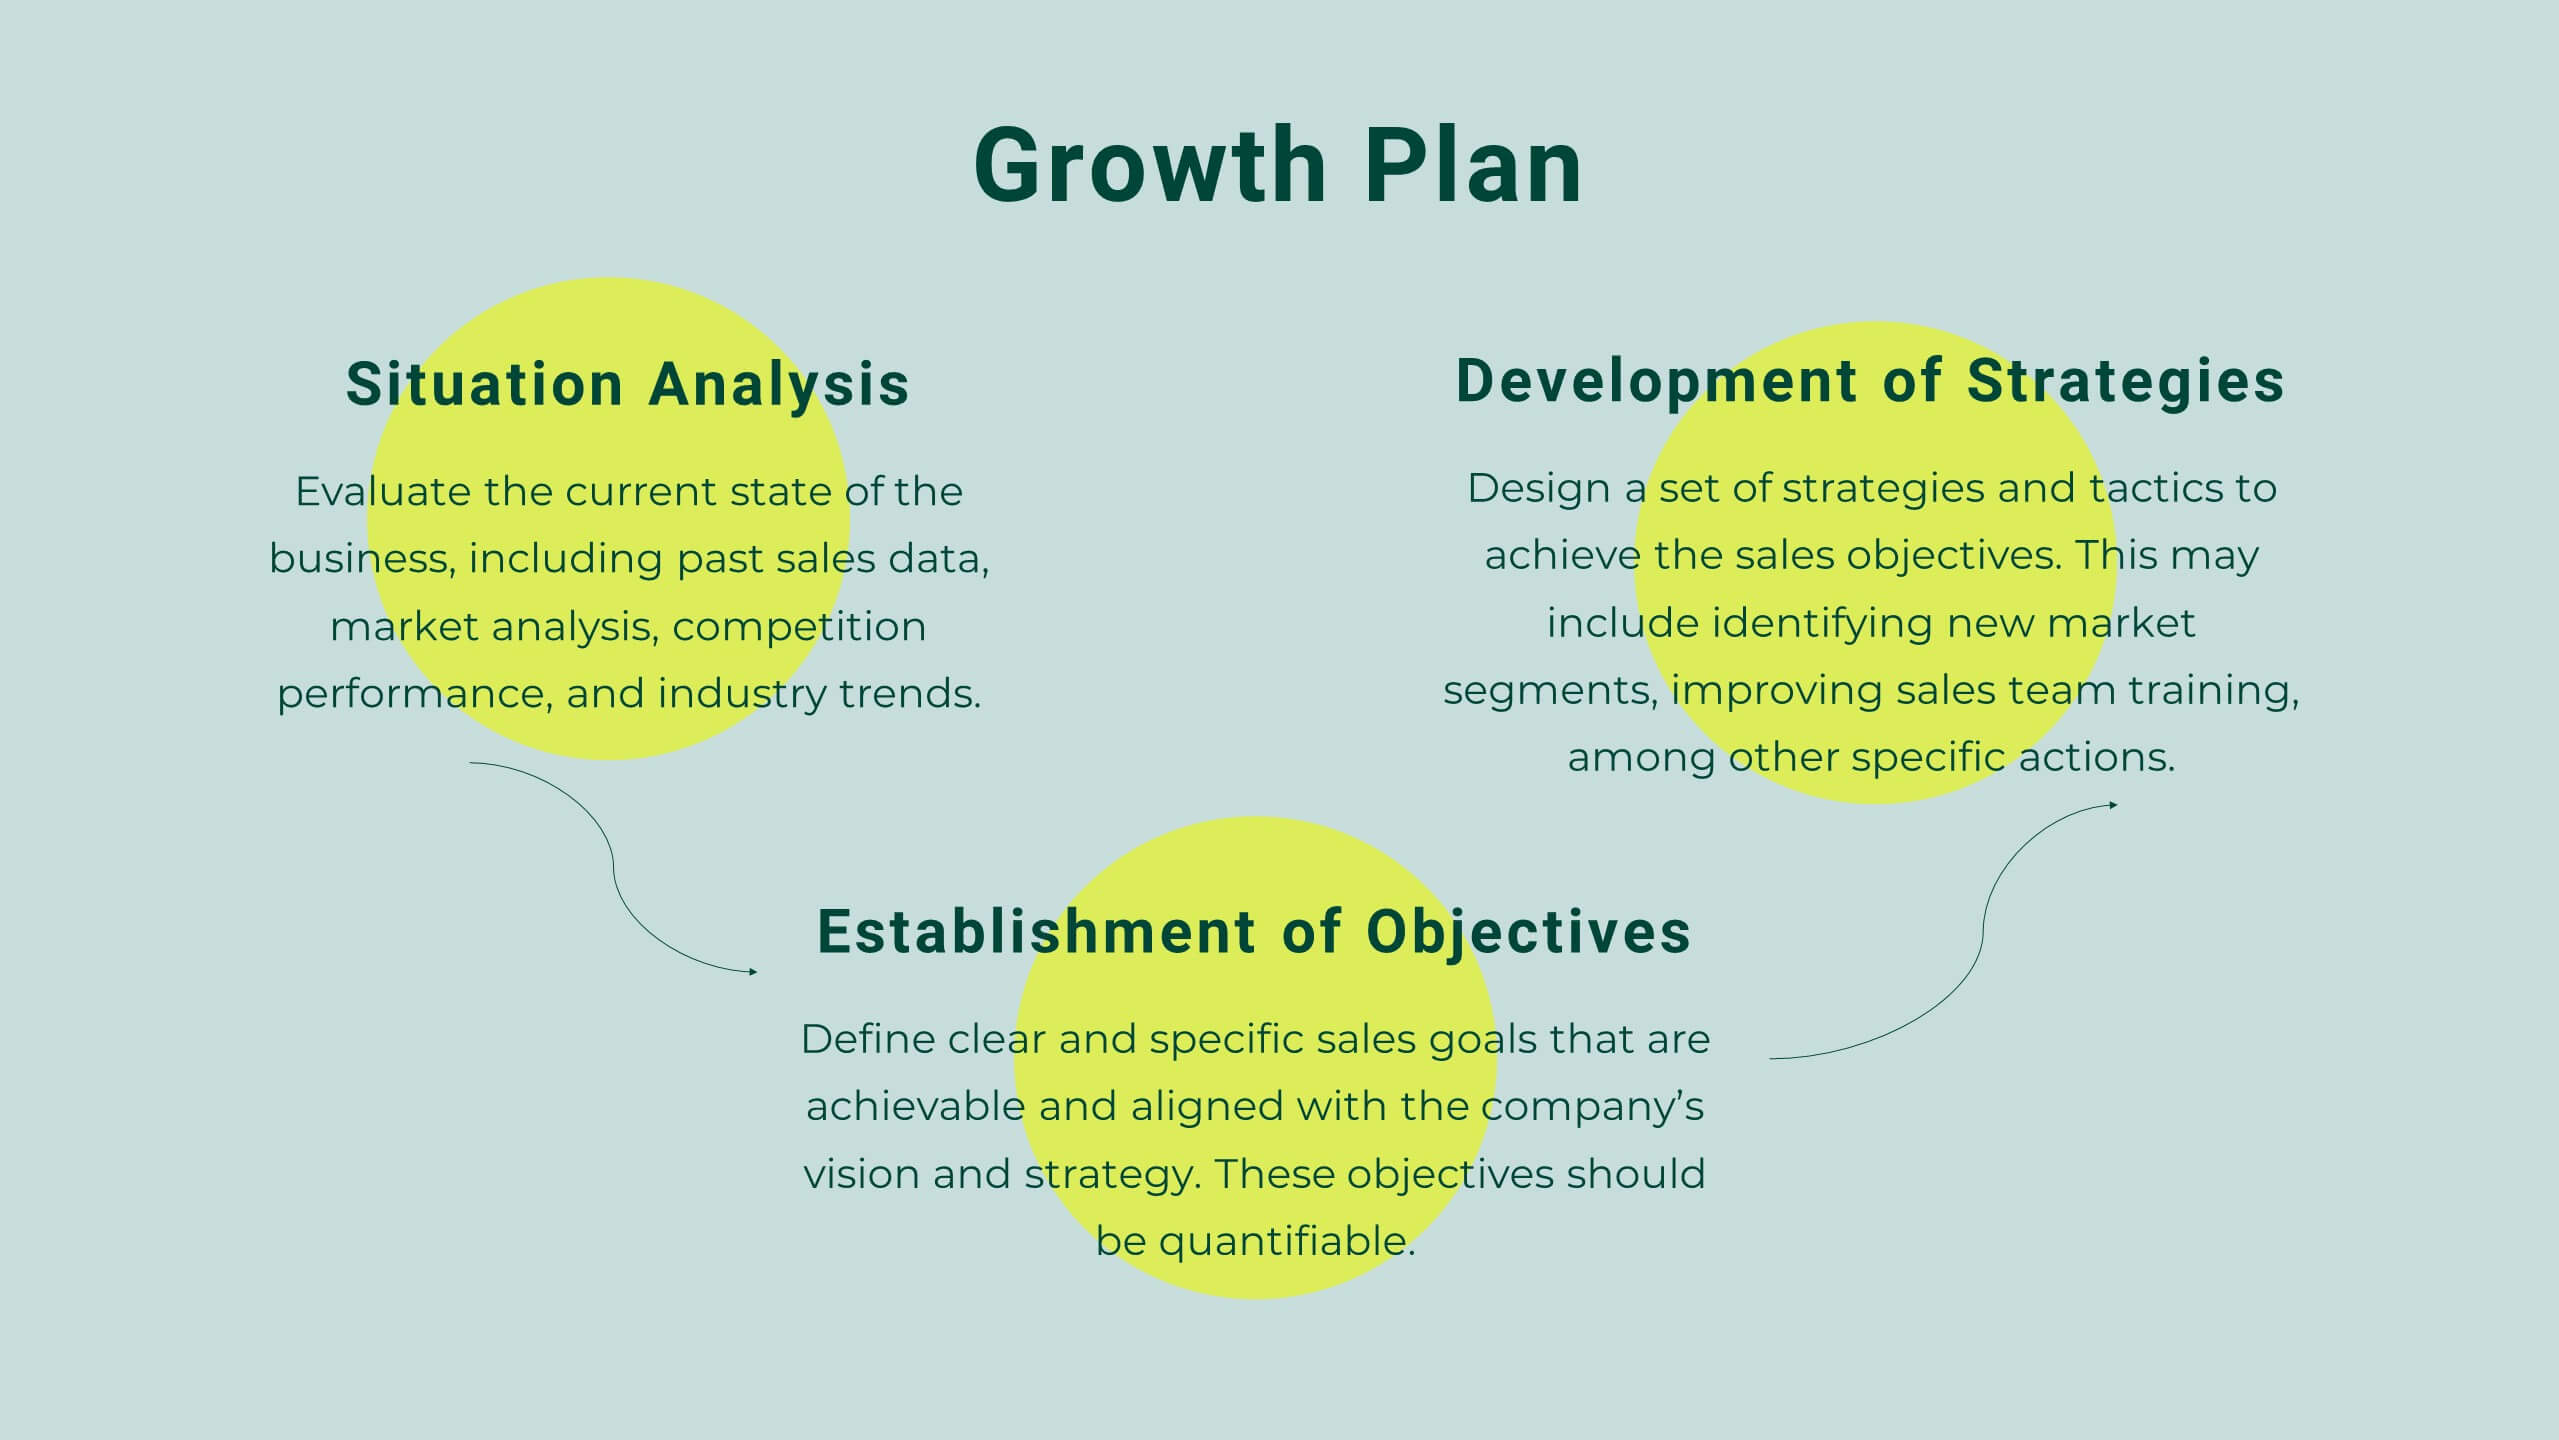
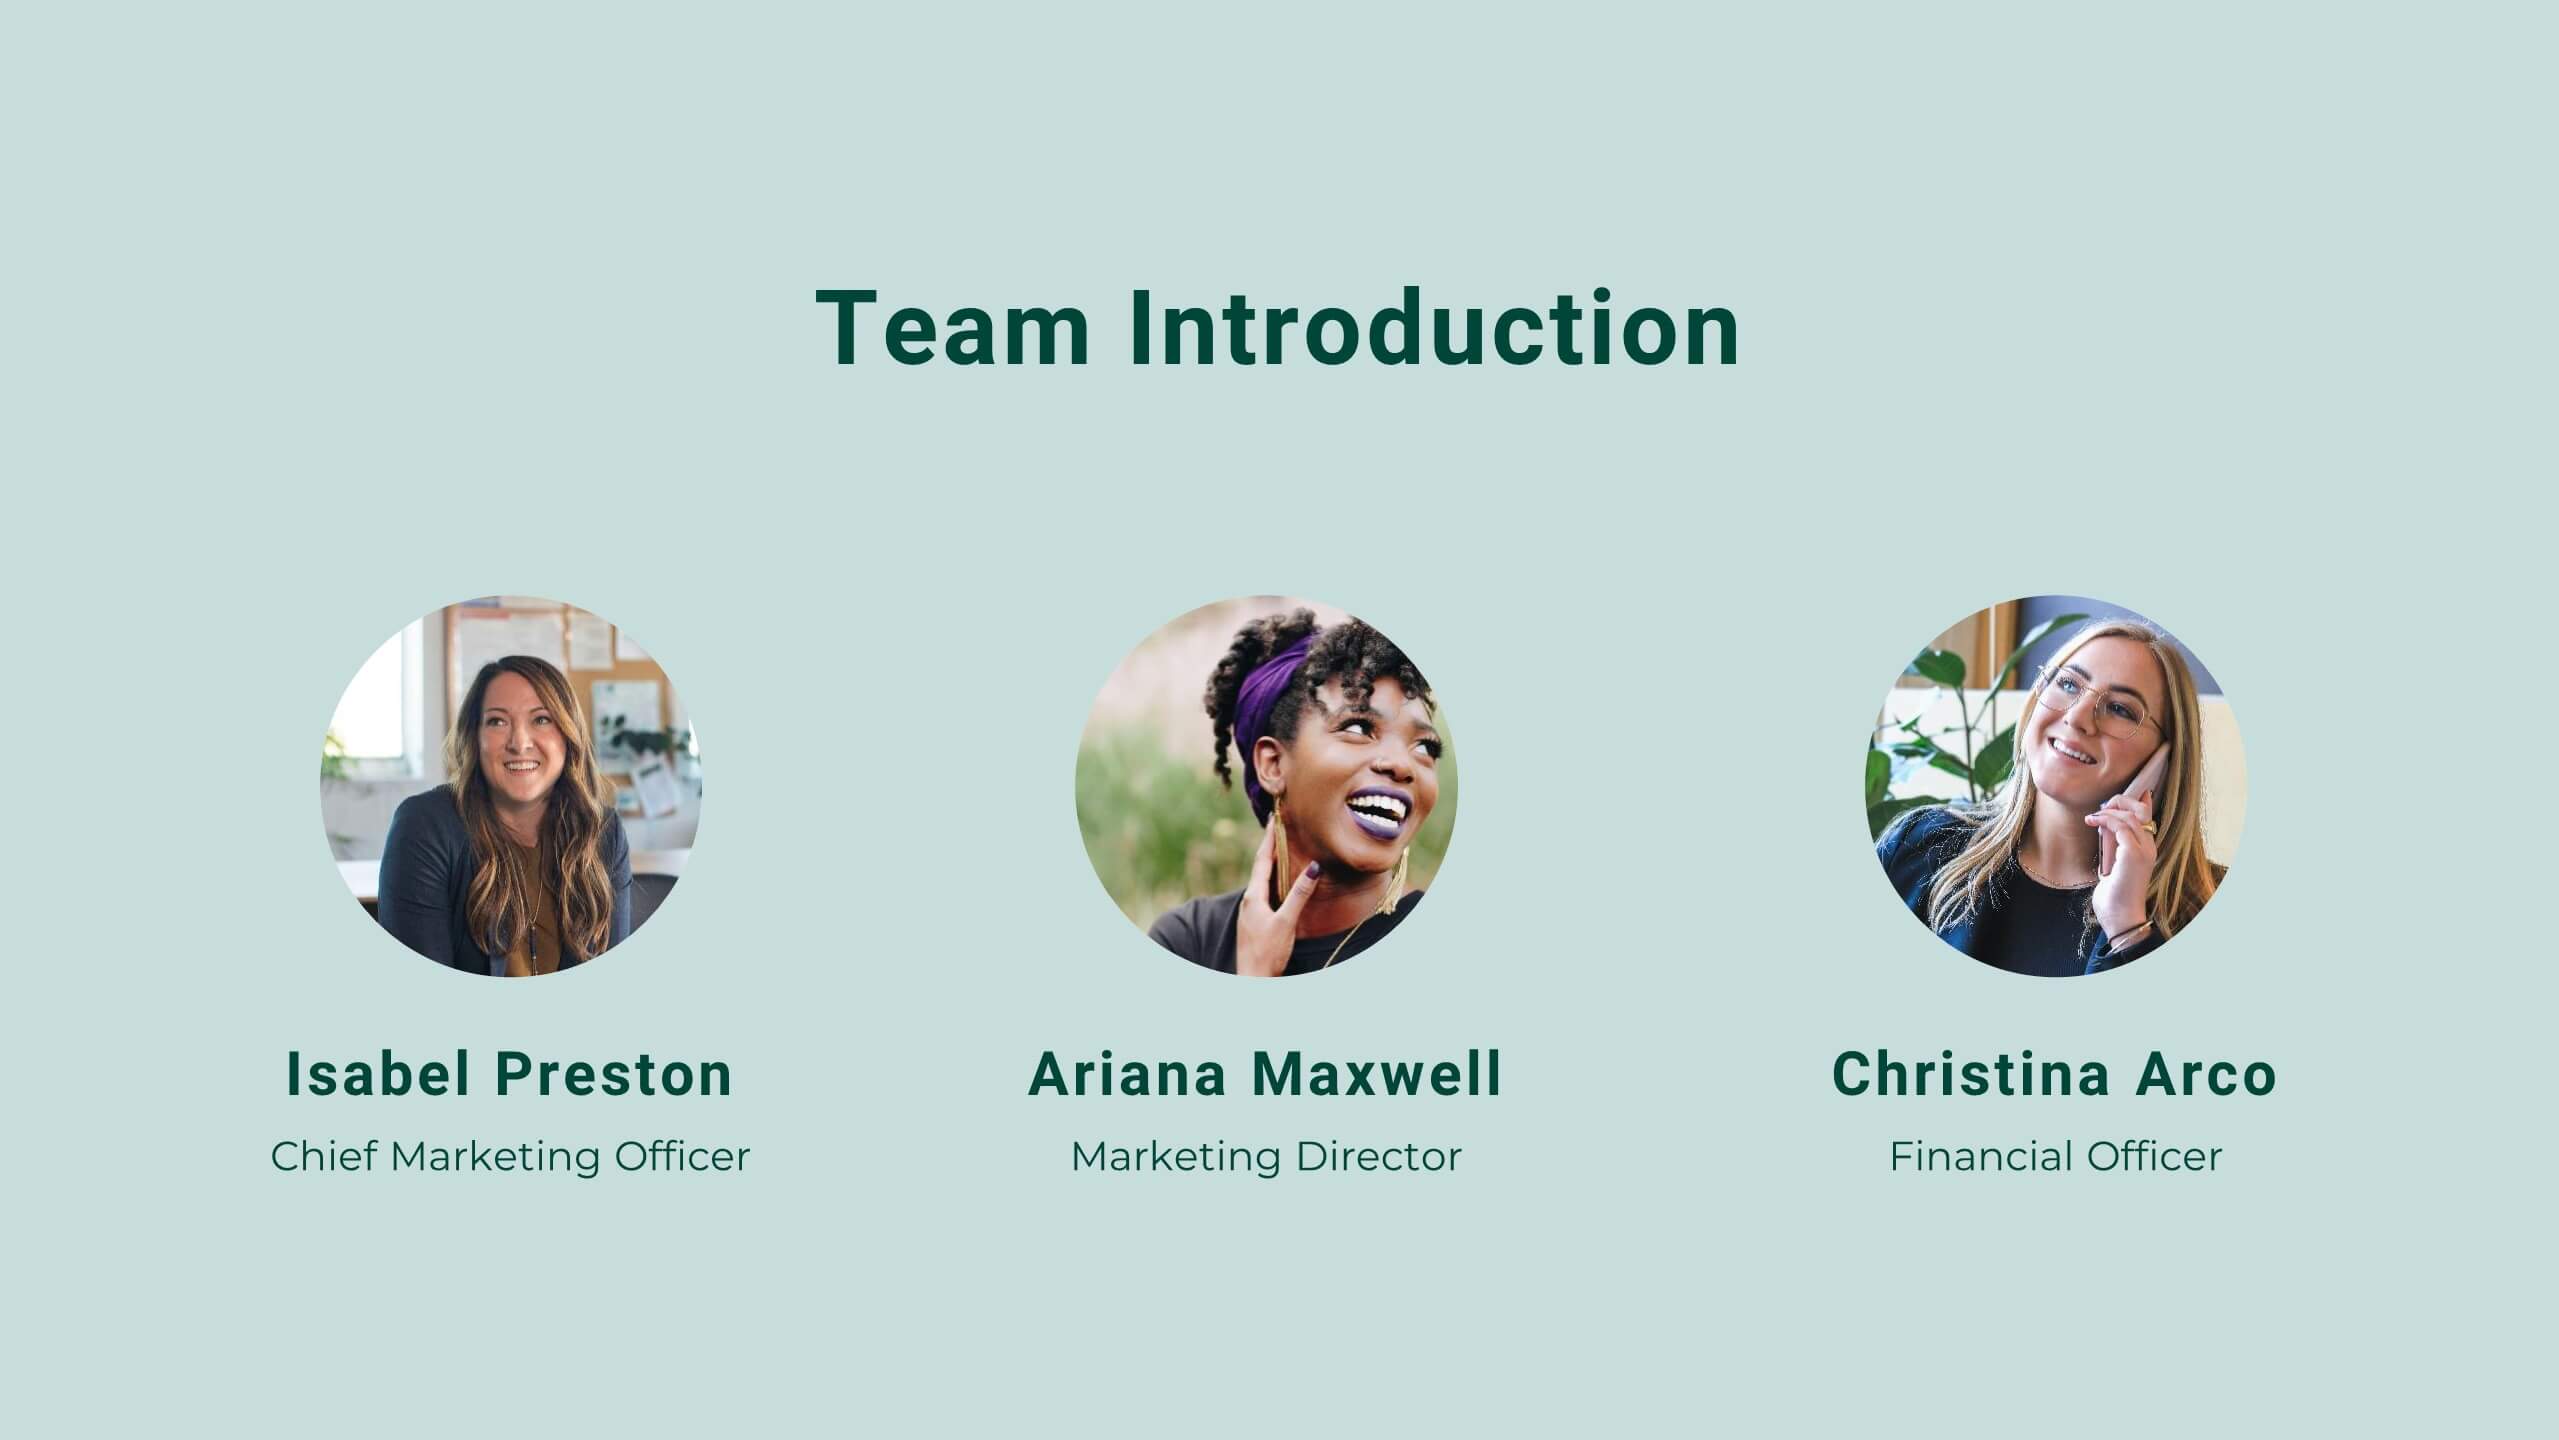
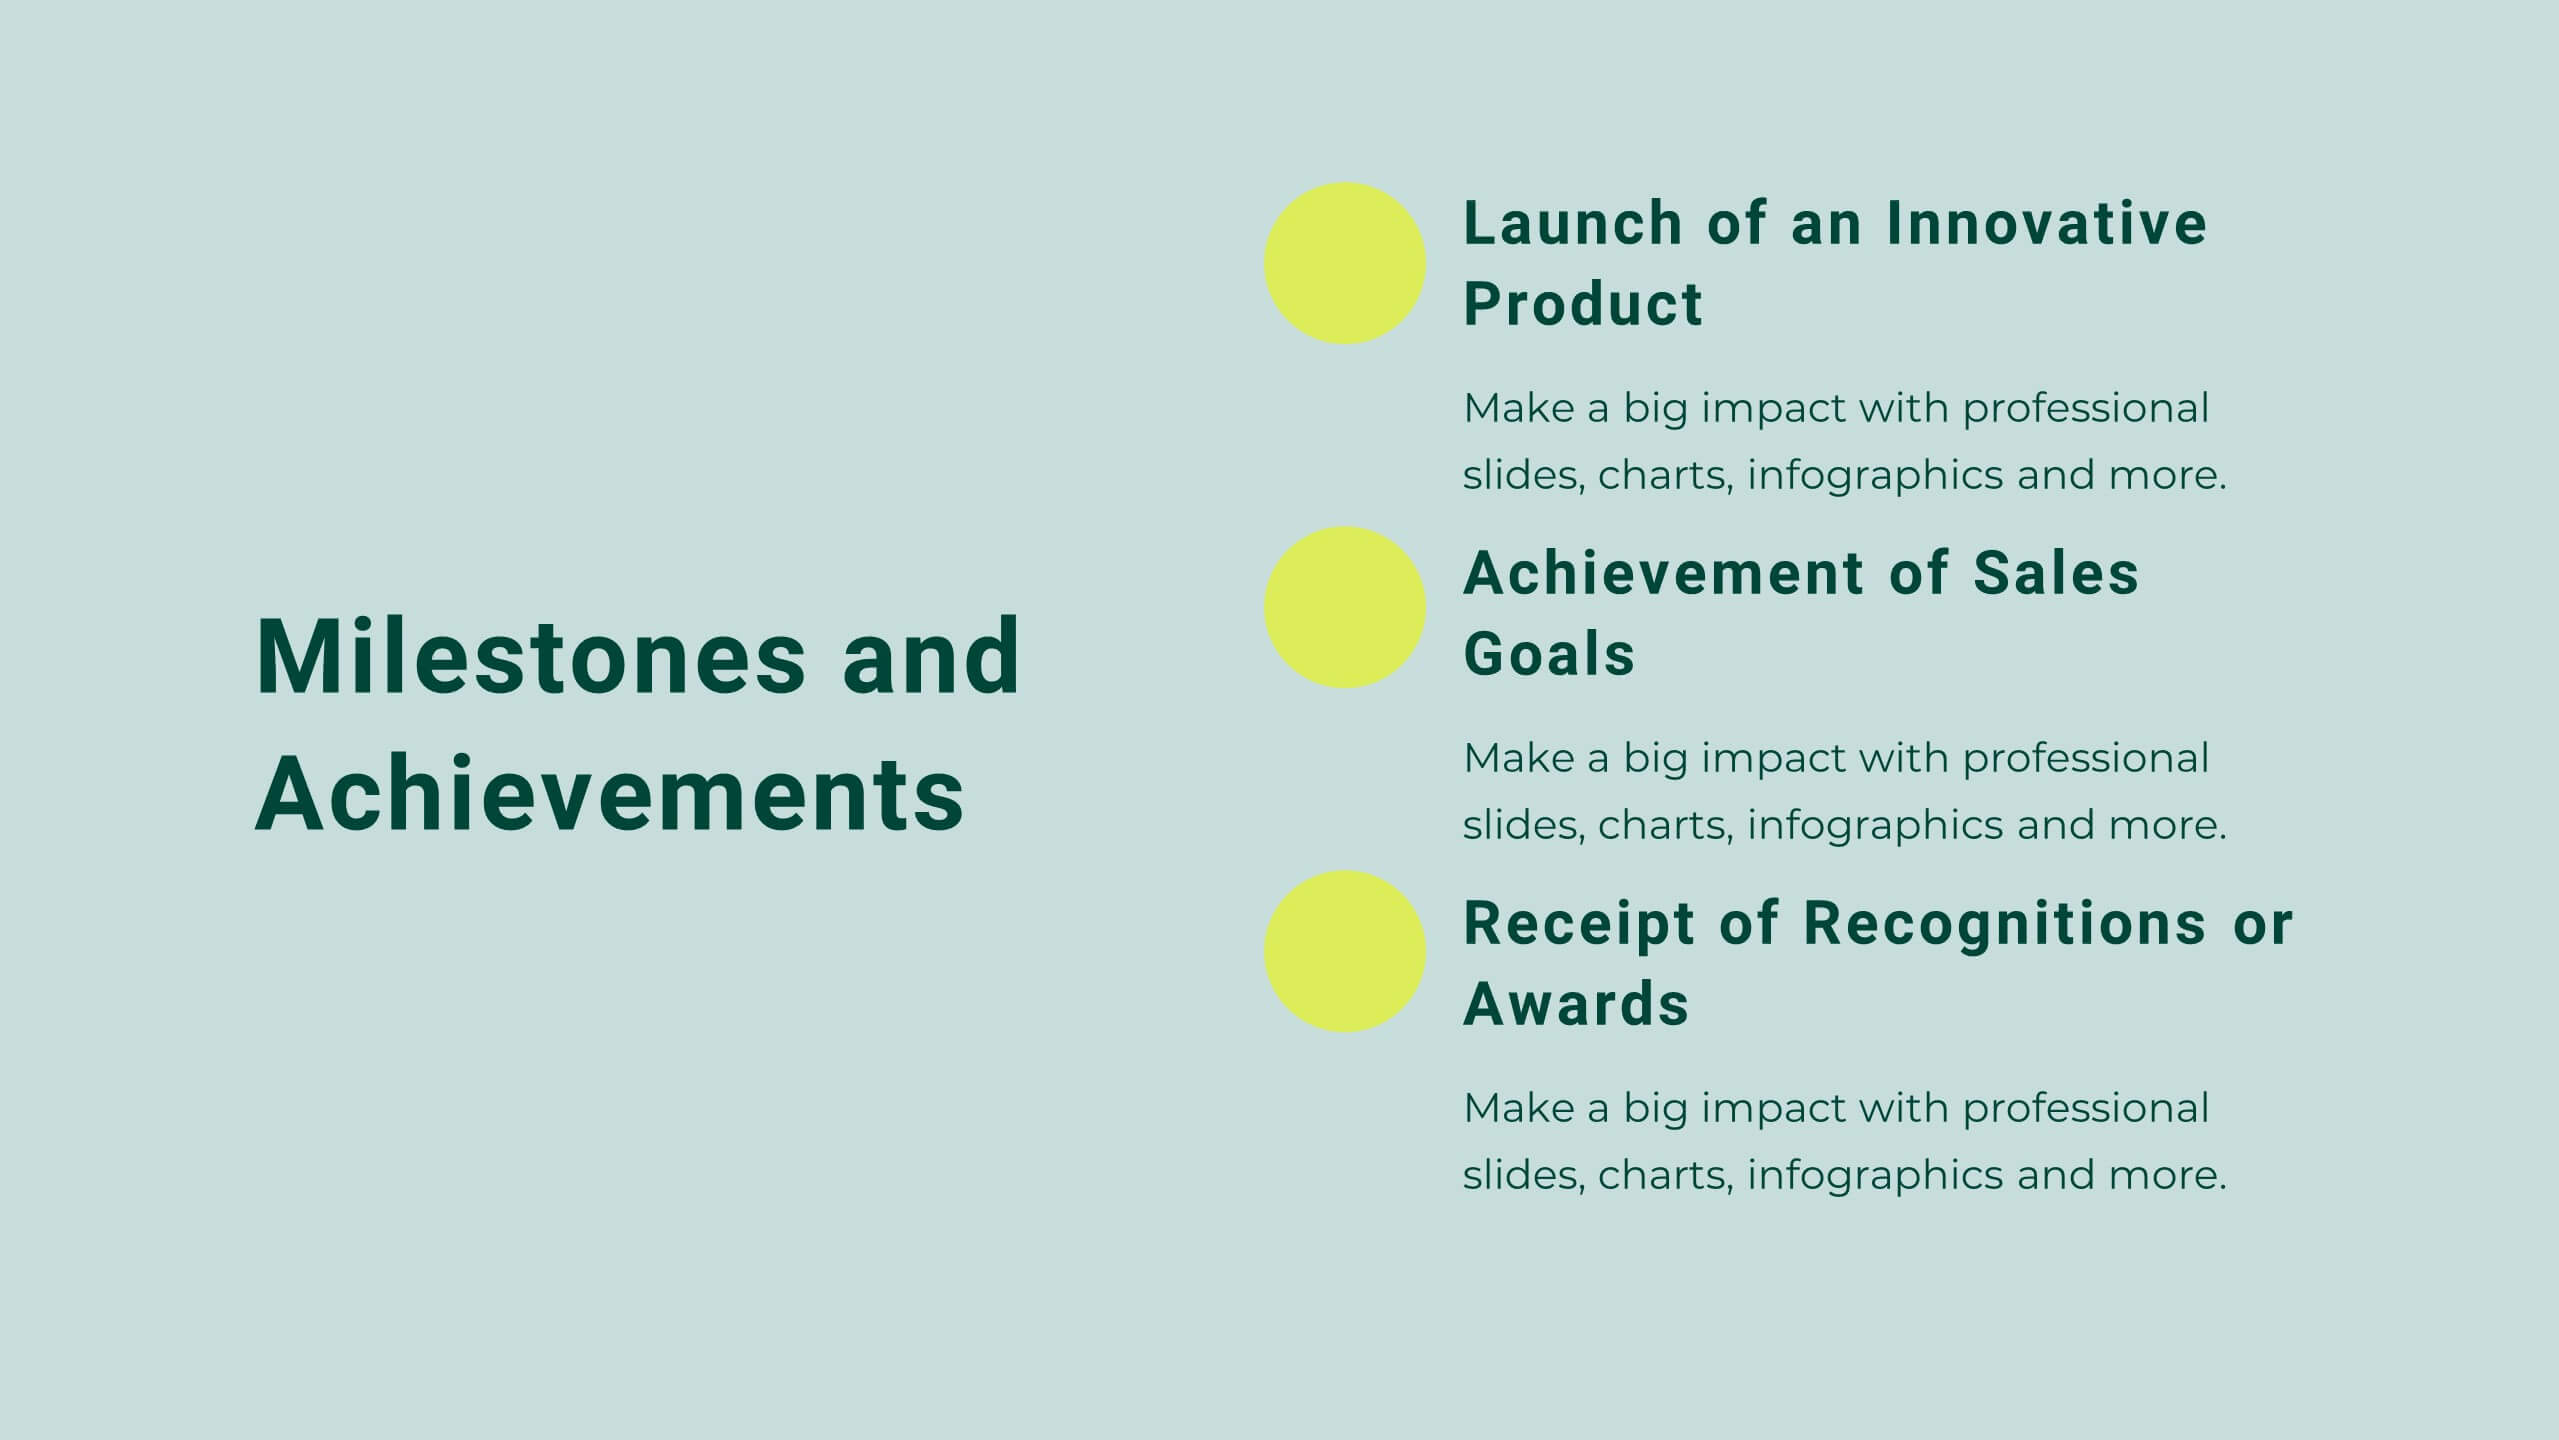
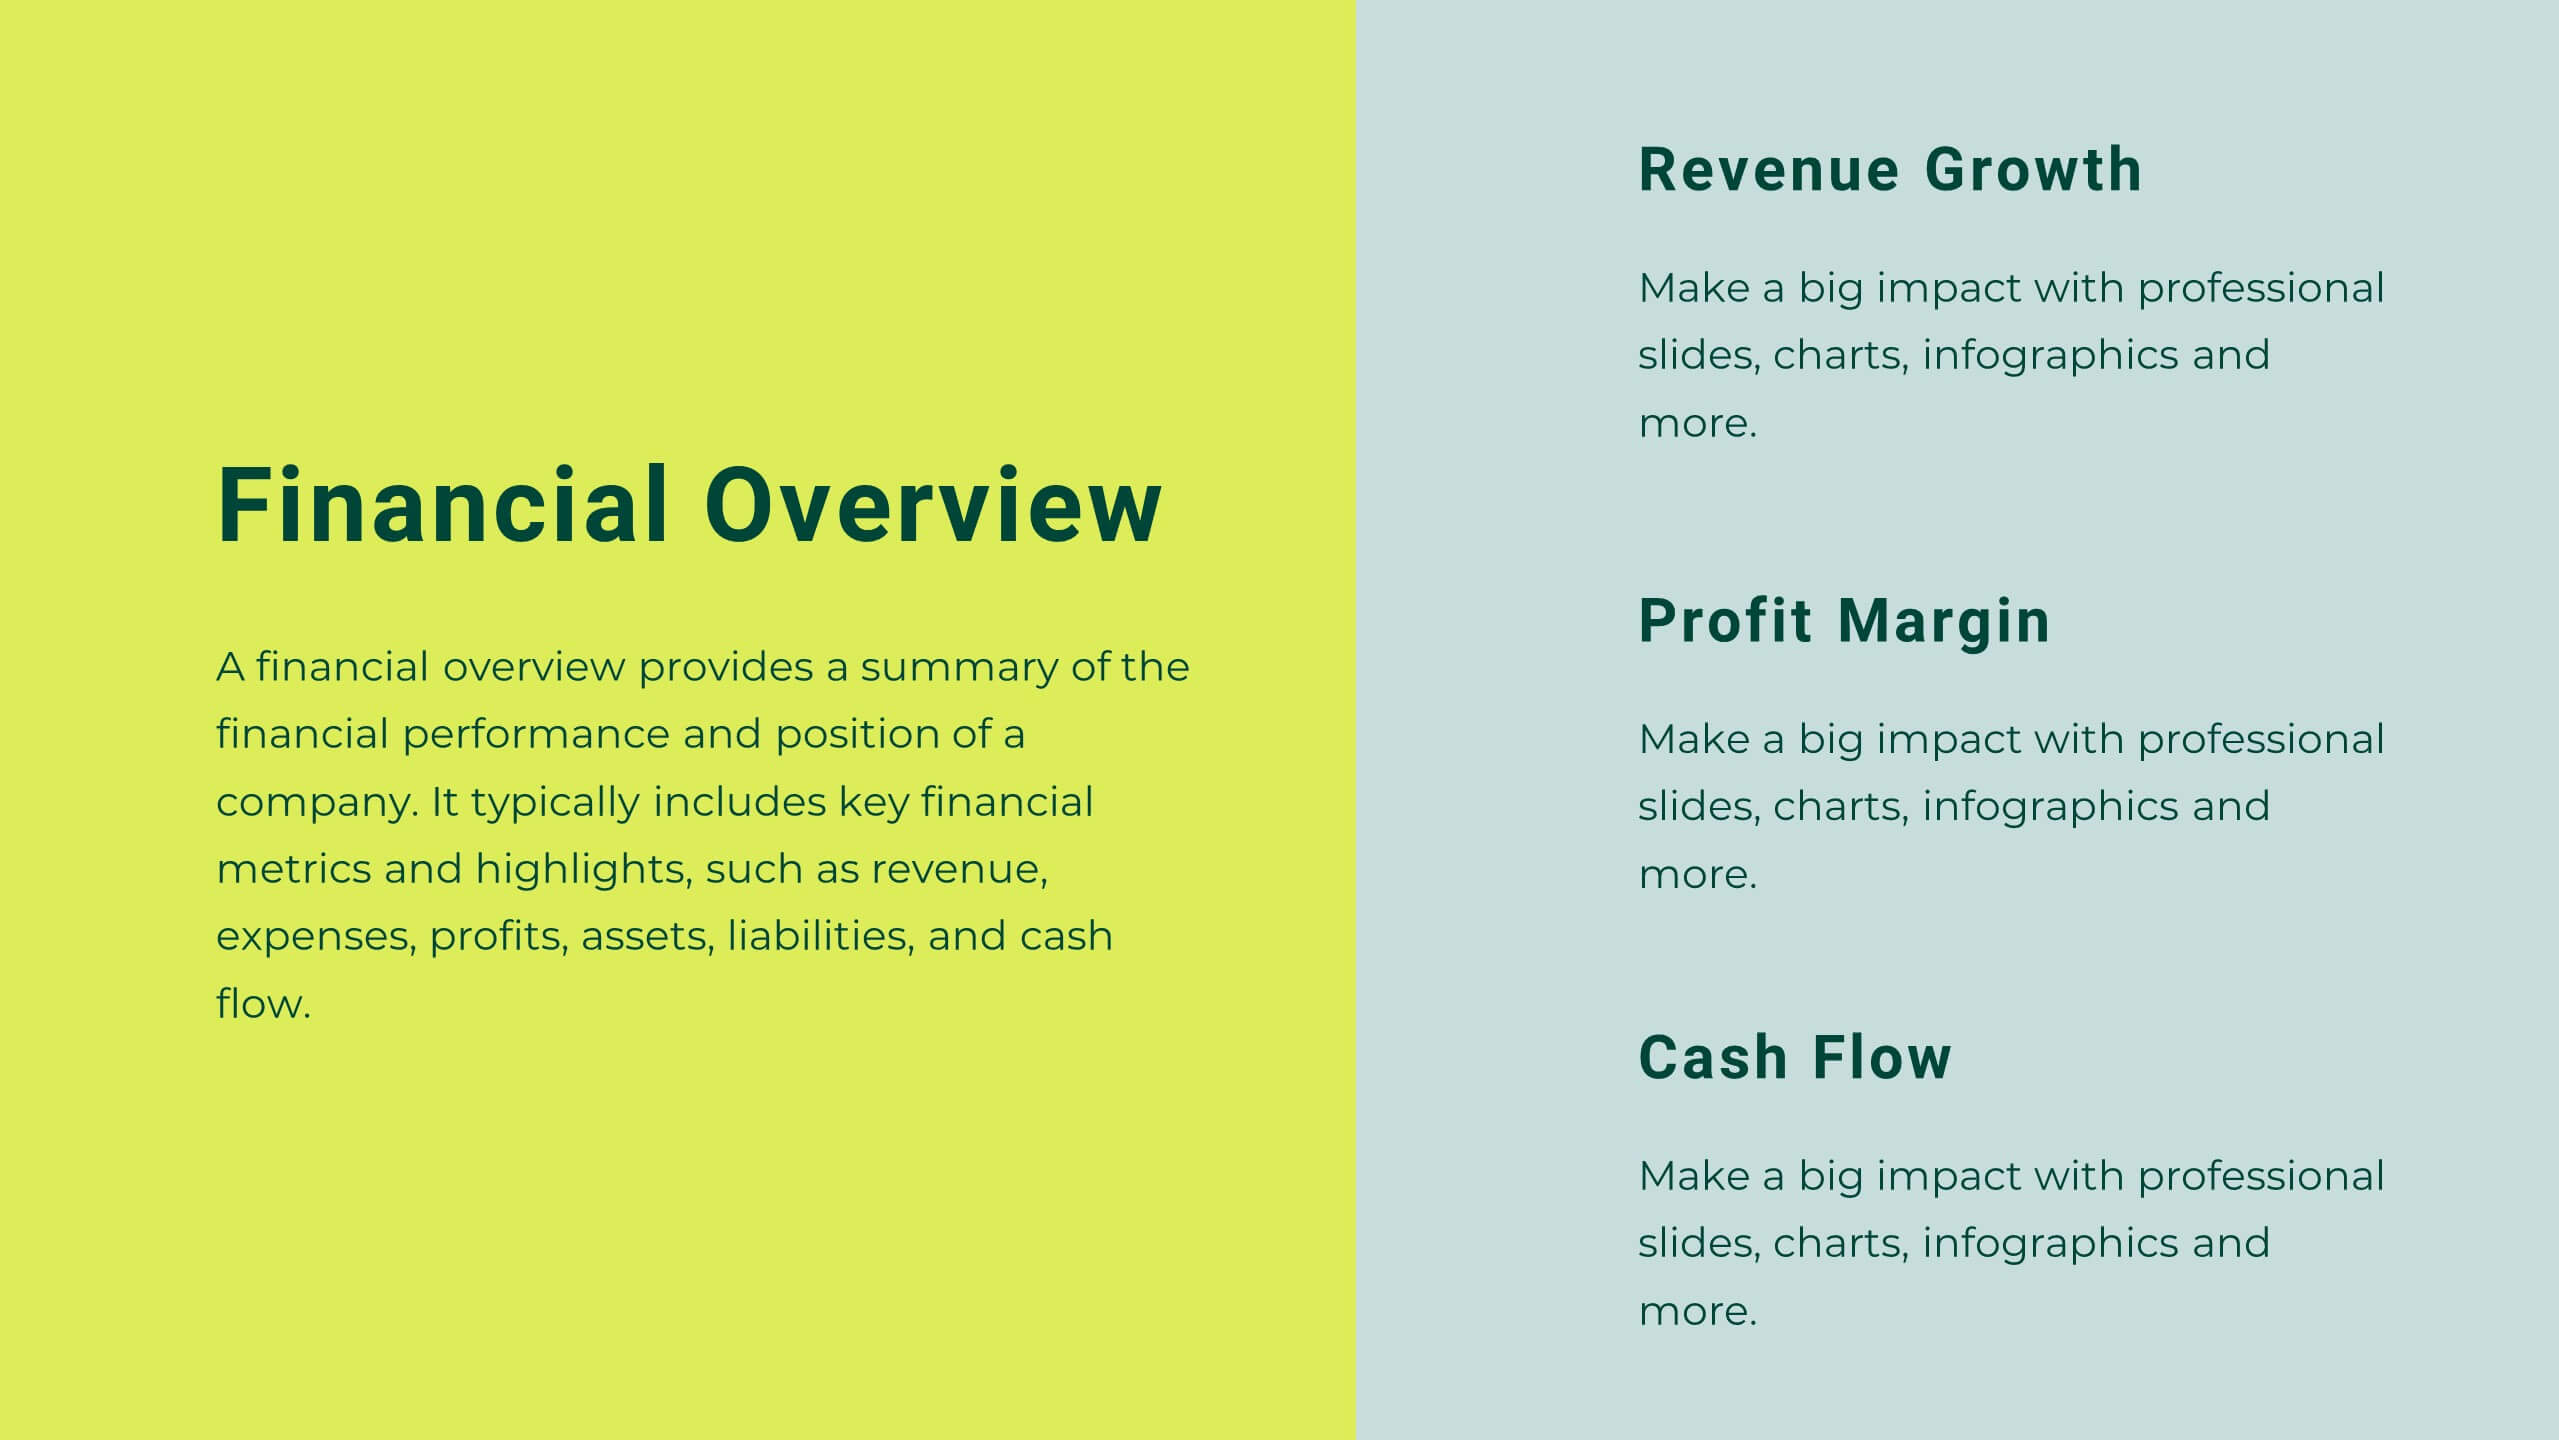
Nimbus Startup Growth Plan Presentation
Supercharge your startup's growth with this vibrant presentation template! Ideal for outlining your business plan, it includes slides for mission, market analysis, and financial overview. Capture investor attention with clear visuals and compelling content. Compatible with PowerPoint, Keynote, and Google Slides for a seamless presentation experience on any platform.


7 slides
Business Funnel Infographic Presentation
A Funnel Infographic is used to help communicate the stages of a sales funnel in a transparent and visually appealing way. This is a marketing model that is used to track the journey from project to profit. This template includes a series of funnel-shaped graphics that represent the different stages of the sales funnel. You can customize this template with your own content, colors, and fonts to suit your specific needs. Add your own text to each stage of the funnel, and use the additional icons to represent each stage in more detail. Convey your marketing message with this Infographic!


7 slides
Veterinary Hospital Infographic
A veterinary hospital, is a medical facility that provides healthcare services to animals, primarily focusing on the diagnosis, treatment, and prevention of illnesses and injuries in pets and other animals. This vibrant and heartwarming infographic template brings to life the journey of our beloved pets through the lens of a caring veterinary hospital. Compatible with Powerpoint, Keynote, and Google Slides. This template celebrates the love, care, and healing that happens every day at veterinary hospitals. This infographic is a haven where wagging tails and purring hearts find comfort and a reason to smile.


6 slides
Project Proposal Goals Infographic
Maximize the impact of your project proposals with this professional collection of templates, designed to outline your project goals and strategies with precision. Each template facilitates clear communication of project objectives, timelines, and the desired outcomes, making them essential for project managers, consultants, and business analysts. These slides are crafted with a clean, corporate design that uses a harmonious blend of blue tones, engaging charts, and concise content layouts. This ensures that key points are easily digestible and effectively conveyed to stakeholders. The structured format of these templates is ideal for detailing the scope of work, expected milestones, and resource allocation, supporting a comprehensive overview of your project plan. Customize these templates to align with your organization's branding and project specifics, enhancing your presentation and strengthening the proposal's persuasive power. Whether for internal briefings or external pitches, these slides are tailored to help you present a coherent and compelling case for your projects.


5 slides
Business Development Five-Step Plan Presentation
Accelerate your growth with the Business Development Five-Step Plan presentation. This structured template guides you through key stages of business expansion, from strategy to execution. Designed for entrepreneurs, startups, and corporate teams, this clear and engaging format ensures effective planning and communication. Fully customizable for PowerPoint, Keynote, and Google Slides to fit your specific needs.


5 slides
Skills Gap Assessment Presentation
Spot talent strengths and uncover hidden weaknesses with a clean, visual layout that makes workforce insights easy to understand. This presentation helps teams evaluate current abilities, identify missing competencies, and plan targeted development. Ideal for HR, training, and leadership reviews. Fully compatible with PowerPoint, Keynote, and Google Slides.


10 slides
Lean Business Model Planning Presentation
Streamline your startup strategy with this Lean Canvas presentation template. Designed for entrepreneurs and agile teams, it breaks down your business plan into 9 essential blocks—from Problem and Solution to Revenue Streams and Cost Structure. Easy to edit in PowerPoint, Keynote, or Google Slides for fast, effective planning and pitch presentations.


7 slides
Agenda Company Infographic
Optimize your corporate meetings with our premium collection of company agenda slide templates. Each slide is precisely designed to streamline and enhance the presentation of meeting agendas within a corporate setting. These templates are perfect for laying out the sequence of discussions, key points, and decision-making processes planned for corporate gatherings. The designs range from minimalistic layouts to more detailed ones, incorporating various graphical elements like charts, icons, and timelines to aid in visualizing the meeting’s structure. This not only helps in keeping the meeting on track but also enhances participant engagement by clearly outlining expectations and topics. These agenda slides are fully customizable, enabling adjustments in color schemes, text placement, and design elements to suit your corporate identity and specific meeting needs. Whether it's weekly team meetings, executive briefings, or annual general meetings, these templates provide the necessary structure to conduct efficient and effective corporate discussions.