


Características


¿Tienes alguna pregunta?
Recomendar


6 diapositivas
Major World History Milestones Presentation
Highlight significant events in a visually engaging way with this horizontal timeline template. Featuring clean icons, color-coded markers, and spacious text areas, it’s ideal for showcasing historical sequences, educational lectures, or research summaries. Fully editable in PowerPoint, Keynote, and Google Slides for customized storytelling and clear chronological impact.


20 diapositivas
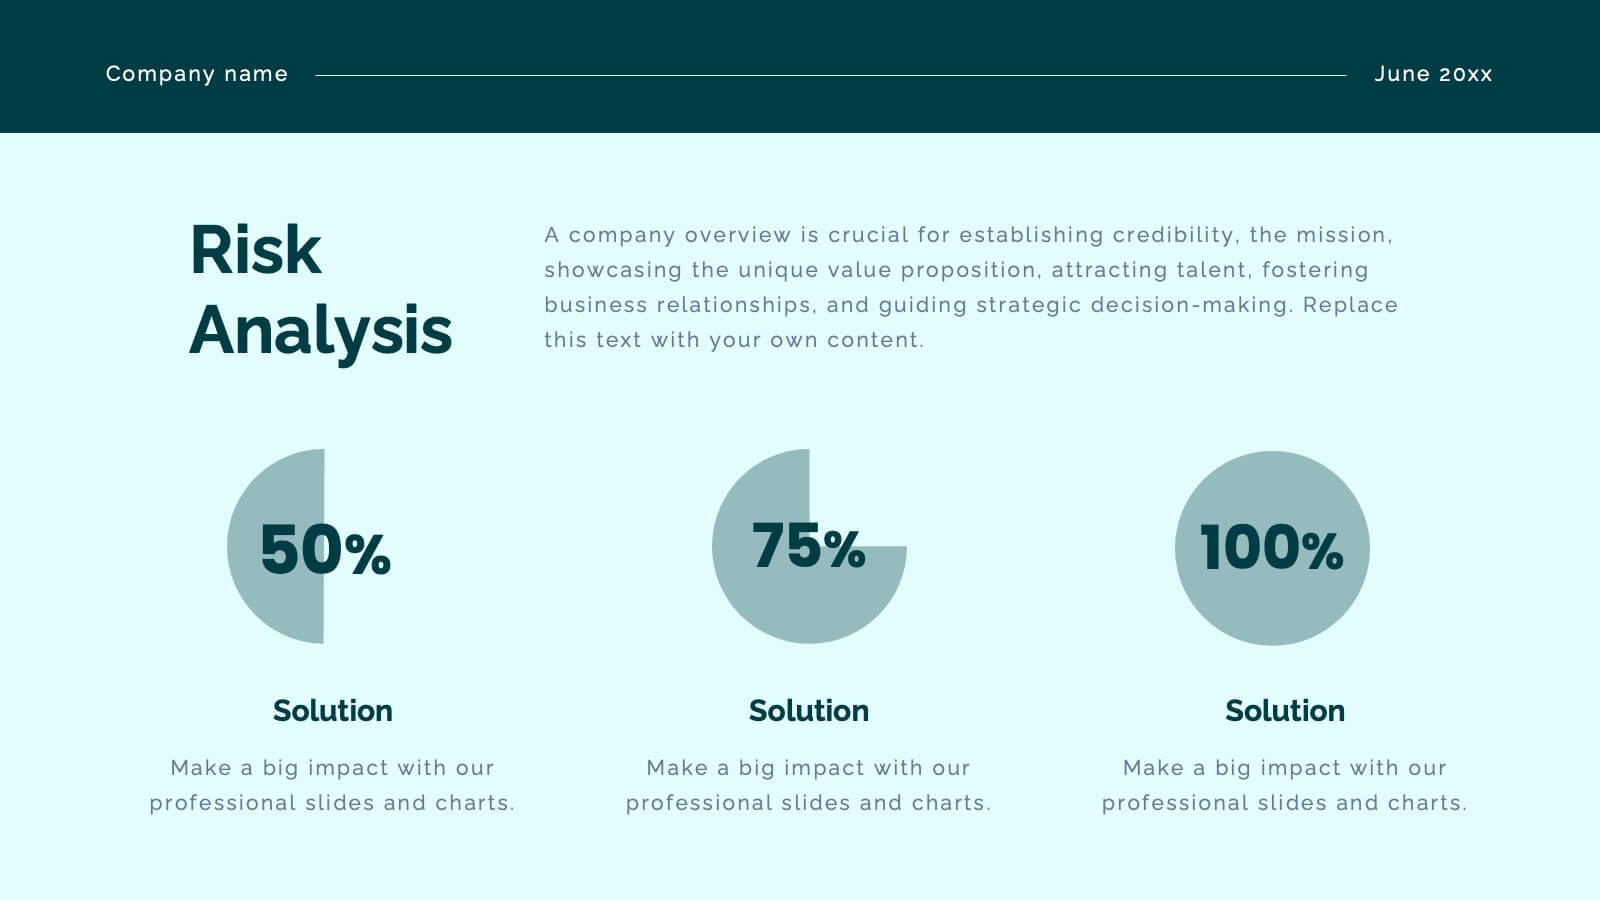
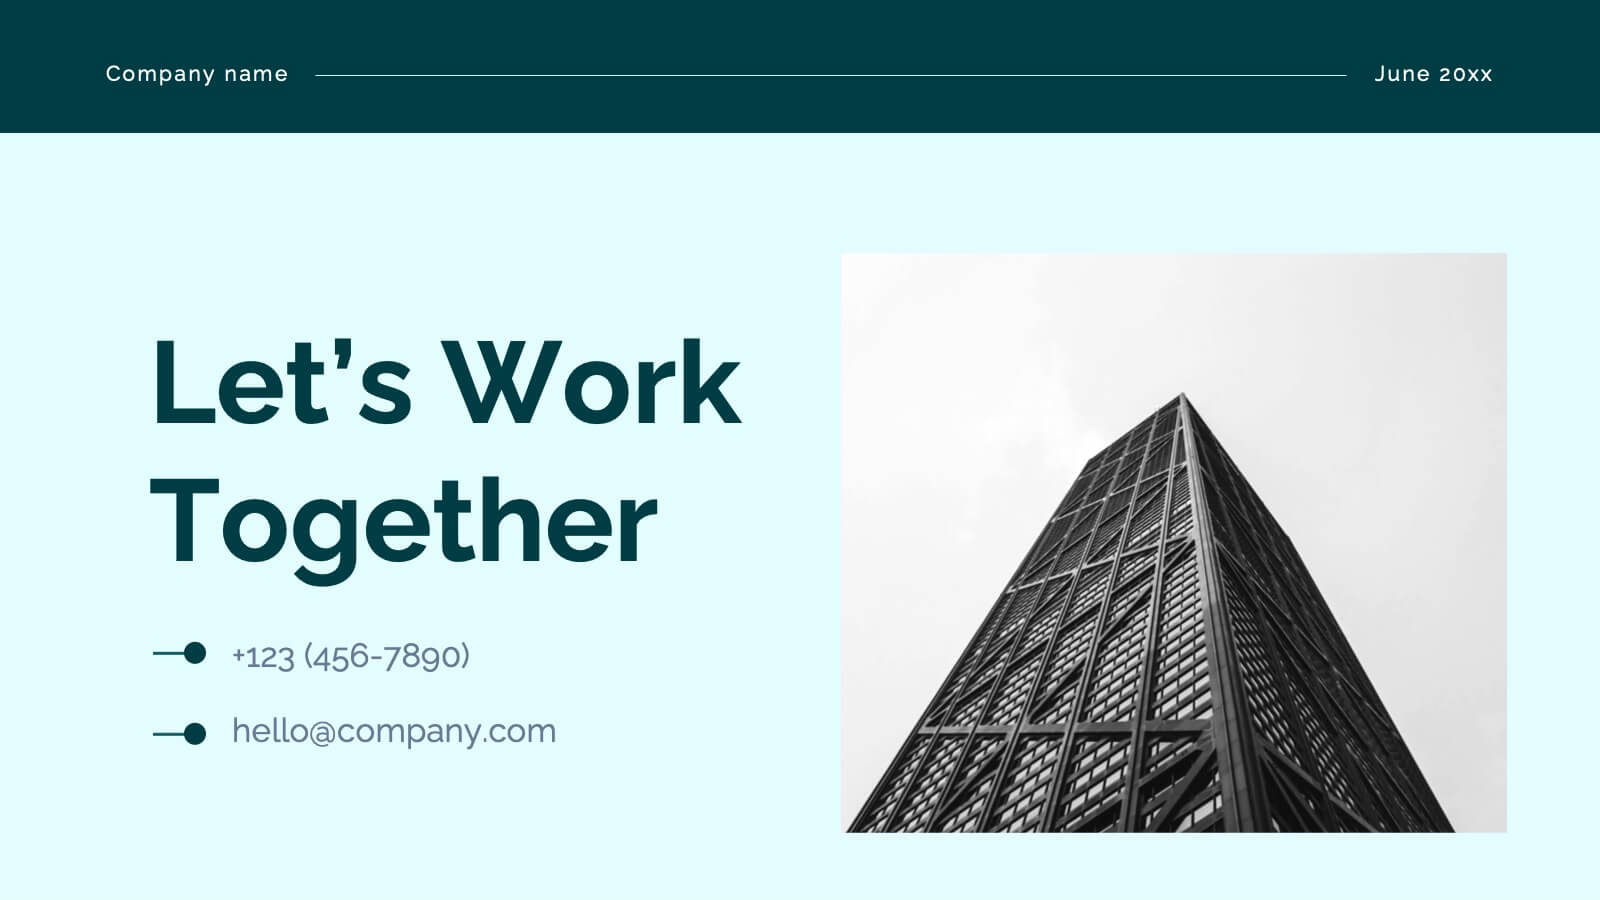
Faelight Project Proposal Presentation
A professional project proposal template for showcasing company overview, objectives, scope of work, timelines, and budget breakdowns. Includes sections for client testimonials, pricing structures, and risk mitigation strategies. Fully customizable for various industries and ideal for pitching new projects. Compatible with PowerPoint, Keynote, and Google Slides for seamless presentations.


10 diapositivas
Business Growth and Market Statistics Presentation
Showcase key business growth trends and market insights with the "Business Growth and Market Statistics" presentation templates. These visuals are crafted to enhance clarity in communicating growth drivers, market dynamics, and performance metrics effectively. Ideal for corporate presentations, they're compatible with PowerPoint, Keynote, and Google Slides, ensuring a professional look across all platforms.


7 diapositivas
Geographic Global Data Presentation
Bring worldwide insights to life with a crisp, modern layout designed to make global trends easy to understand. This presentation highlights regional metrics, geographic comparisons, and key data points in a clean, visual format perfect for business or research reporting. Fully compatible with PowerPoint, Keynote, and Google Slides.


6 diapositivas
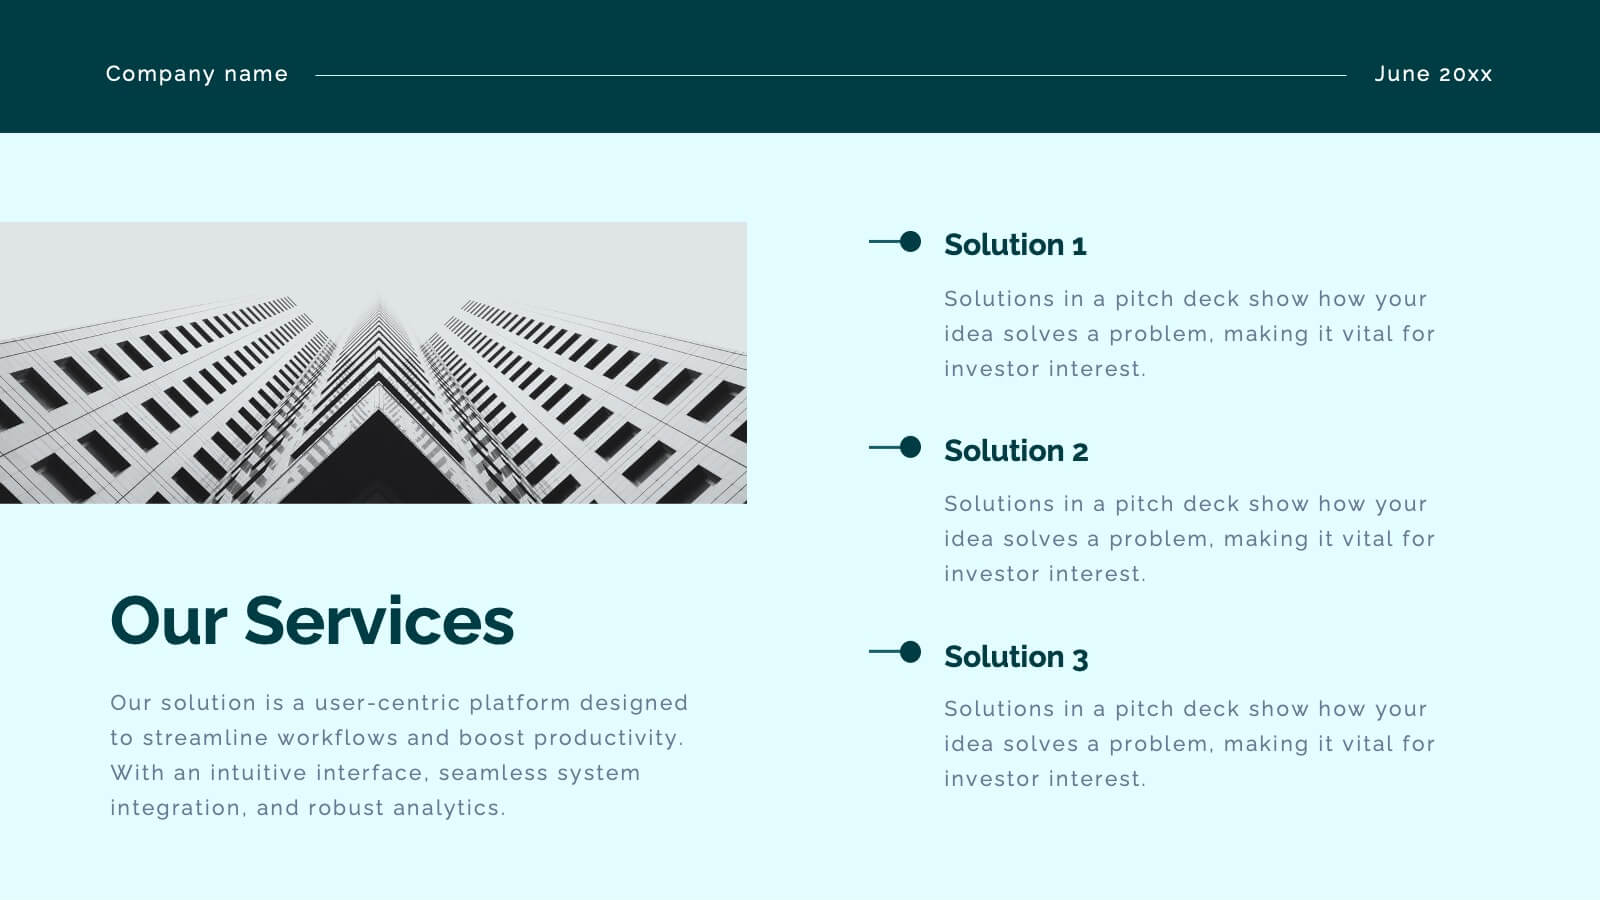
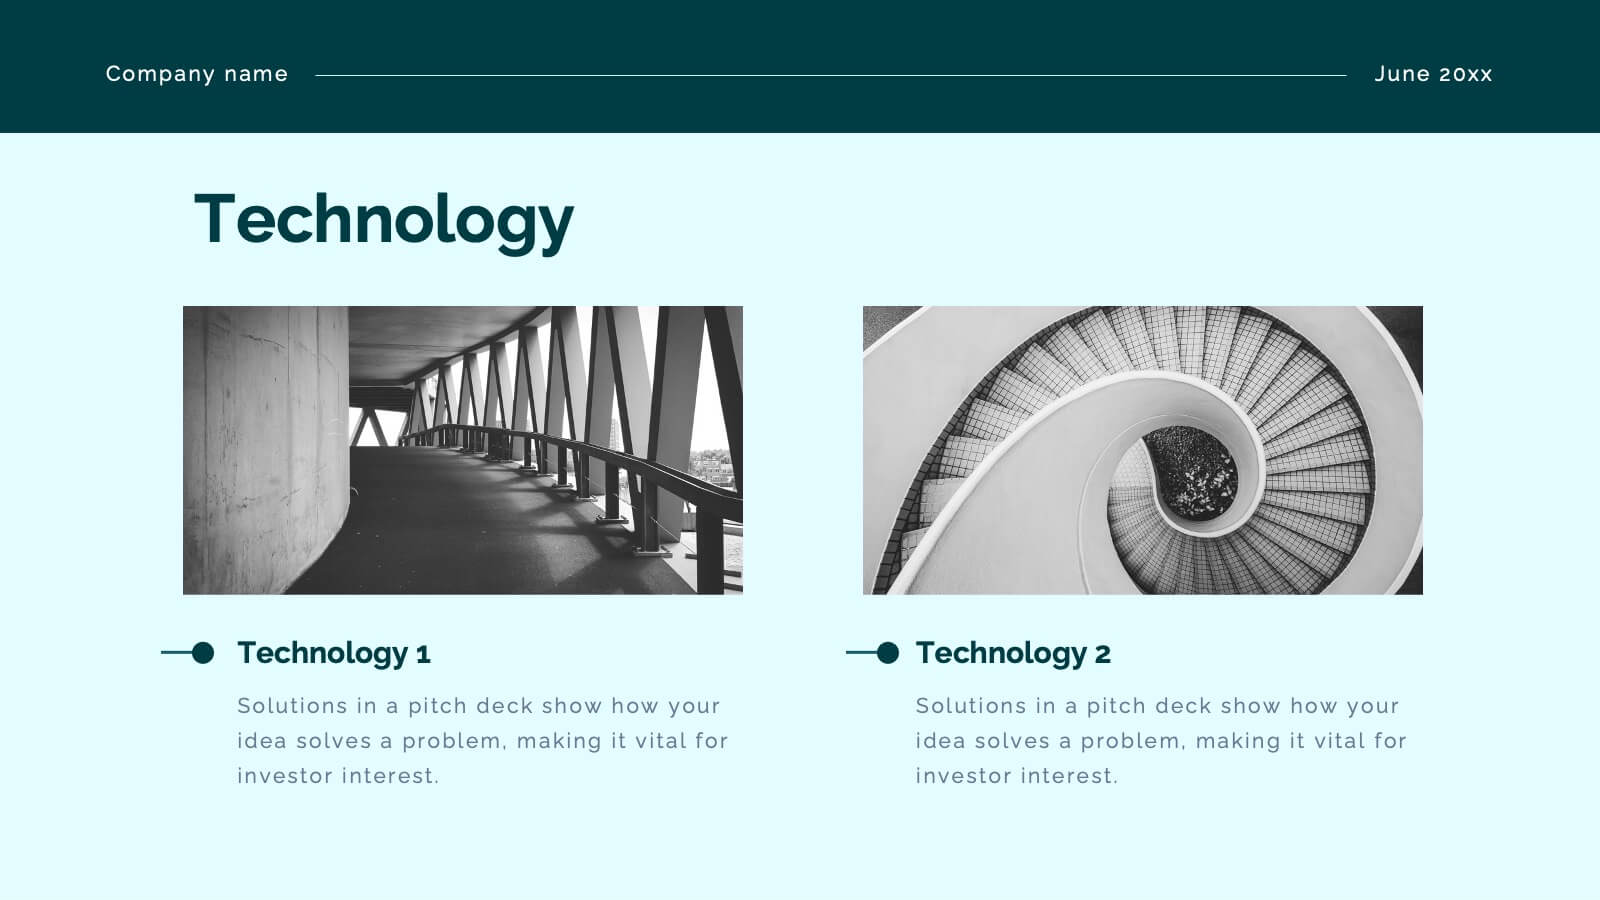
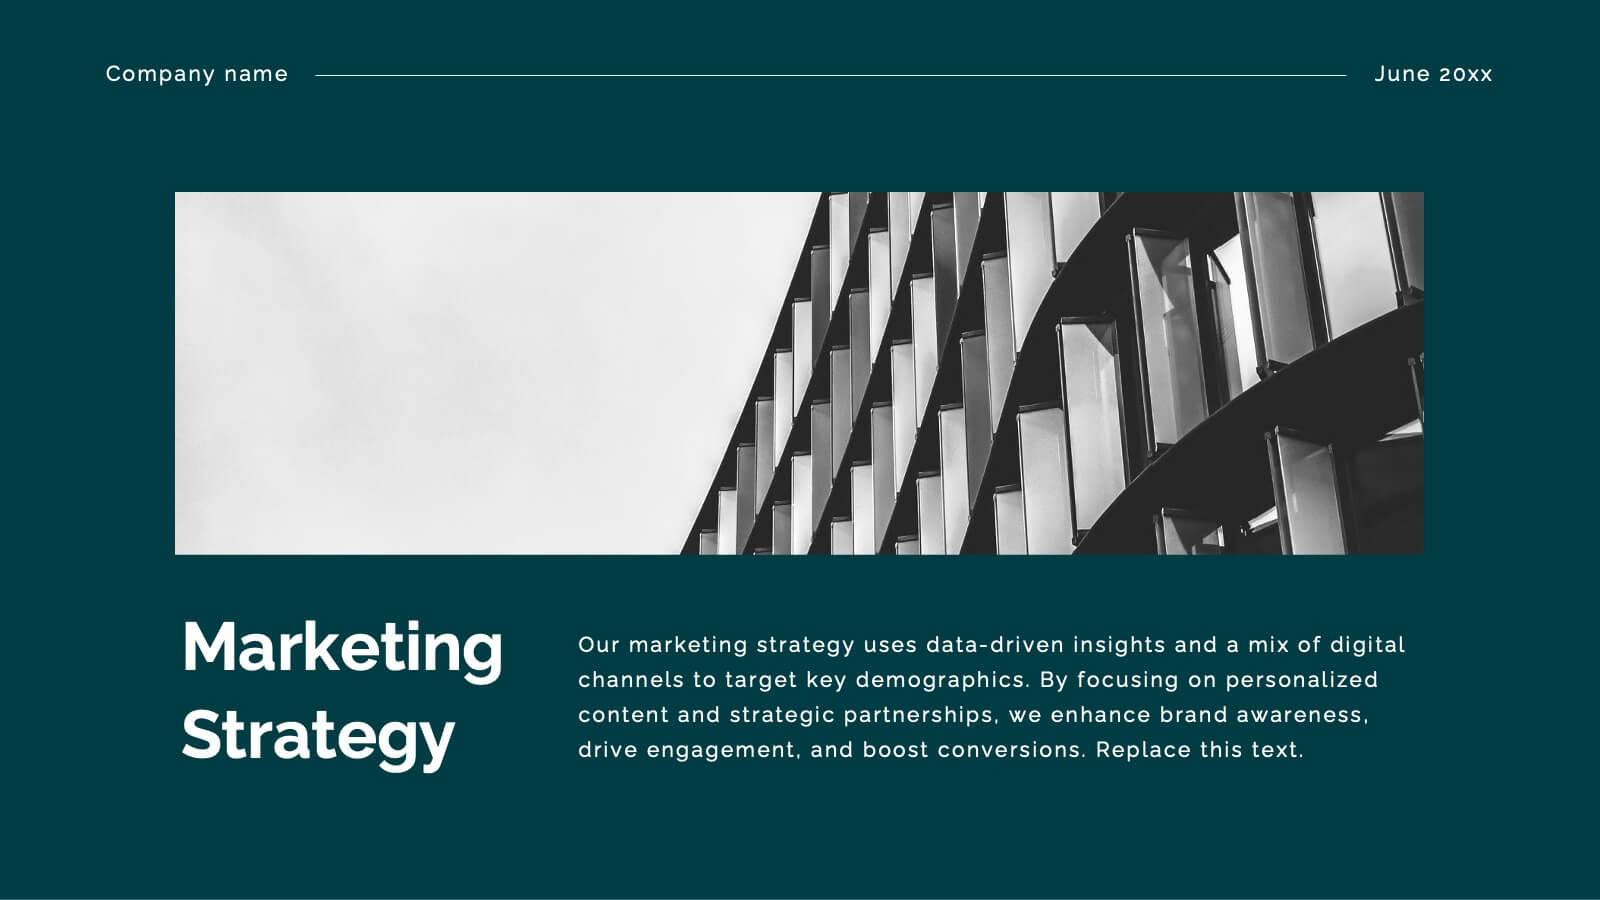
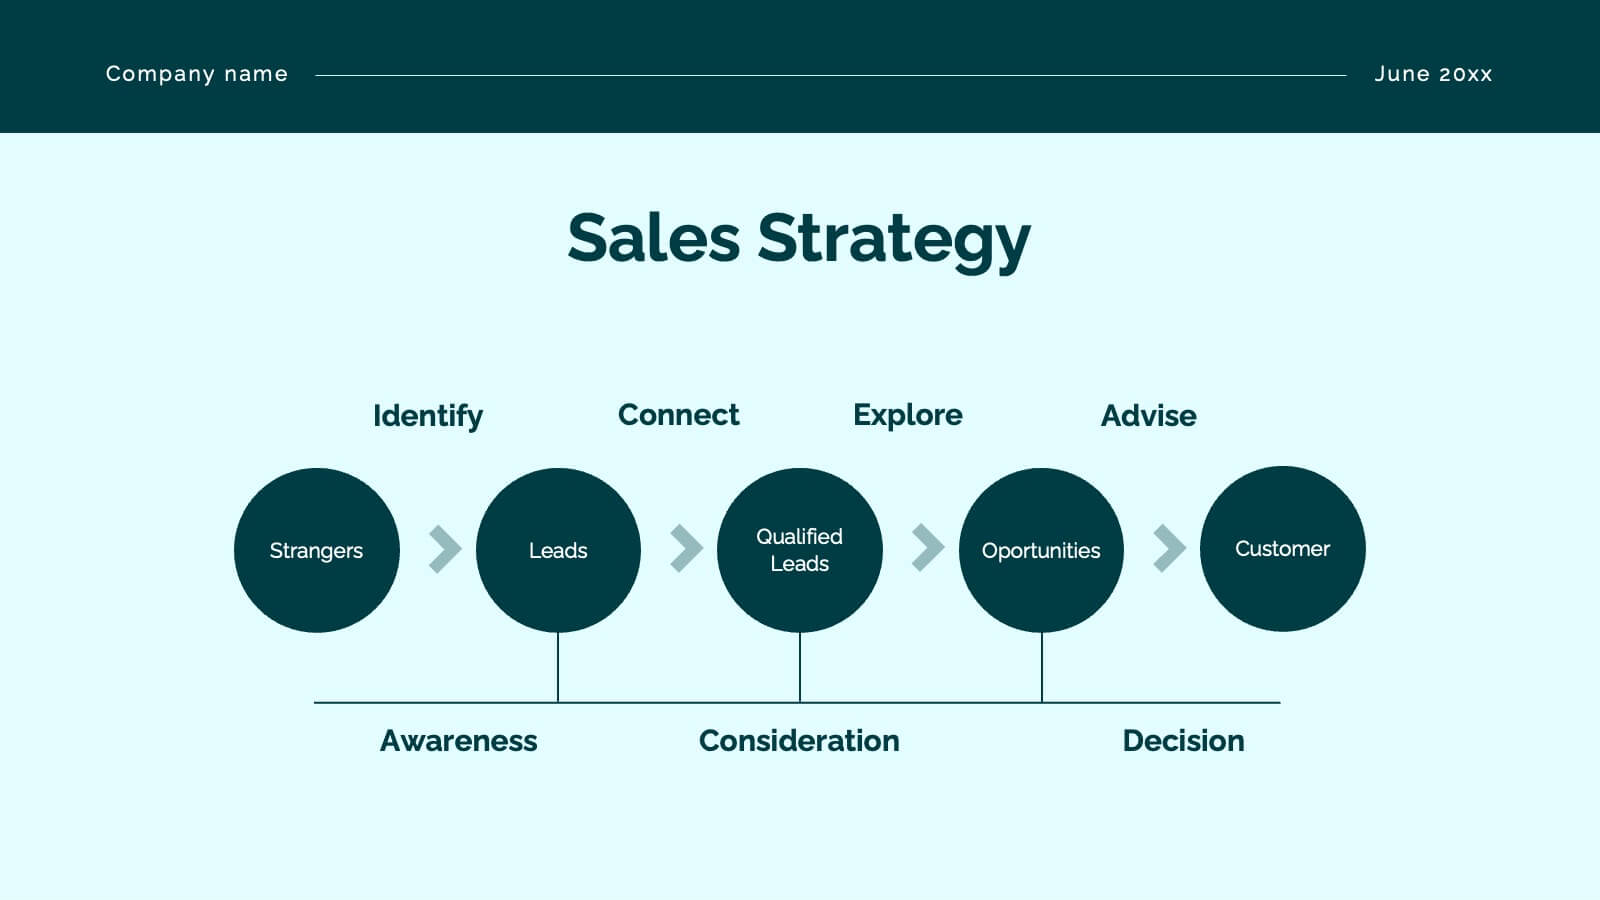
Corporate Company Profile Presentation
Showcase Your Business with a Professional Company Profile! The Corporate Company Profile template is designed to present your brand, values, and key highlights in a structured and visually appealing format. Featuring modern circular image placements, strategic content sections, and sleek infographics, this template is ideal for introducing your company, highlighting milestones, and communicating your business strategy. Fully editable in PowerPoint, Keynote, and Google Slides, this design ensures seamless customization for any industry.


5 diapositivas
Employee Benefits and Compensation Presentation
Effectively communicate your company’s value proposition with this Employee Benefits and Compensation Presentation. This clean and professional diagram highlights four key benefit categories in a circular flow, perfect for HR teams, onboarding materials, or internal strategy reviews. Easily editable in PowerPoint, Keynote, or Google Slides, it's ideal for showcasing wellness perks, bonuses, insurance, and more.


26 diapositivas
Geometric Technology Presentation
Technology has changed the world we live in, it is a powerful tool when used correctly and with caution. This template offers a sleek way to deliver your message and is designed with geometric shapes that are arranged in a flexible design. It includes a backdrop with a geometric pattern, which can be customized with your own images and colors. This template is a great way to impress your teachers, clients, or students with the newest technologies. With an emphasis on high-quality visuals, this template is perfect for illustrating your ideas and giving people confidence in your business plan.


21 diapositivas
Techne Strategic Planning Report Presentation
Streamline your strategic planning process with this meticulously crafted presentation template, designed for professionals seeking clarity and structure. Featuring slides dedicated to market trends, SWOT analysis, target audience profiling, and competitive insights, this template ensures your strategy is well-rounded and impactful. The clean and modern design accommodates sections for defining objectives, key challenges, and resource allocation, allowing your team to focus on actionable solutions. Performance metrics and risk management slides help you track progress and address uncertainties effectively. Whether presenting to stakeholders or internal teams, this tool simplifies complex data into easily digestible visuals. Fully editable and compatible with PowerPoint, Google Slides, and Keynote, this template provides the flexibility to adapt to various needs. Perfect for organizations aiming to communicate strategic initiatives and actionable plans with precision and professionalism. Take your strategic planning reports to the next level with this essential template.


10 diapositivas
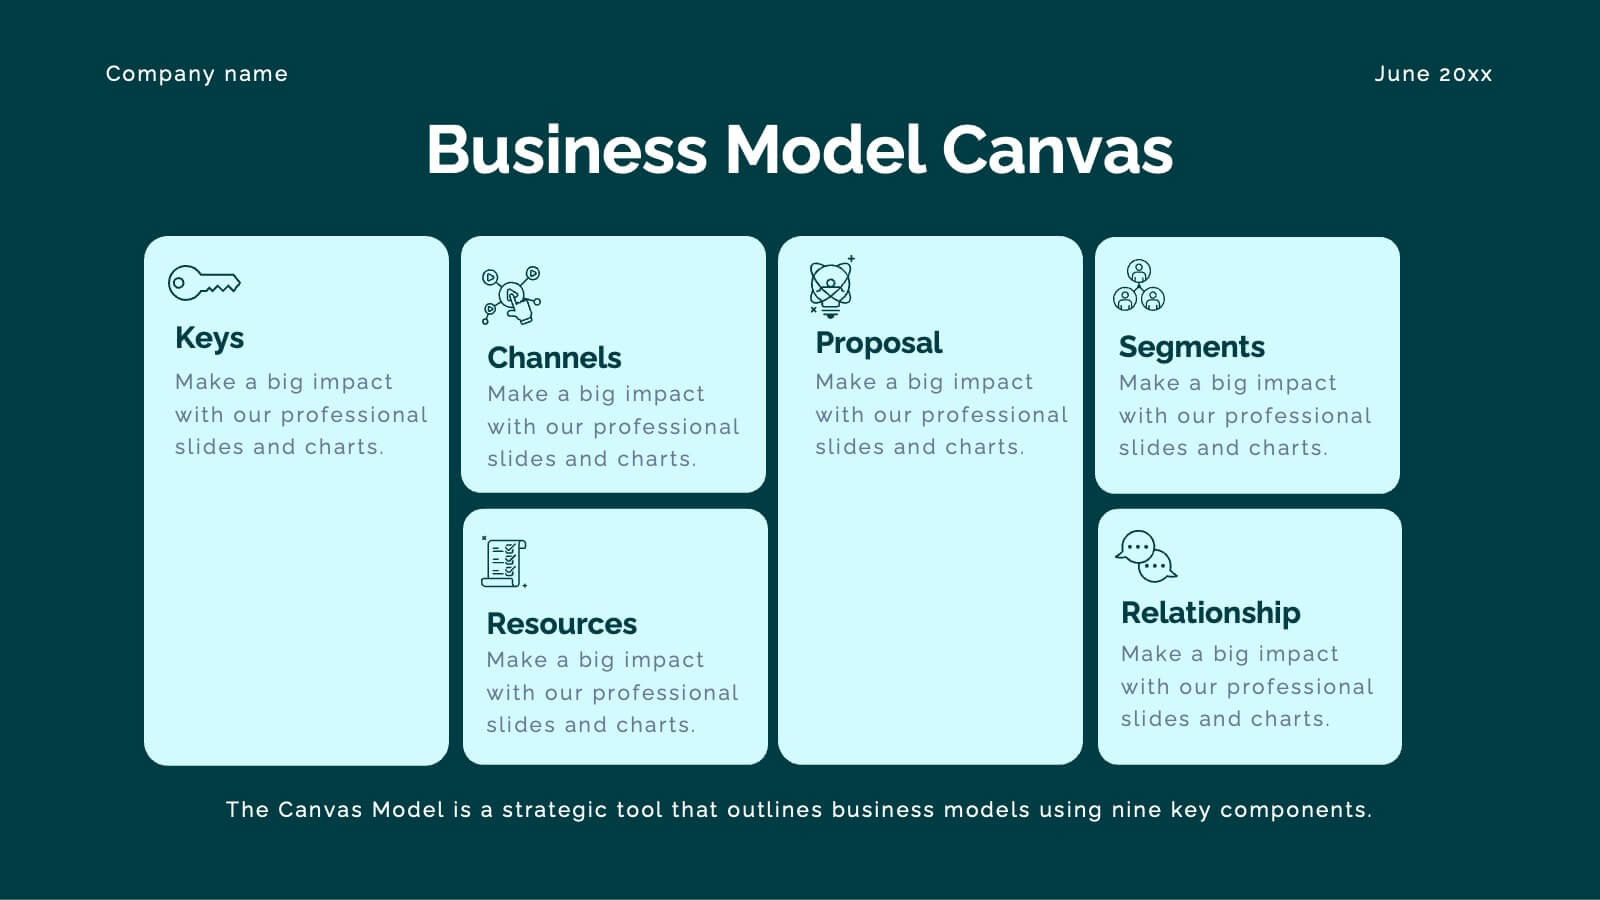
Business Model Hexagon Infographic
Break down your strategy into clear, modular components with the Business Model Hexagon Infographic Presentation. This visually engaging layout features five interlinked hexagons, each labeled and icon-marked for easy segmentation of your business pillars—such as value propositions, customer channels, key partners, and revenue streams. The vertical stack ensures a logical flow while keeping your message structured and professional. Fully editable in PowerPoint, Keynote, and Google Slides, allowing you to tailor icons, text, and colors to match your business theme.


4 diapositivas
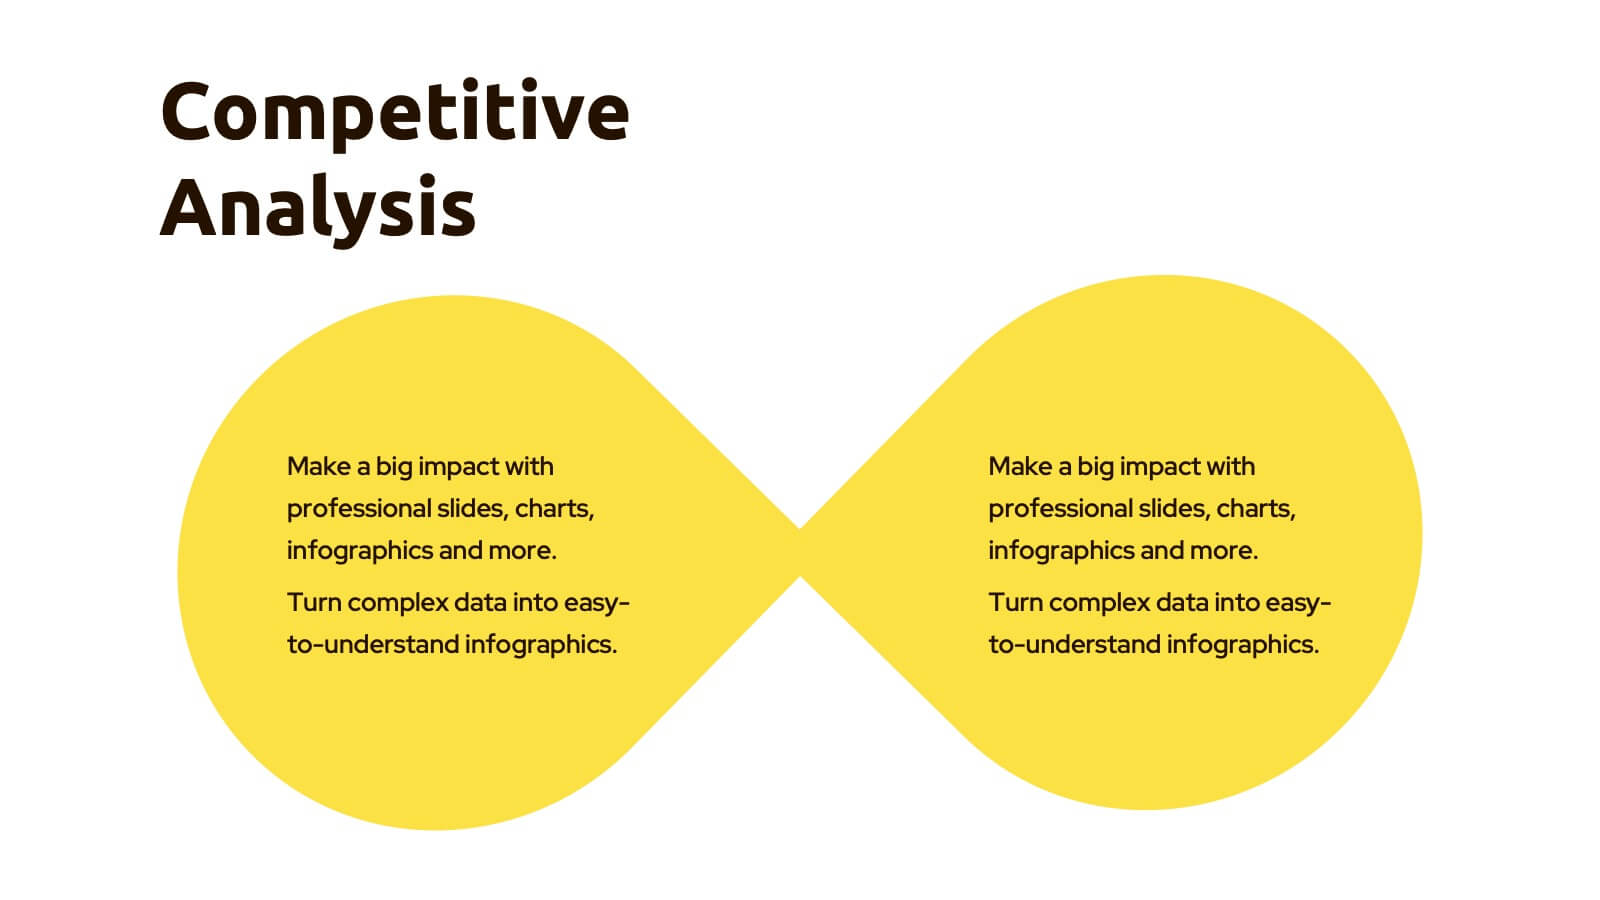
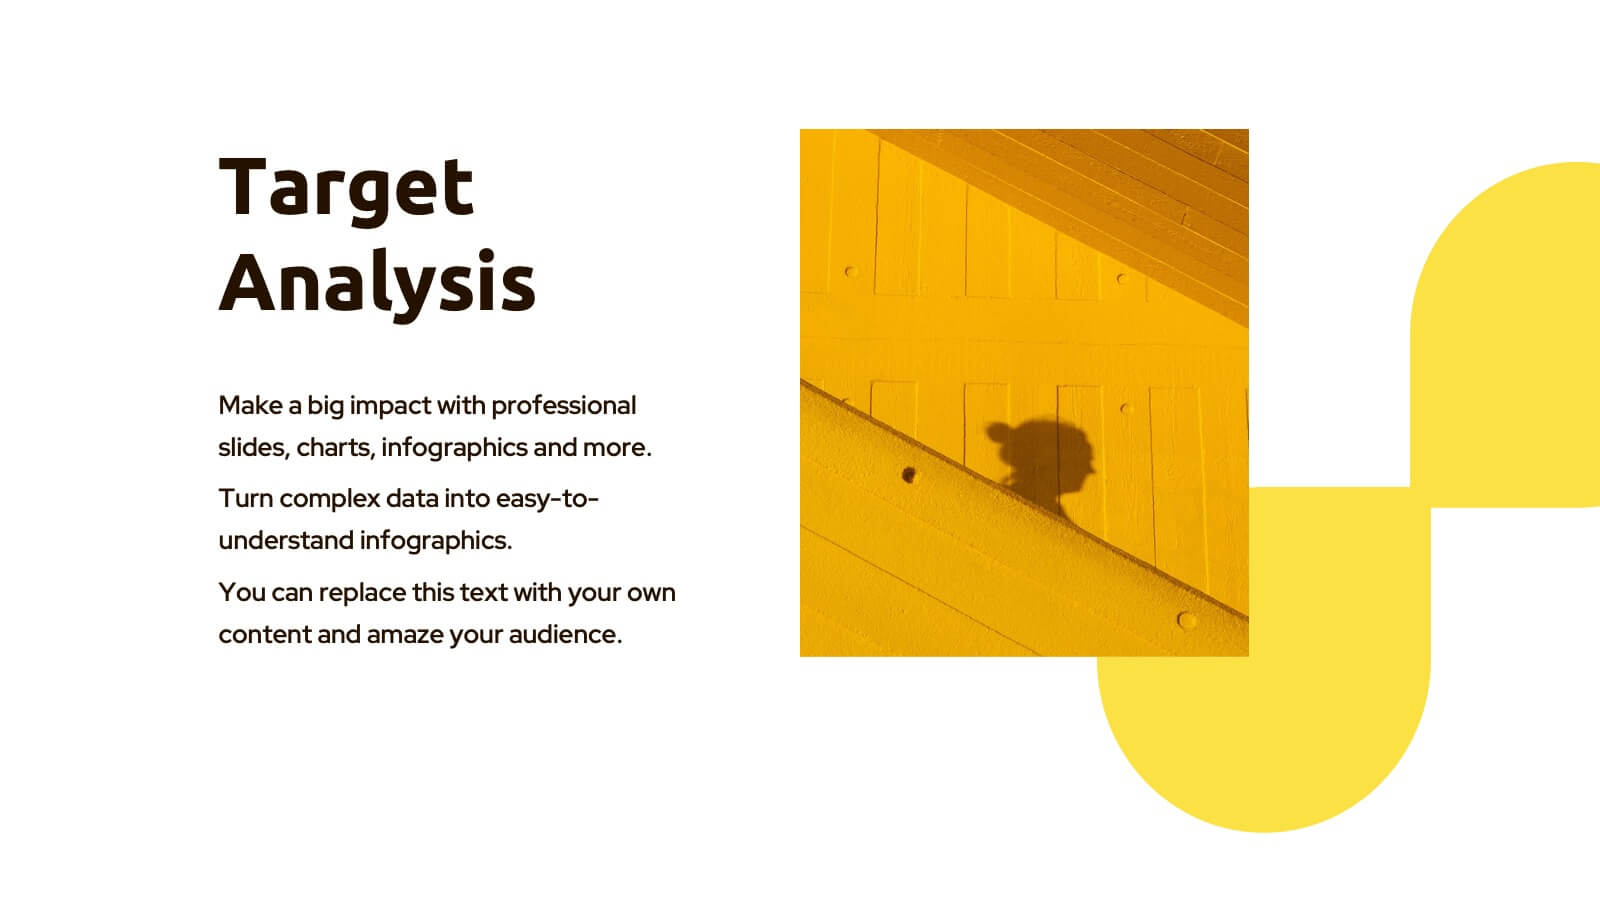
Mirror Data Distribution Butterfly Format Presentation
Present side-by-side comparisons with clarity using the Mirror Data Distribution Butterfly Format Presentation. This layout helps visualize balanced data sets, performance comparisons, or goal vs. outcome metrics with mirrored bars and intuitive icons. Fully customizable in Canva, PowerPoint, Google Slides, and Keynote to match your brand's aesthetic and message.


3 diapositivas
Company Vision Roadmap Presentation
Bring your future story to life with a clear, inspiring layout that guides viewers through your long-term direction and strategic milestones. This presentation helps teams communicate purpose, goals, and planned progress in a simple, structured format that’s easy to follow. Compatible with PowerPoint, Keynote, and Google Slides.


26 diapositivas
Navigating Freelance and Flexible Work Presentation
Take control of your career with this insightful presentation on navigating freelance and flexible work. Covering key topics like client management, productivity strategies, income stability, and remote work tools, this template helps you present a clear roadmap to success. Fully customizable and compatible with PowerPoint, Keynote, and Google Slides for a seamless experience.


8 diapositivas
Chain of Command Mapping Presentation
Clarify your organizational flow with the Chain of Command Mapping Presentation. This template is ideal for visualizing reporting lines, departmental authority, and team structures in a clean, easy-to-follow format. Featuring modern icons, varied layouts, and editable labels, it helps simplify decision-making and responsibility tracking. Fully customizable in PowerPoint, Keynote, Canva, and Google Slides.


20 diapositivas
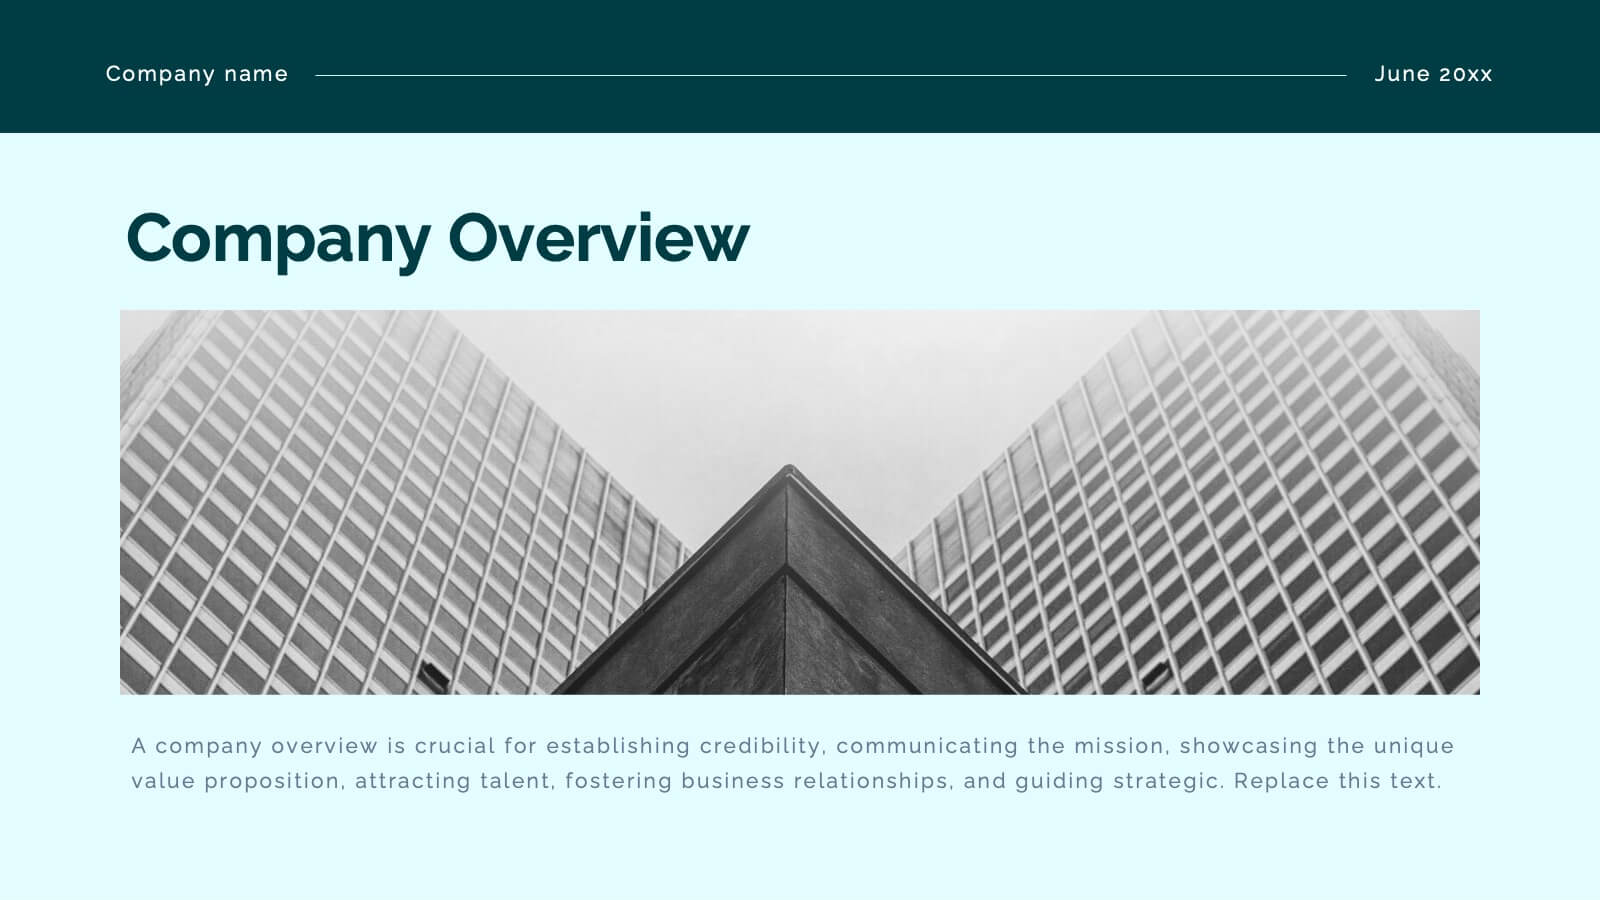
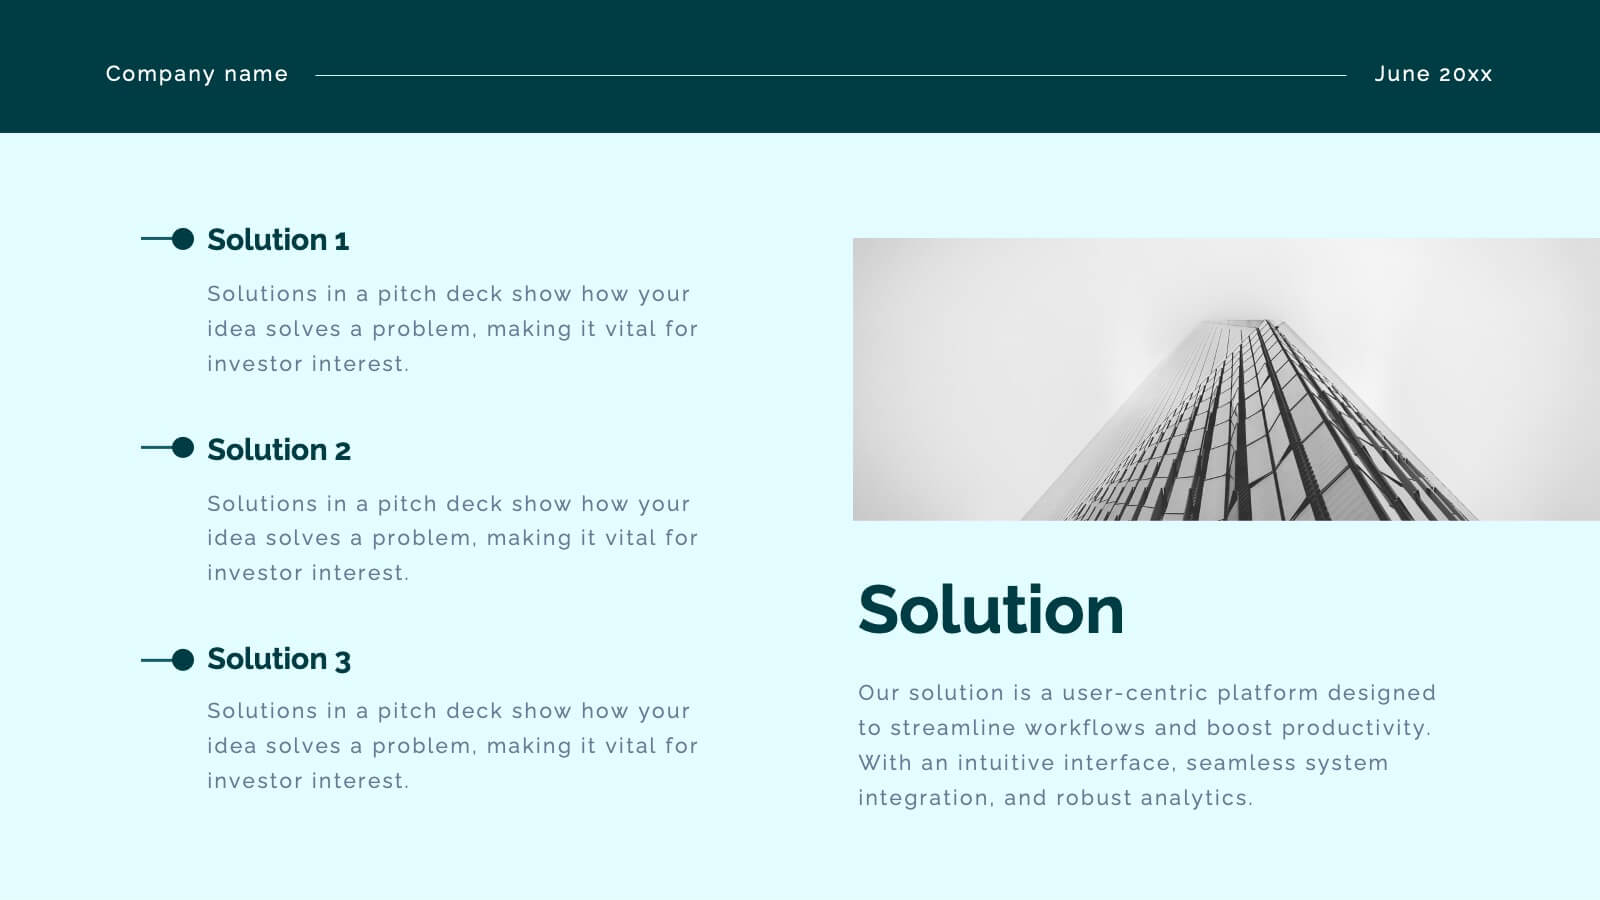
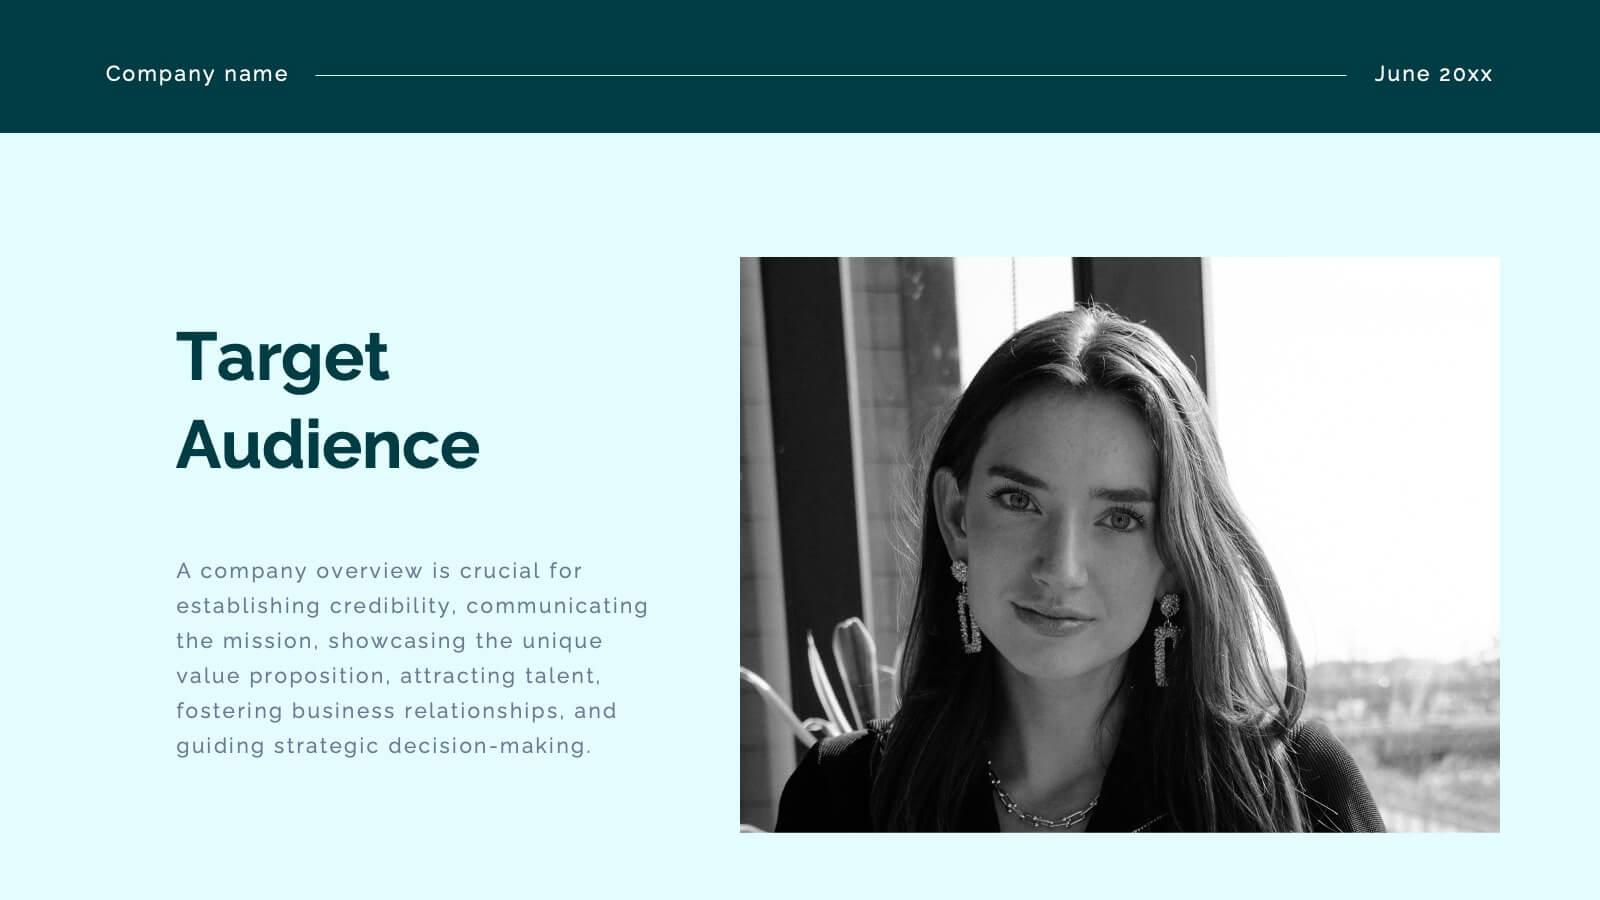
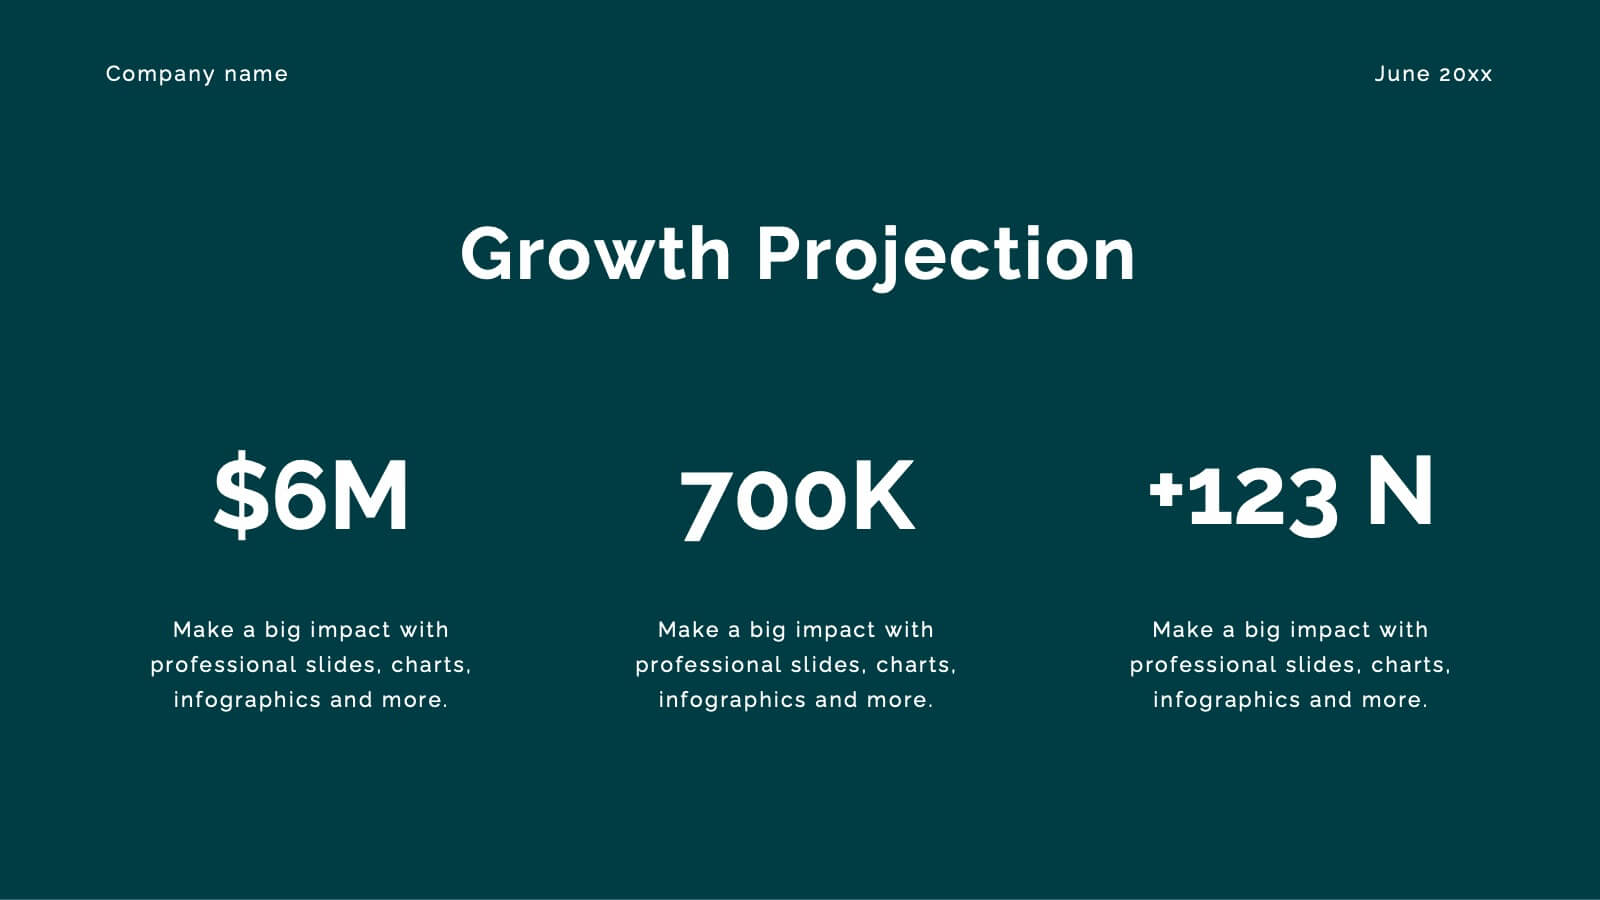
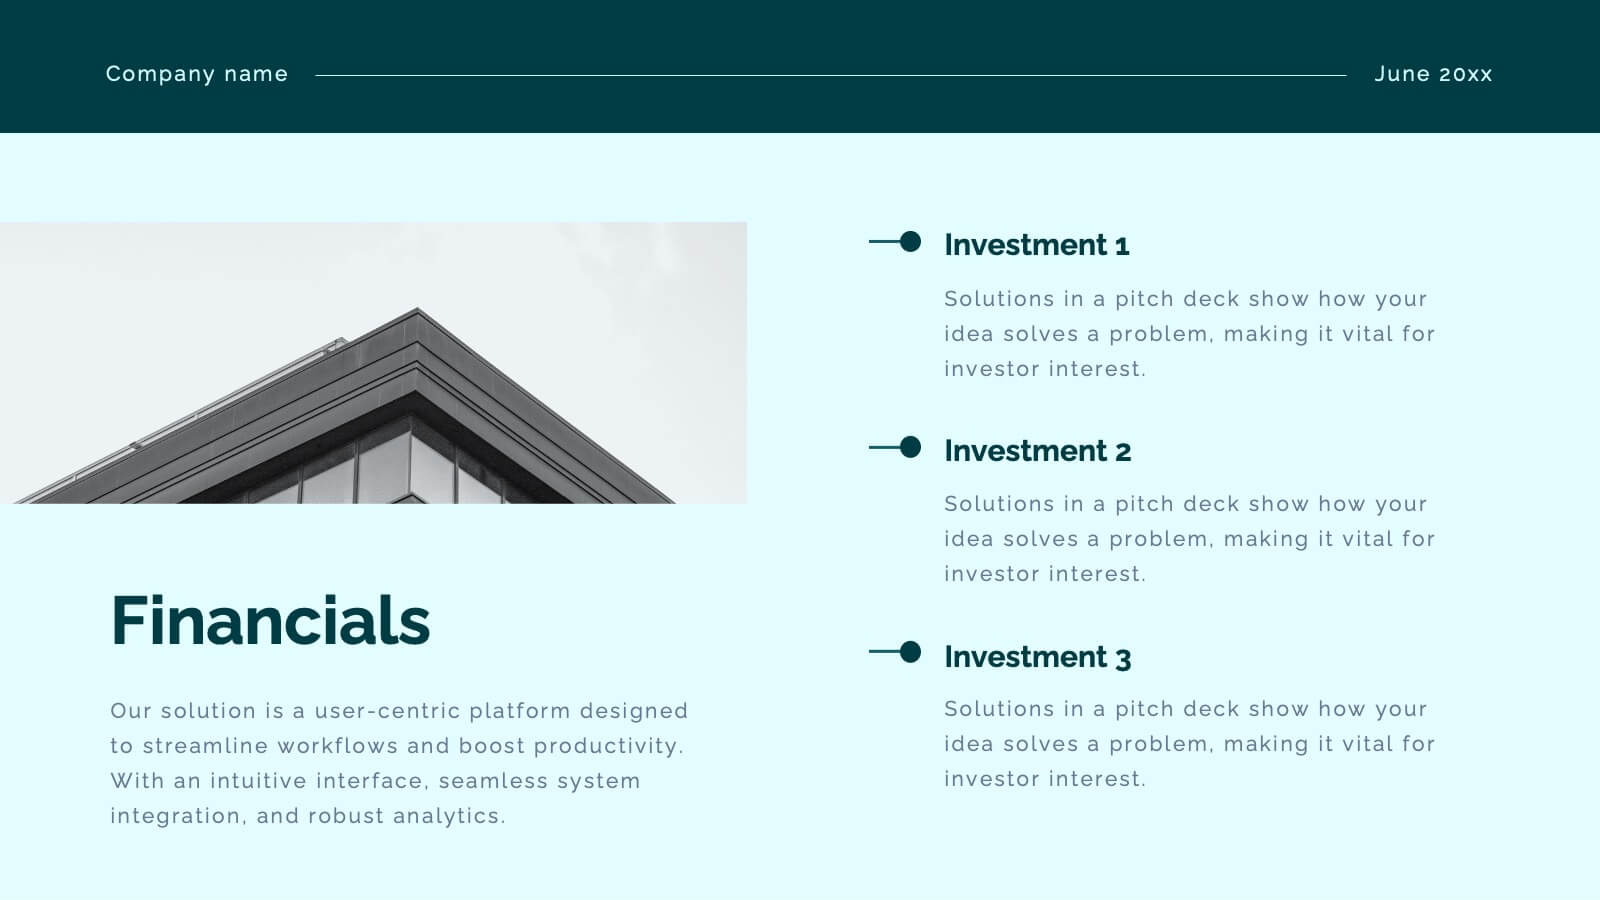
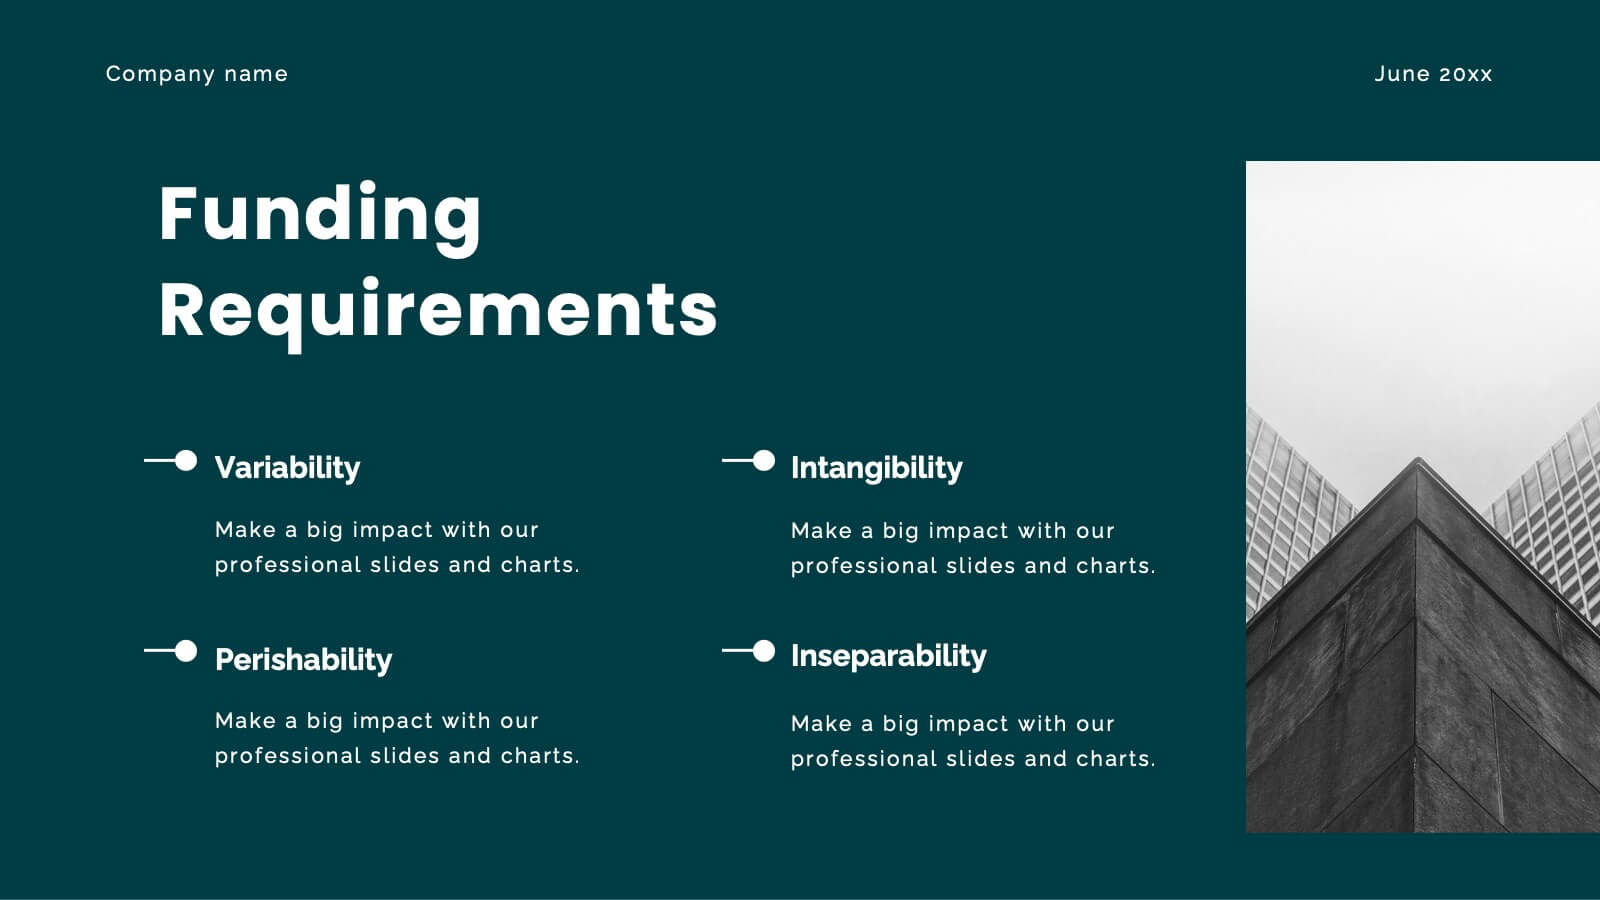
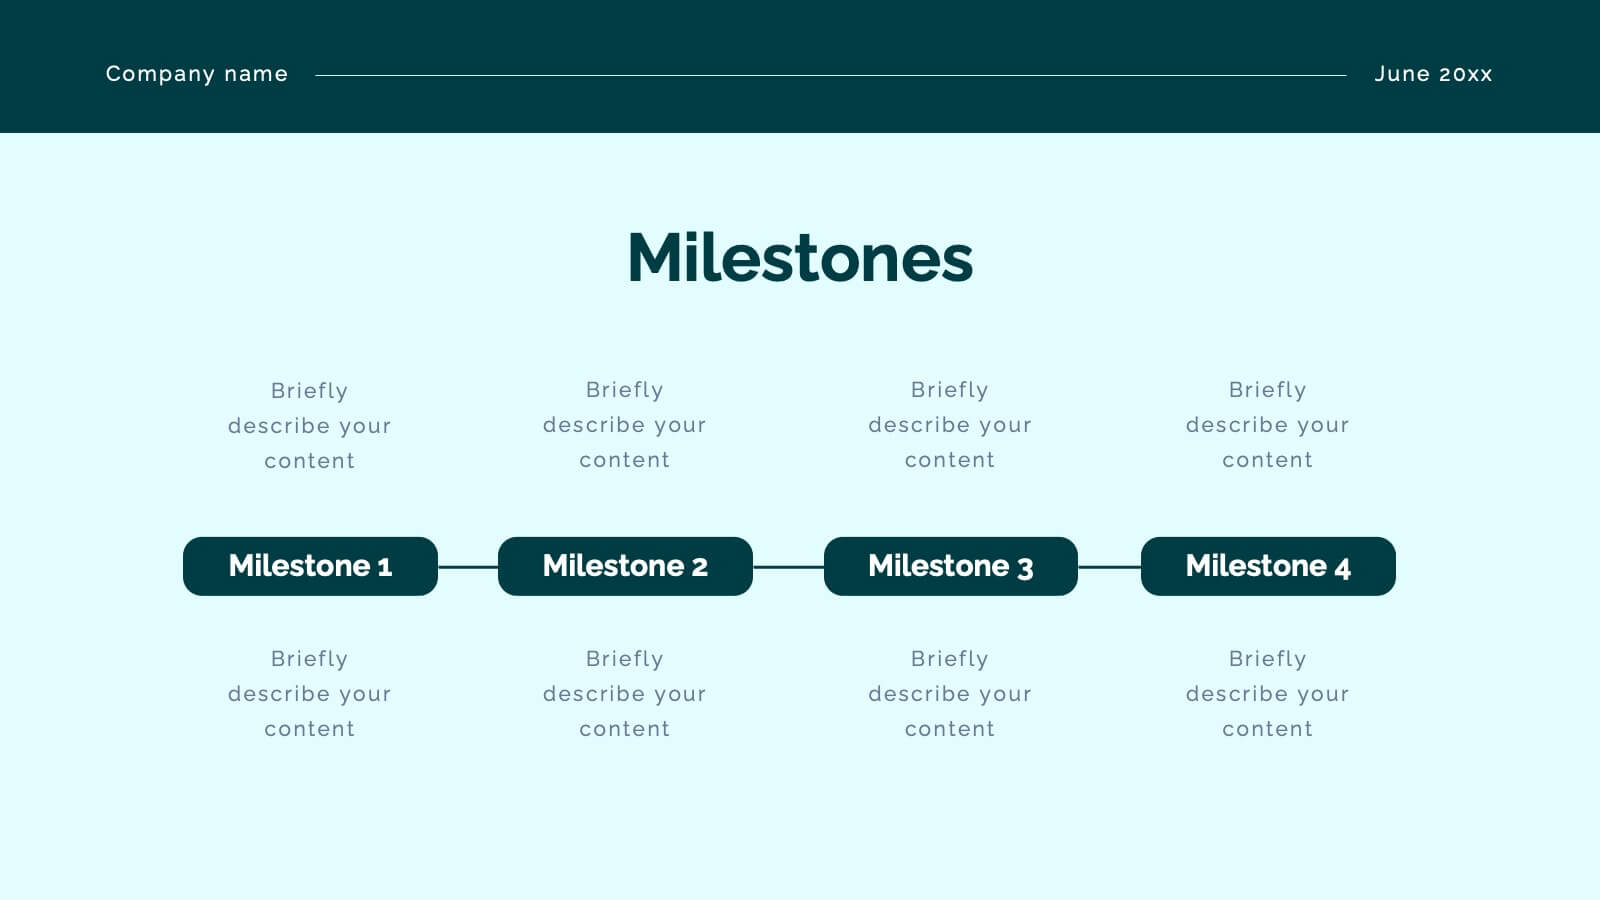
Mythion Business Idea Pitch Deck Presentation
Communicate your business vision with clarity and impact using this comprehensive pitch deck presentation template. Perfect for entrepreneurs, startups, and innovators, this template is designed to help you effectively present your idea to investors, stakeholders, or partners. Cover every essential aspect of your business journey with slides dedicated to the problem statement, solutions, market overview, and target audience. Showcase your business model, revenue projections, and unique selling proposition with visually appealing layouts. Highlight your marketing strategy, growth projections, and funding requirements to build a strong, persuasive case. Fully customizable and compatible with PowerPoint, Google Slides, and Keynote, this template allows you to tailor each slide to suit your business identity and goals. Whether you're pitching a new idea or seeking investment, this template ensures you present with professionalism and confidence.

23 diapositivas
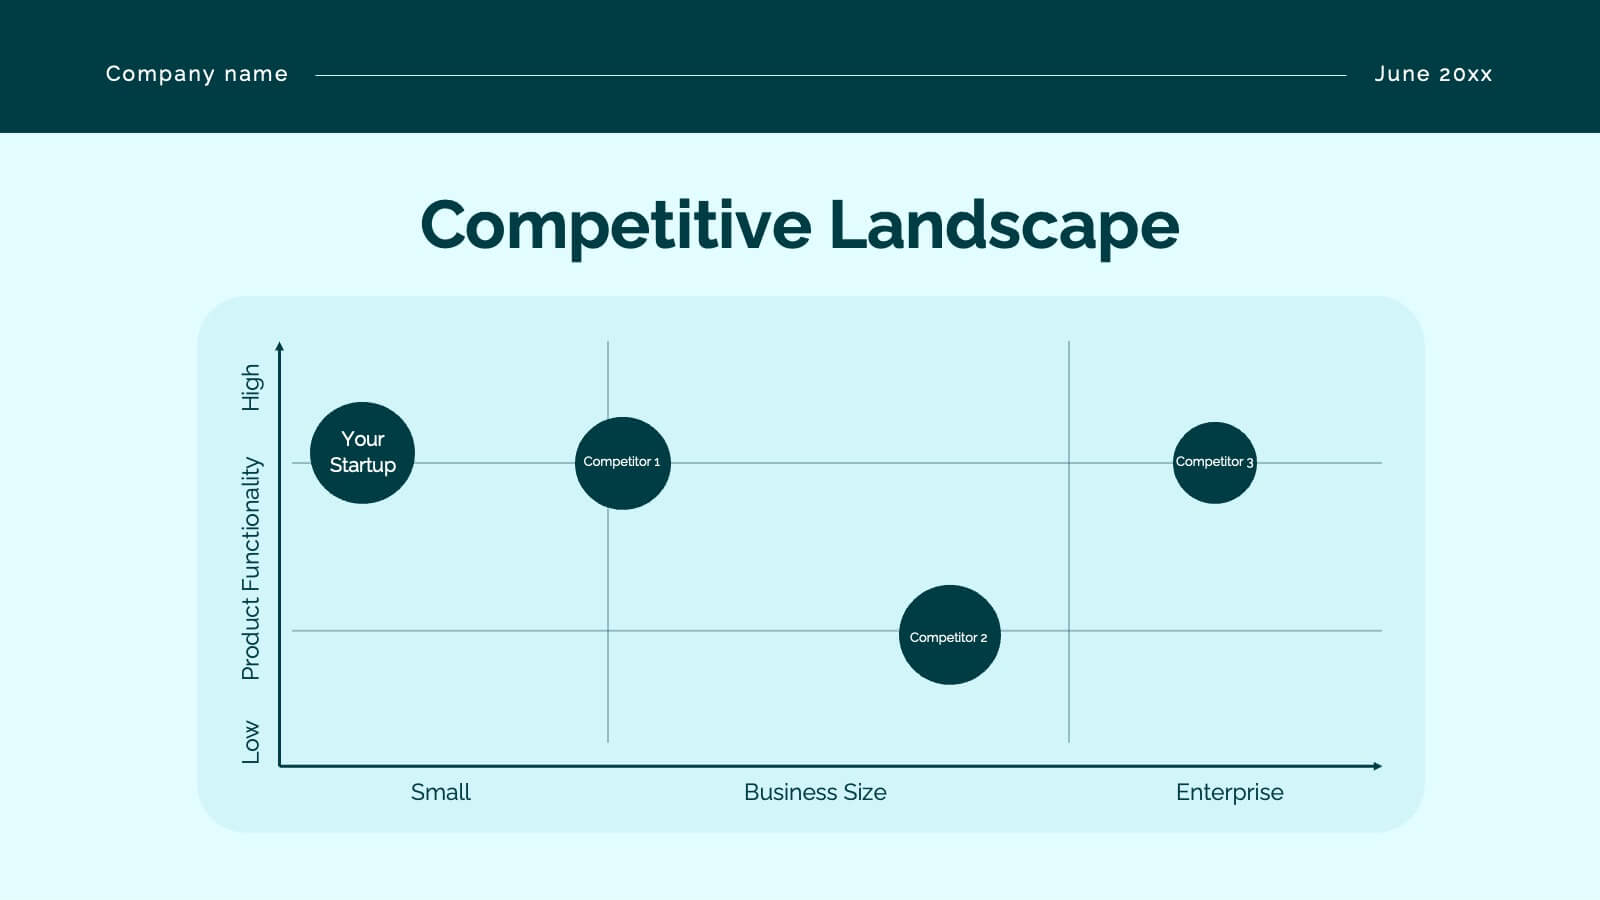
Crest Investor Pitch Presentation Presentation
Unleash your potential with this powerful pitch deck template! Tailored for presenting innovative business ideas, it features slides for company overview, market opportunity, competitive landscape, and financial projections. Clearly communicate your value proposition and impress investors with professional design and concise content. Compatible with PowerPoint, Keynote, and Google Slides for seamless presentations on any platform.


5 diapositivas
Employee Onboarding Training Roadmap Presentation
Visualize your training journey with the Employee Onboarding Training Roadmap Presentation. This layout uses a road-style timeline with trucks to represent each step of the onboarding process—perfect for outlining key milestones, training modules, or departmental introductions. Fully editable in PowerPoint, Keynote, Google Slides, or Canva.


4 diapositivas
SaaS Pricing Comparison Chart Presentation
Make pricing comparisons exciting with this bold, side-by-side layout designed to instantly spotlight key differences. Whether you’re showcasing SaaS plans or product tiers, this chart template lets you present value and features clearly. Fully editable and easy to customize in PowerPoint, Keynote, and Google Slides for polished pricing presentations.