


Características


¿Tienes alguna pregunta?
Recomendar


7 diapositivas
Investment Group Infographic
An investment group, is a collective of individuals or entities that pool their financial resources to invest in various financial instruments or assets. This infographic template is a high-octane journey through the dynamic world of investments, designed to empower and energize your financial understanding. Prepare to take you audience through a thrilling ride through the investment cosmos, where your money takes center stage and financial growth is the ultimate goal. This Investment Infographic isn't just about numbers and charts, it's a thrilling expedition through the realms of finance.


6 diapositivas
Onboarding 30-60-90 Day Roadmap Presentation
Get your team excited from day one with this colorful, easy-to-follow visual layout! This presentation template helps clearly map out onboarding goals and key activities across 30, 60, and 90 days. Perfect for HR professionals and team leads, it's fully editable and works with PowerPoint, Keynote, and Google Slides.


4 diapositivas
Work From Home Bests Practices Presentation
Bring remote work to life with a clean, modern layout that helps teams stay focused, organized, and productive. This presentation highlights key habits, routines, and strategies for working efficiently from home, offering clear visuals that simplify every point. Fully editable and compatible with PowerPoint, Keynote, and Google Slides.


10 diapositivas
Financial Investment Strategy Presentation
Bring your financial ideas together with a clean, puzzle-style layout that instantly makes complex strategies feel organized and actionable. This presentation helps you explain key components, compare performance drivers, and present investment plans with clarity and confidence. Easy to edit and fully compatible with PowerPoint, Keynote, and Google Slides.


7 diapositivas
Value Chain Infographic Presentation Template
The five primary activities of the value chain are: inbound logistics, operations, outbound logistics, marketing and sales, service. It is made up of four secondary activities: firm infrastructure, human resource management, technology development and procurement. The value chain is a tool for evaluating how a business operates. With this value chain template, you'll be able to identify various links in the value chain, and determine where an opportunity for product differentiation exists. This template helps lay out your actual value chain and identify where opportunities exist to improve.


6 diapositivas
North America Weather Map Infographics
Explore our customizable North America Weather Map infographic template, a valuable tool for understanding regional weather patterns. Compatible with PowerPoint, Keynote, and Google Slides, this template simplifies complex data into user-friendly visuals, allowing you to tailor it to your specific requirements. This infographic template offers a foundation for displaying current and historical weather data, temperature trends, precipitation patterns, and more. Whether you're a meteorologist, educator, or just curious, this template provides a versatile platform to create weather-related presentations that suit your unique needs. Impress your audience with this SEO-optimized North America Weather Map infographic template, designed for clarity and ease of use. Customize it to stay informed, plan outdoor activities, and effectively communicate weather information. Get started with your customized infographic today!


5 diapositivas
Business Issue Root Cause Identification
Pinpoint the real reasons behind business challenges with this clear and visual layout. This root cause identification template breaks down effects and traces them back to their sources, making it easier to align your team and propose actionable solutions. Fully customizable in PowerPoint, Keynote, and Google Slides.


6 diapositivas
Modern Travel Infographic
Explore your story like a globe waiting to be spun, using this clean visual layout to highlight key destinations, ideas, or data points in a modern, travel-inspired flow. It’s perfect for simplifying complex information with style. Fully customizable and compatible with PowerPoint, Keynote, and Google Slides.


6 diapositivas
Project Summary Report Presentation
Enhance your project reviews with our "Project Summary Report Presentation" template. This slide is expertly designed to summarize key project aspects such as objectives, milestones, and outcomes, structured into sections labeled A, B, and C. Featuring an image of a collaborative team setting, the template underscores the essence of teamwork and productivity in project management. Each section is organized to clearly communicate your project’s progress and results to stakeholders. Ideal for project managers and teams, this template supports effective storytelling in project updates. Compatible with PowerPoint, Keynote, and Google Slides, it’s an essential tool for delivering impactful and organized project presentations.


10 diapositivas
Business Risk Management Framework Presentation
Elevate your risk analysis with the "Business Risk Management Framework" template, offering a dynamic and customizable approach to effectively present and evaluate risk data. It features various risk gauges and icons for visual representation, ensuring key insights are easily understandable. This template facilitates comprehensive risk analysis presentations and is compatible with PowerPoint, Keynote, and Google Slides.


4 diapositivas
Design and Project Work Samples Presentation
Showcase your creative projects with this visually structured layout. Featuring a bold title area and three image slots for key works, it’s perfect for portfolios, proposals, or pitch decks. Fully editable in PowerPoint, Keynote, and Google Slides to suit your brand and project presentation needs.
4 diapositivas
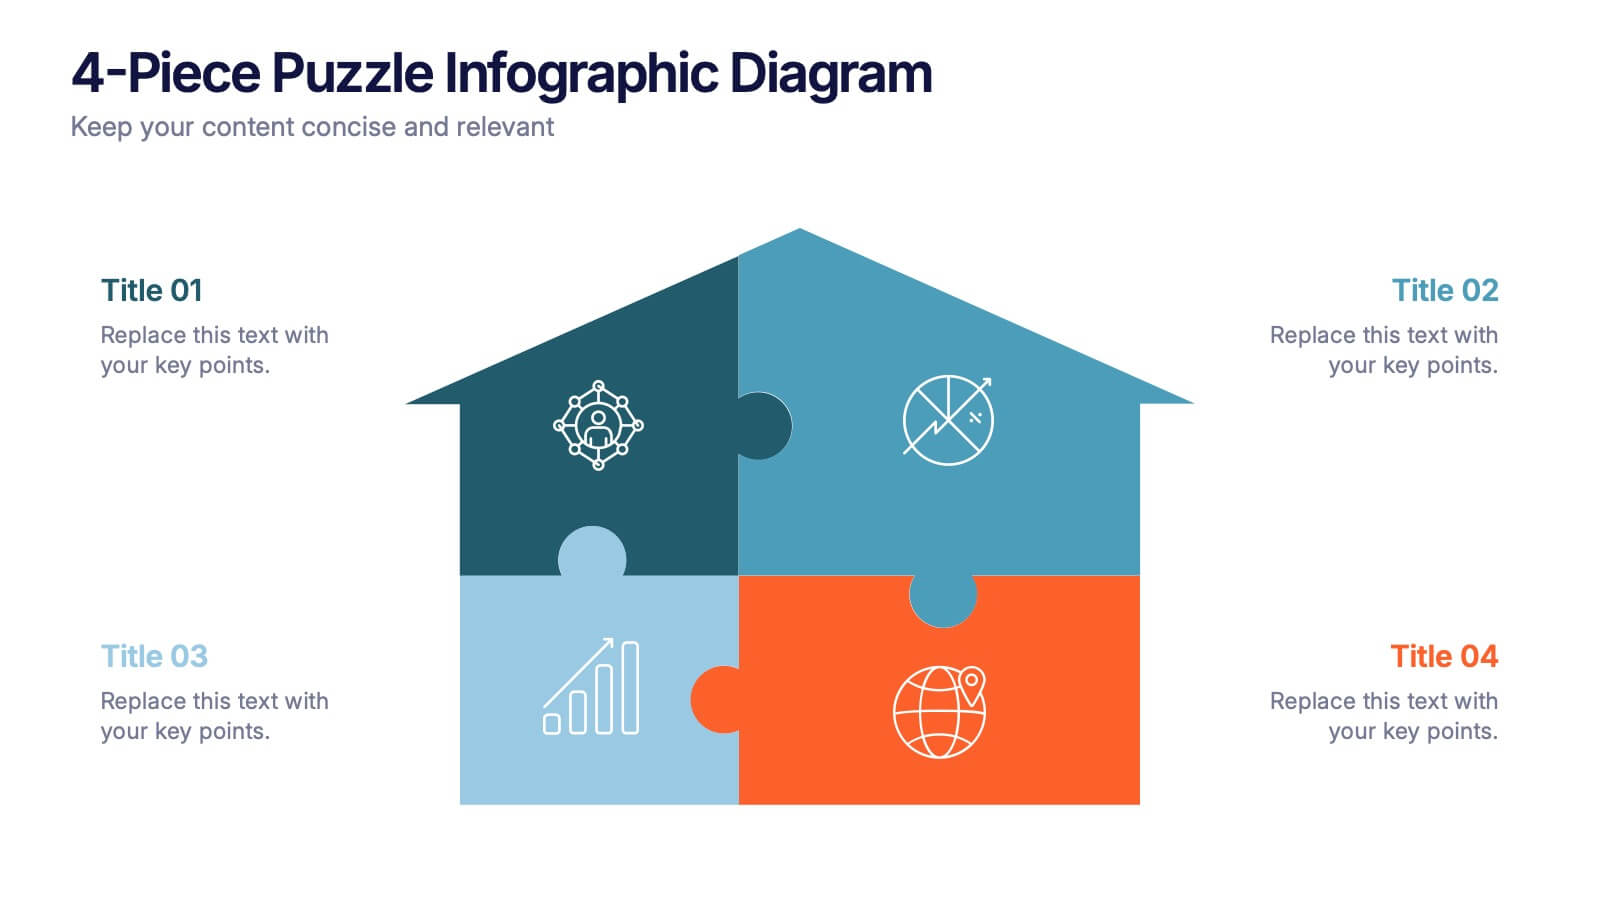
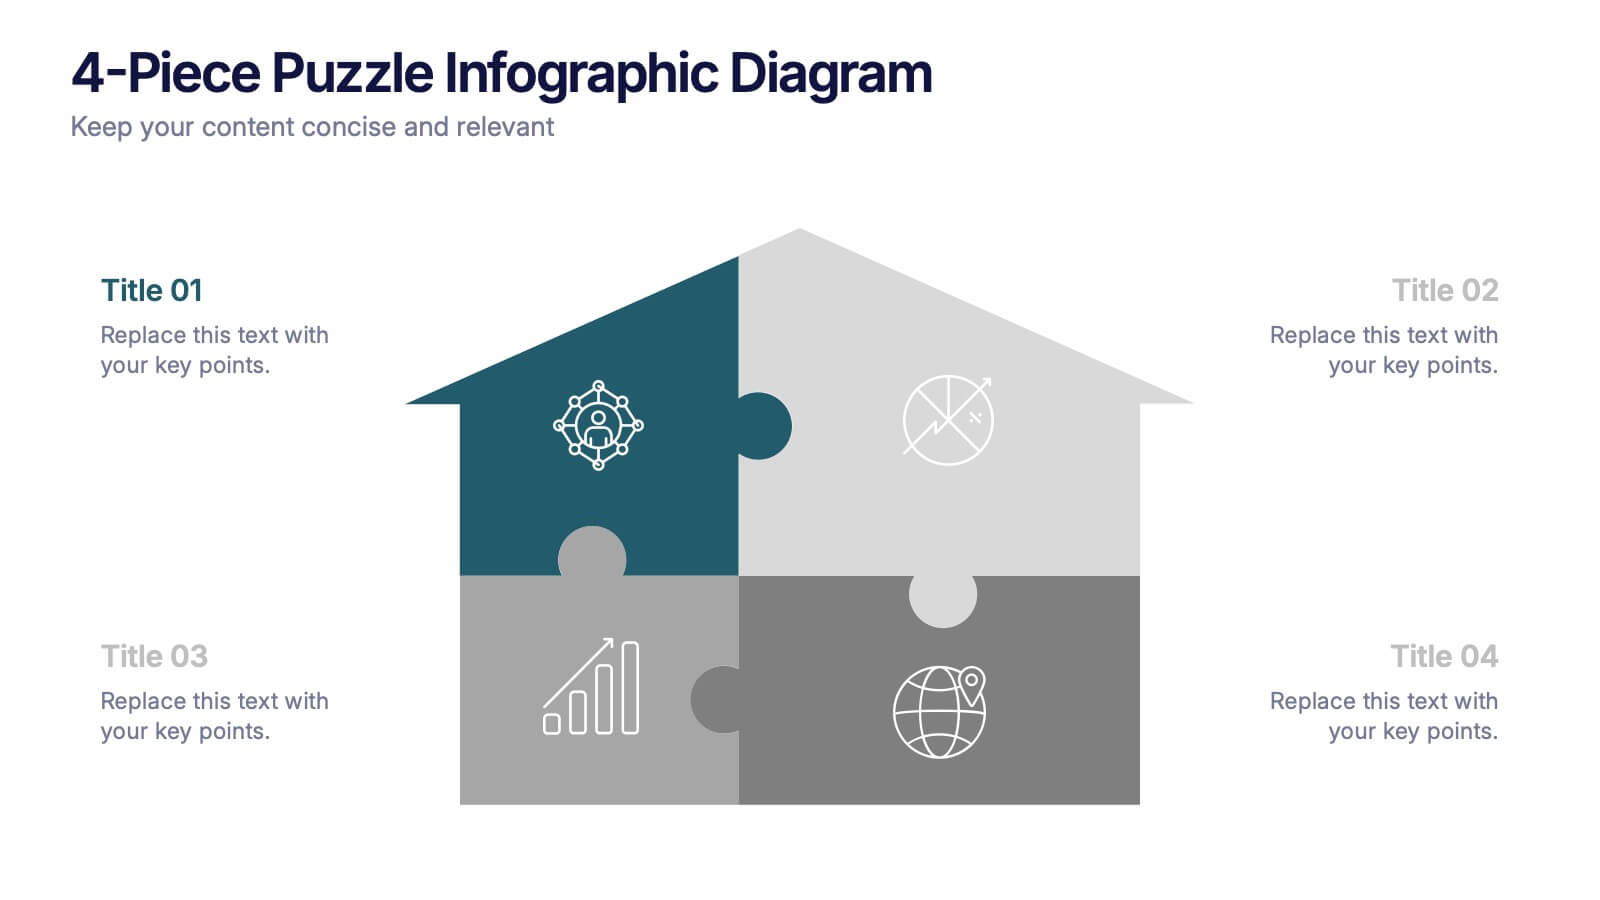
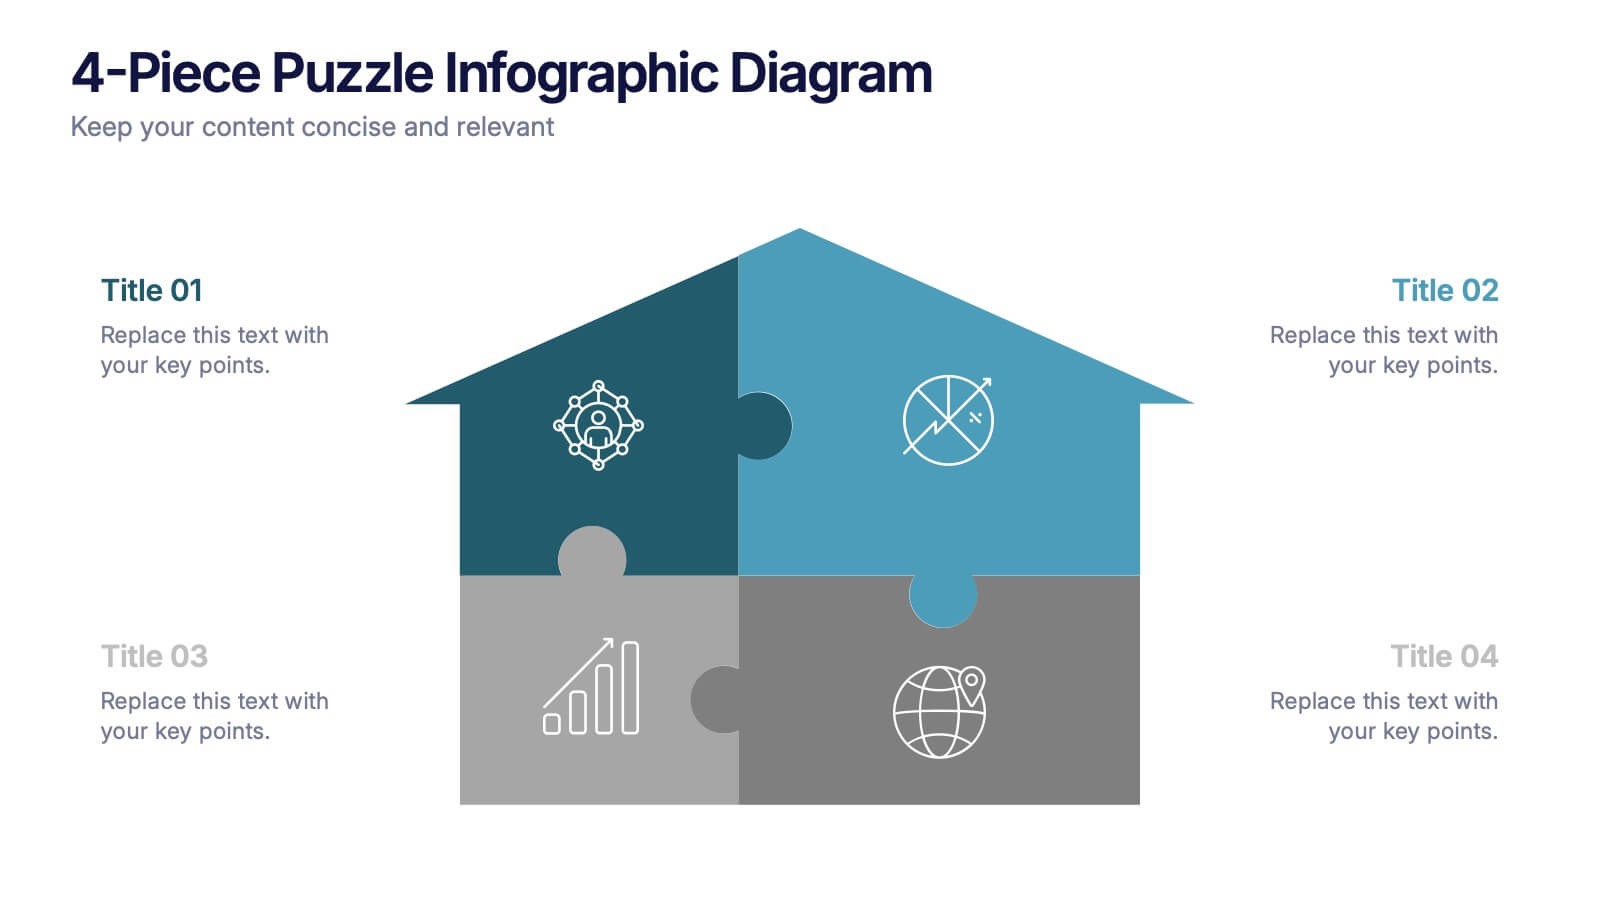
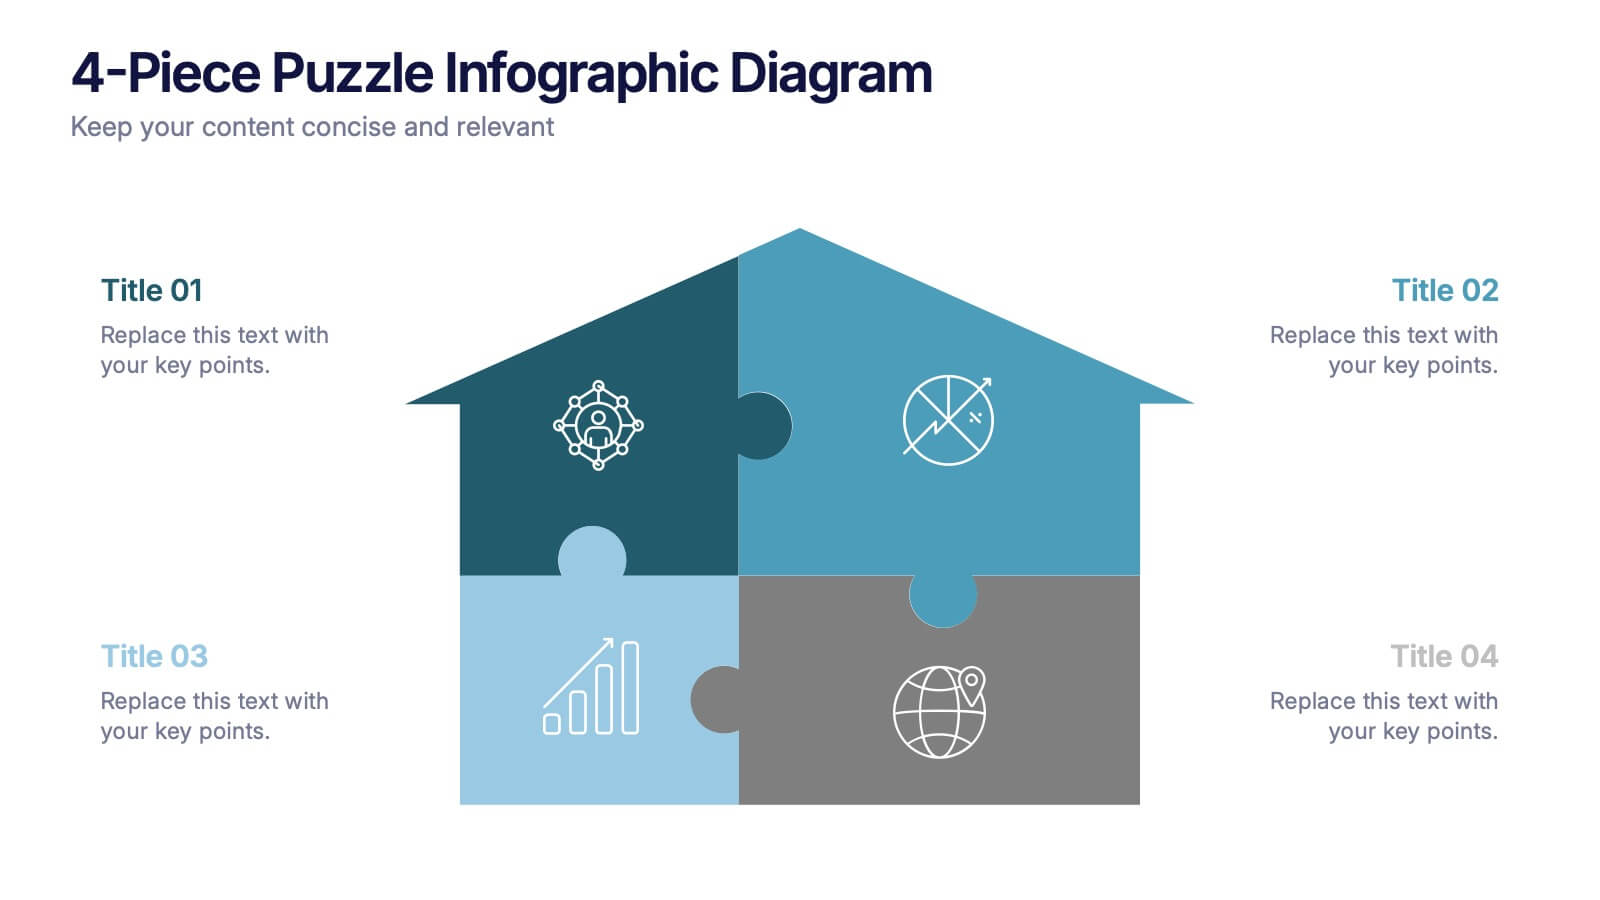
4-Piece Puzzle Infographic Diagram Presentation
Bring clarity and impact to your message with a visual layout that snaps big ideas together like a puzzle. This presentation helps you break complex concepts into four connected sections, making explanations easier and more engaging for any audience. Ideal for planning, insights, or strategy sessions. Fully compatible with PowerPoint, Keynote, and Google Slides.


7 diapositivas
Tables of Content Samples Infographic Presentation
A Table of Content is an essential tool that improves the accessibility and organization of a document or book, and enhances its overall professionalism. This table of contents template is an excellent way to organize your information. This template is fully editable, which allows you to easily change colors and fonts, and add or delete components from the design. The slides are designed to be easily updated with new information, allowing you to keep the presentation fresh and up-to-date. Each template has a high quality design that is compatible with powerpoint, Keynote and Google Slides.


6 diapositivas
Decision Tree Diagrams Presentation
Turn complex choices into clear, visual stories with this clean and modern template. Perfect for illustrating outcomes, decision paths, or process options, it helps you communicate strategy and logic with confidence. Fully customizable and compatible with PowerPoint, Keynote, and Google Slides for seamless professional presentations.


4 diapositivas
Financial Table Layout Presentation
Bring your numbers to life with a clear, colorful layout that makes financial details easy to compare at a glance. This presentation helps you organize pricing tiers, budget insights, or account summaries with clean structure and smooth readability. Fully compatible with PowerPoint, Keynote, and Google Slides.


7 diapositivas
Relationship Connectivity Infographic
The Relationship Connectivity Infographic provides a structured visualization to represent the interconnectedness of various elements within a system or project. This graphic organizes components into a cohesive layout that highlights how each part is related to and impacts the others. Ideal for demonstrating the complex synergy between different departments, phases of a project, or any scenario requiring a clear display of relationships, this infographic serves as an essential tool for planners, educators, and managers. It is designed to be user-friendly and is compatible with a range of platforms, including PowerPoint, Google Slides, and Keynote, making it easily customizable.


6 diapositivas
Gantt Chart for Project Phasing Presentation
Plan and visualize your timeline effortlessly with this Gantt Chart for Project Phasing presentation. Ideal for breaking down tasks by month, this template helps you communicate project stages, team responsibilities, and key milestones clearly. Fully editable in Canva, PowerPoint, and Google Slides—customize colors, titles, and durations to match your workflow.