


Características


¿Tienes alguna pregunta?
Recomendar


7 diapositivas
Personal Roadmap Infographic
A personal roadmap infographic is a visual representation of an individual's goals, plans, achievements, and milestones over a specific period. Embark on a transformative journey through your life with our personal roadmap infographic template. This is a grand adventure, and this visually engaging template is your map to navigate it with purpose and direction. This template is a graphical and often chronological display that helps an individual outline and track their personal development, progress, and objectives. This infographic is fully customizable and compatible with Powerpoint, Keynote, and Google Slides.


5 diapositivas
Workplace Safety Guidelines and Protocols Presentation
Prioritize health and hazard awareness with the Workplace Safety Guidelines and Protocols presentation. Featuring a clean visual of a segmented fire extinguisher, this design clearly breaks down safety measures into five customizable steps. Ideal for internal training, HR onboarding, or compliance meetings, each section is paired with editable titles and descriptive placeholders. Communicate procedures like emergency response, equipment use, or safety checklists effectively. Compatible with PowerPoint, Keynote, and Google Slides, this template ensures your team stays informed and aligned.


7 diapositivas
Tree Branch Diagram Infographic
The Tree Branch Diagram Infographic is a versatile template designed to showcase hierarchical information and relationships between different categories or levels of data. Its tree-like structure branches out from a central idea, making it ideal for visualizing organizational structures, decision trees, or classification systems. Each branch represents a unique segment of information, which can be further divided into sub-categories, providing a clear and comprehensive view of complex data. The design is user-friendly and adaptable, suitable for use in PowerPoint, Google Slides, and Keynote presentations.


8 diapositivas
Product Pricing Table Comparison Presentation
Showcase your product pricing options clearly with our 'Product Pricing Table Comparison' presentation template. This straightforward and efficient layout helps you display different price points and features across multiple packages, making it easy for your audience to compare and make informed choices. Ideal for sales presentations and marketing meetings, this template is compatible with PowerPoint, Keynote, and Google Slides.


5 diapositivas
Operational Planning in 5 Key Steps Presentation
Present your operational roadmap with this dynamic 5-step arrow diagram. Each line represents a strategic input streamlined toward a unified goal. Ideal for workflows, business processes, or implementation plans. Fully editable in PowerPoint, Keynote, and Google Slides—perfect for team planning, operations meetings, and project execution strategies.


4 diapositivas
Agile Workflow Presentation
Bring energy and motion to your process overview with a clean, loop-based flow that makes each stage easy to follow. This presentation is designed to clarify steps, illustrate iterations, and support clear decision-making for any project. Fully customizable and compatible with PowerPoint, Keynote, and Google Slides.


6 diapositivas
Travel Tips Infographic
By following travel tips, you can enhance your travel experience, mitigate potential challenges, and make the most of your adventures. This infographic template is designed to provide travelers with essential tips and guidelines for a successful and enjoyable trip. Whether you're planning a vacation, business trip, or backpacking adventure, this infographic offers valuable information to help you make the most out of your travel experience. This template is a valuable tool for enhancing travel experiences and ensuring a smooth and memorable trip. Compatible with Powerpoint, Keynote, and Google Slides.


6 diapositivas
Body Anatomy Infographic
Anatomy refers to the biological structures and systems that make up the body reproductive and organs, as well as other physiological unique features. This infographic template is a visual representation that provides information about the various structures and systems within the anatomy. This can be a valuable educational tool for understanding the anatomy and functions of reproductive and other related systems. This informative Anatomy Infographic can serve as a valuable resource for educational settings, healthcare professionals, and anyone interested in understanding the complexities of the body.


5 diapositivas
Impacts of Information Technology Infographics
Information Technology has had a profound impact on various aspects of society, including business, communication, education, healthcare, and entertainment. These infographic templates are designed to help you communicate complex technological concepts in a visually compelling way, making it suitable for IT professionals, businesses, or anyone interested in understanding and highlighting the transformative power of information technology. The template features a sleek design with customizable layouts, icons, and color schemes that can be adjusted to match your branding. It is compatible with PowerPoint, Keynote, and Google Slides.


6 diapositivas
Creative Alphabetic Infographic
Bring your message to life with a bright, alphabet-inspired layout that turns simple letters into eye-catching storytelling elements. This presentation is perfect for organizing steps, categories, or key ideas in a memorable way while keeping everything clear and structured. Fully editable and compatible with PowerPoint, Keynote, and Google Slides.


3 diapositivas
Digital Course Planning and LMS Strategy Presentation
Design your online courses like a pro with this clean, easy-to-follow visual. Ideal for mapping course flow, LMS strategy, and learner journeys, this presentation template breaks down complex processes into digestible steps. Fully customizable and compatible with PowerPoint, Keynote, and Google Slides for flexible e-learning presentation creation.


6 diapositivas
AIDA Communication Model Infographics
Embark on a journey through the AIDA Communication Model, a fundamental concept in marketing and advertising! This infographic serves as your guide to understanding how this powerful model can elevate your communication strategy. From capturing Attention and holding Interest to sparking Desire and driving Action, we unveil the secrets that make the AIDA model an indispensable tool. Delve into the art of holding the audience's interest. Discover methods to maintain engagement and curiosity as you convey your message. Learn how to keep your audience captivated and eager to learn more. With this engaging infographic, compatible with PowerPoint, Keynote, and Google Slides, sharing your understanding of the AIDA Communication Model becomes effortless. Empower yourself with the knowledge to enhance your marketing and advertising efforts. Dive into the world of AIDA and embark on a journey of effective communication and persuasion.


5 diapositivas
Geographic Distribution Heat Map Layout Presentation
Visualize regional trends at a glance with the Geographic Distribution Heat Map Layout Presentation. This template helps you showcase location-based performance, market presence, or demographic data across the U.S. using a clean gradient heat map. Ideal for sales reports, marketing reach, or expansion strategies. Fully editable in Canva, PowerPoint, Keynote, and Google Slides.


4 diapositivas
Investment Planning and Risk Guide
Simplify your financial presentation with the Investment Planning and Risk Guide Presentation. This 3-step visual layout walks viewers through the key stages of financial decision-making, from initial capital to potential return. Perfect for illustrating risk assessment, investment flow, or budgeting strategies. Fully editable in PowerPoint, Keynote, and Google Slides.


7 diapositivas
RACI Matrix Project Infographic
A RACI Matrix, sometimes referred to as a Responsibility Assignment Matrix, is a project management tool used to clarify and communicate the roles and responsibilities of team members in completing tasks and activities within a project. This is a visually captivating and informative template designed to demystify the complexities of project accountability. Navigate through the world of roles and responsibilities in a project setting with this dynamic and easily digestible visual aid. With this infographic your audience will journey toward effective project management and accountability with the RACI Matrix.


21 diapositivas
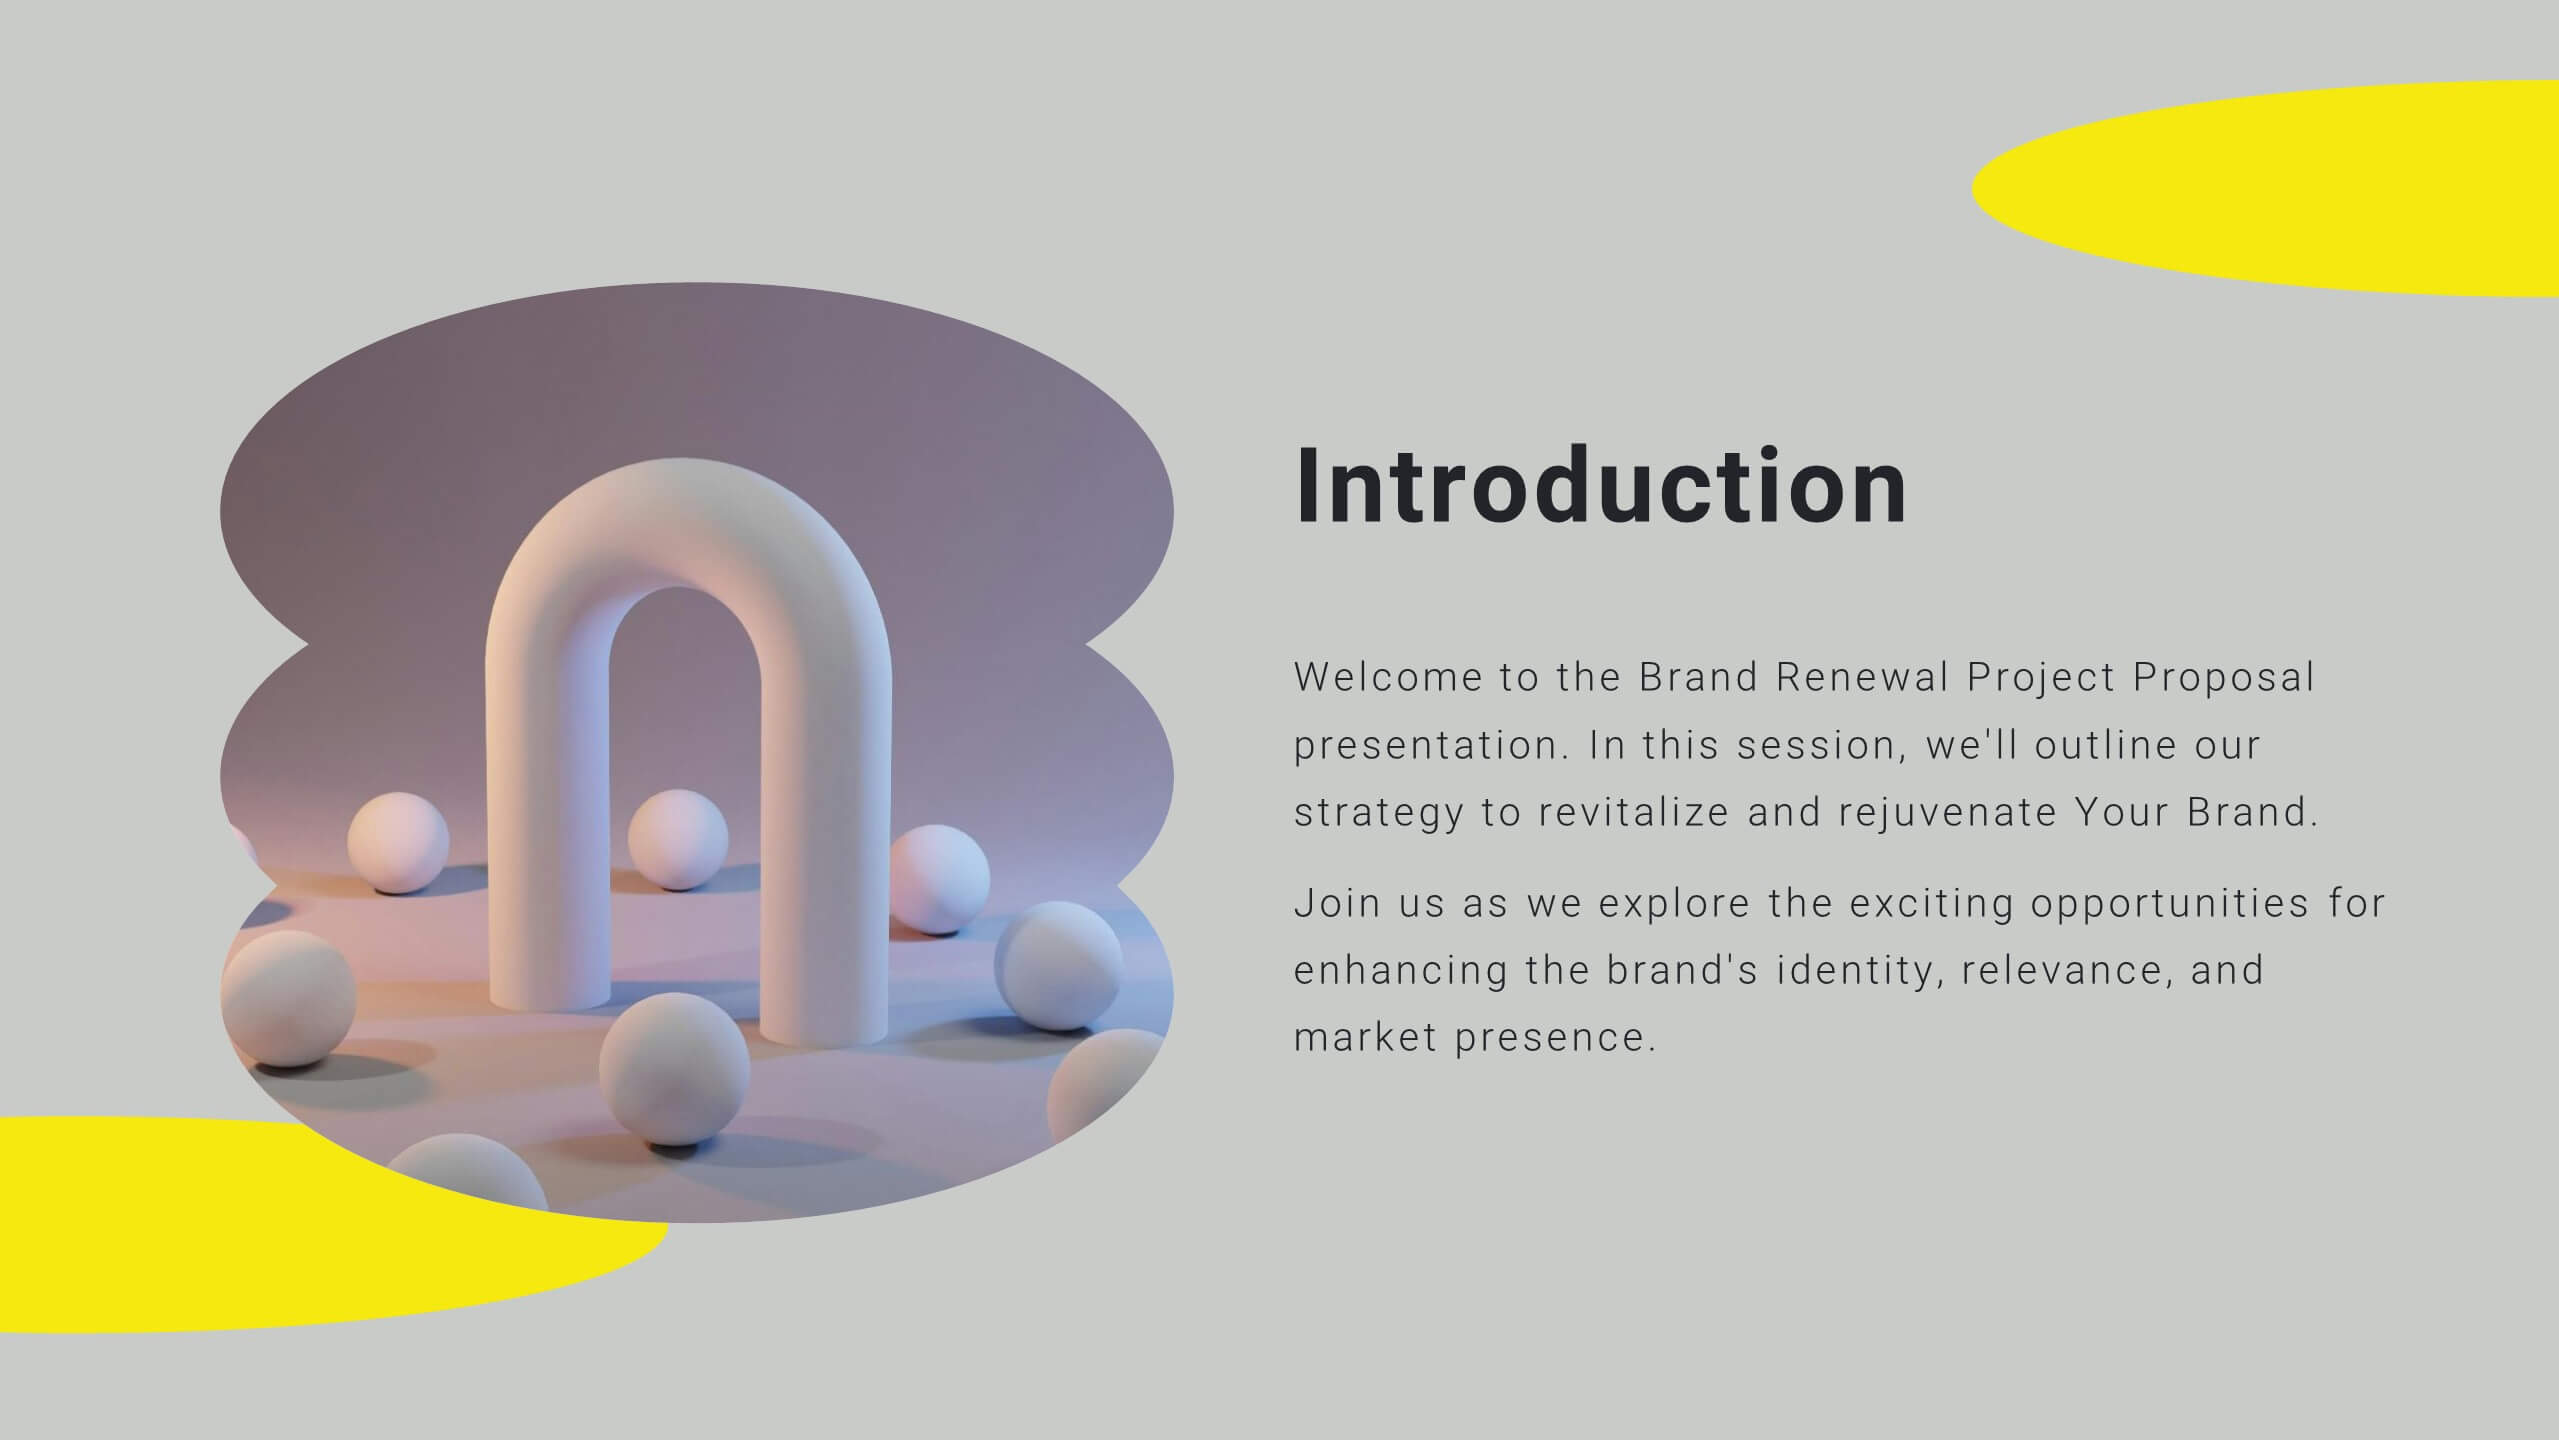
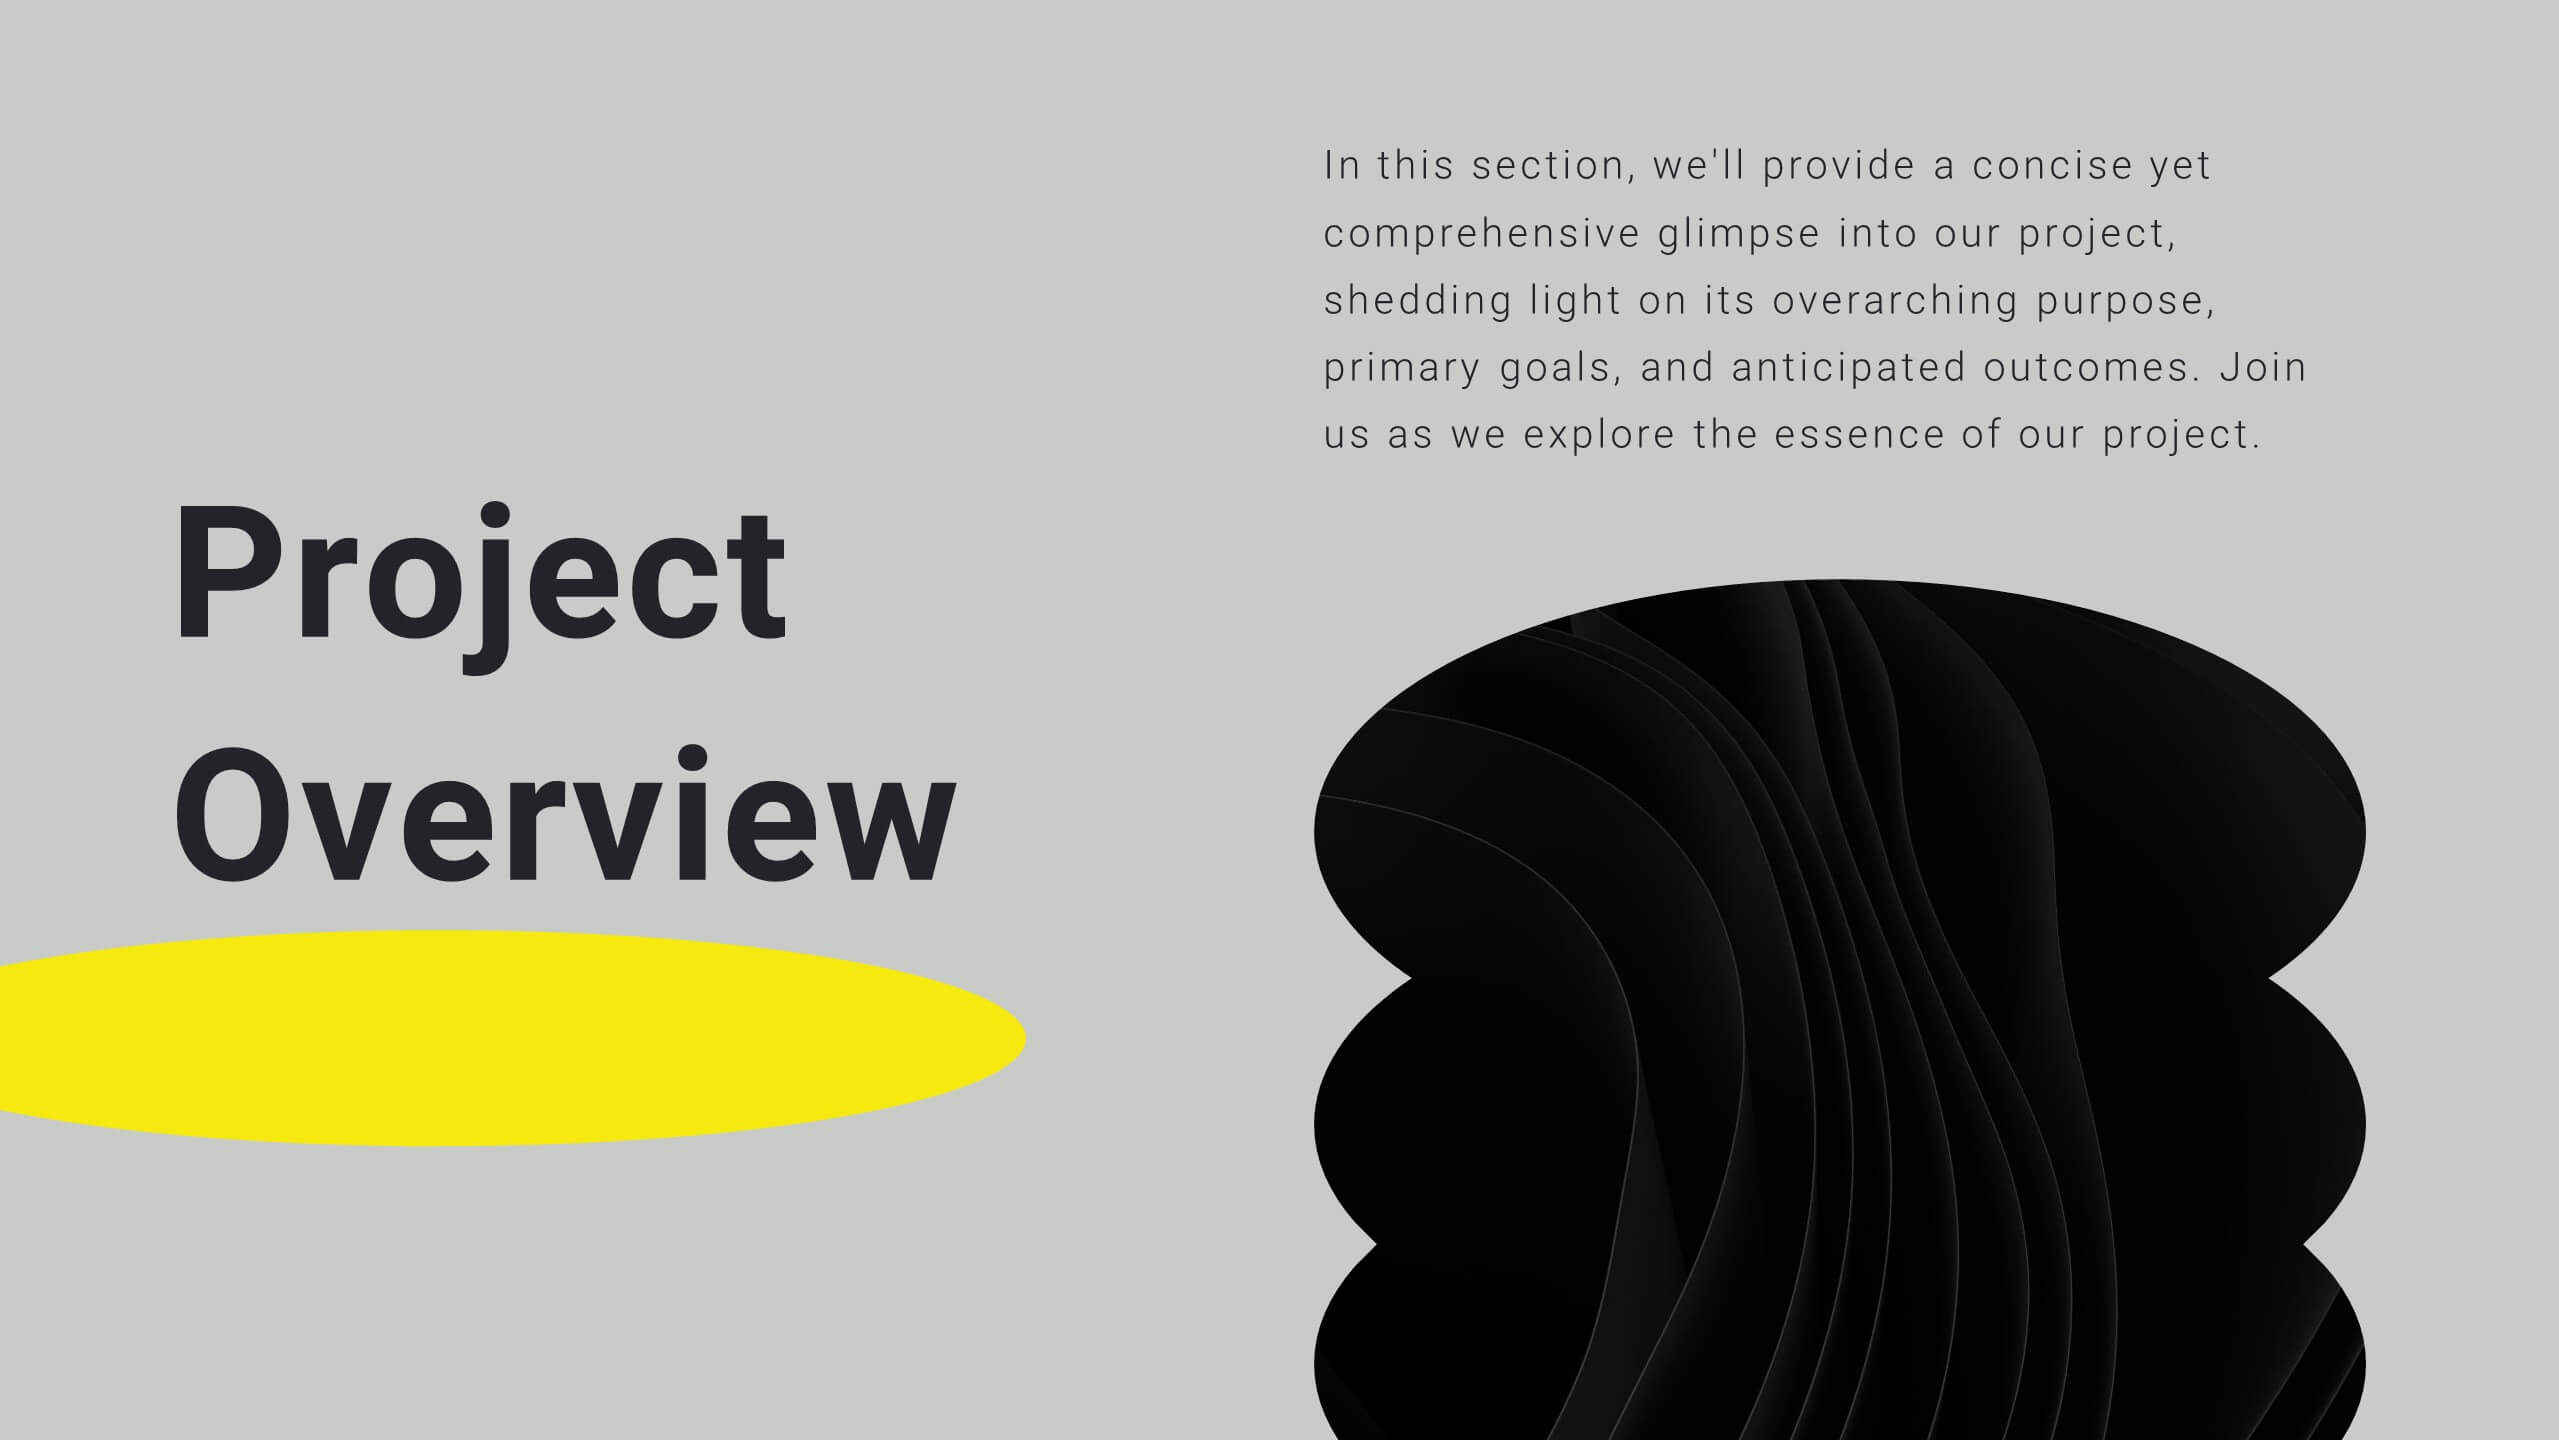
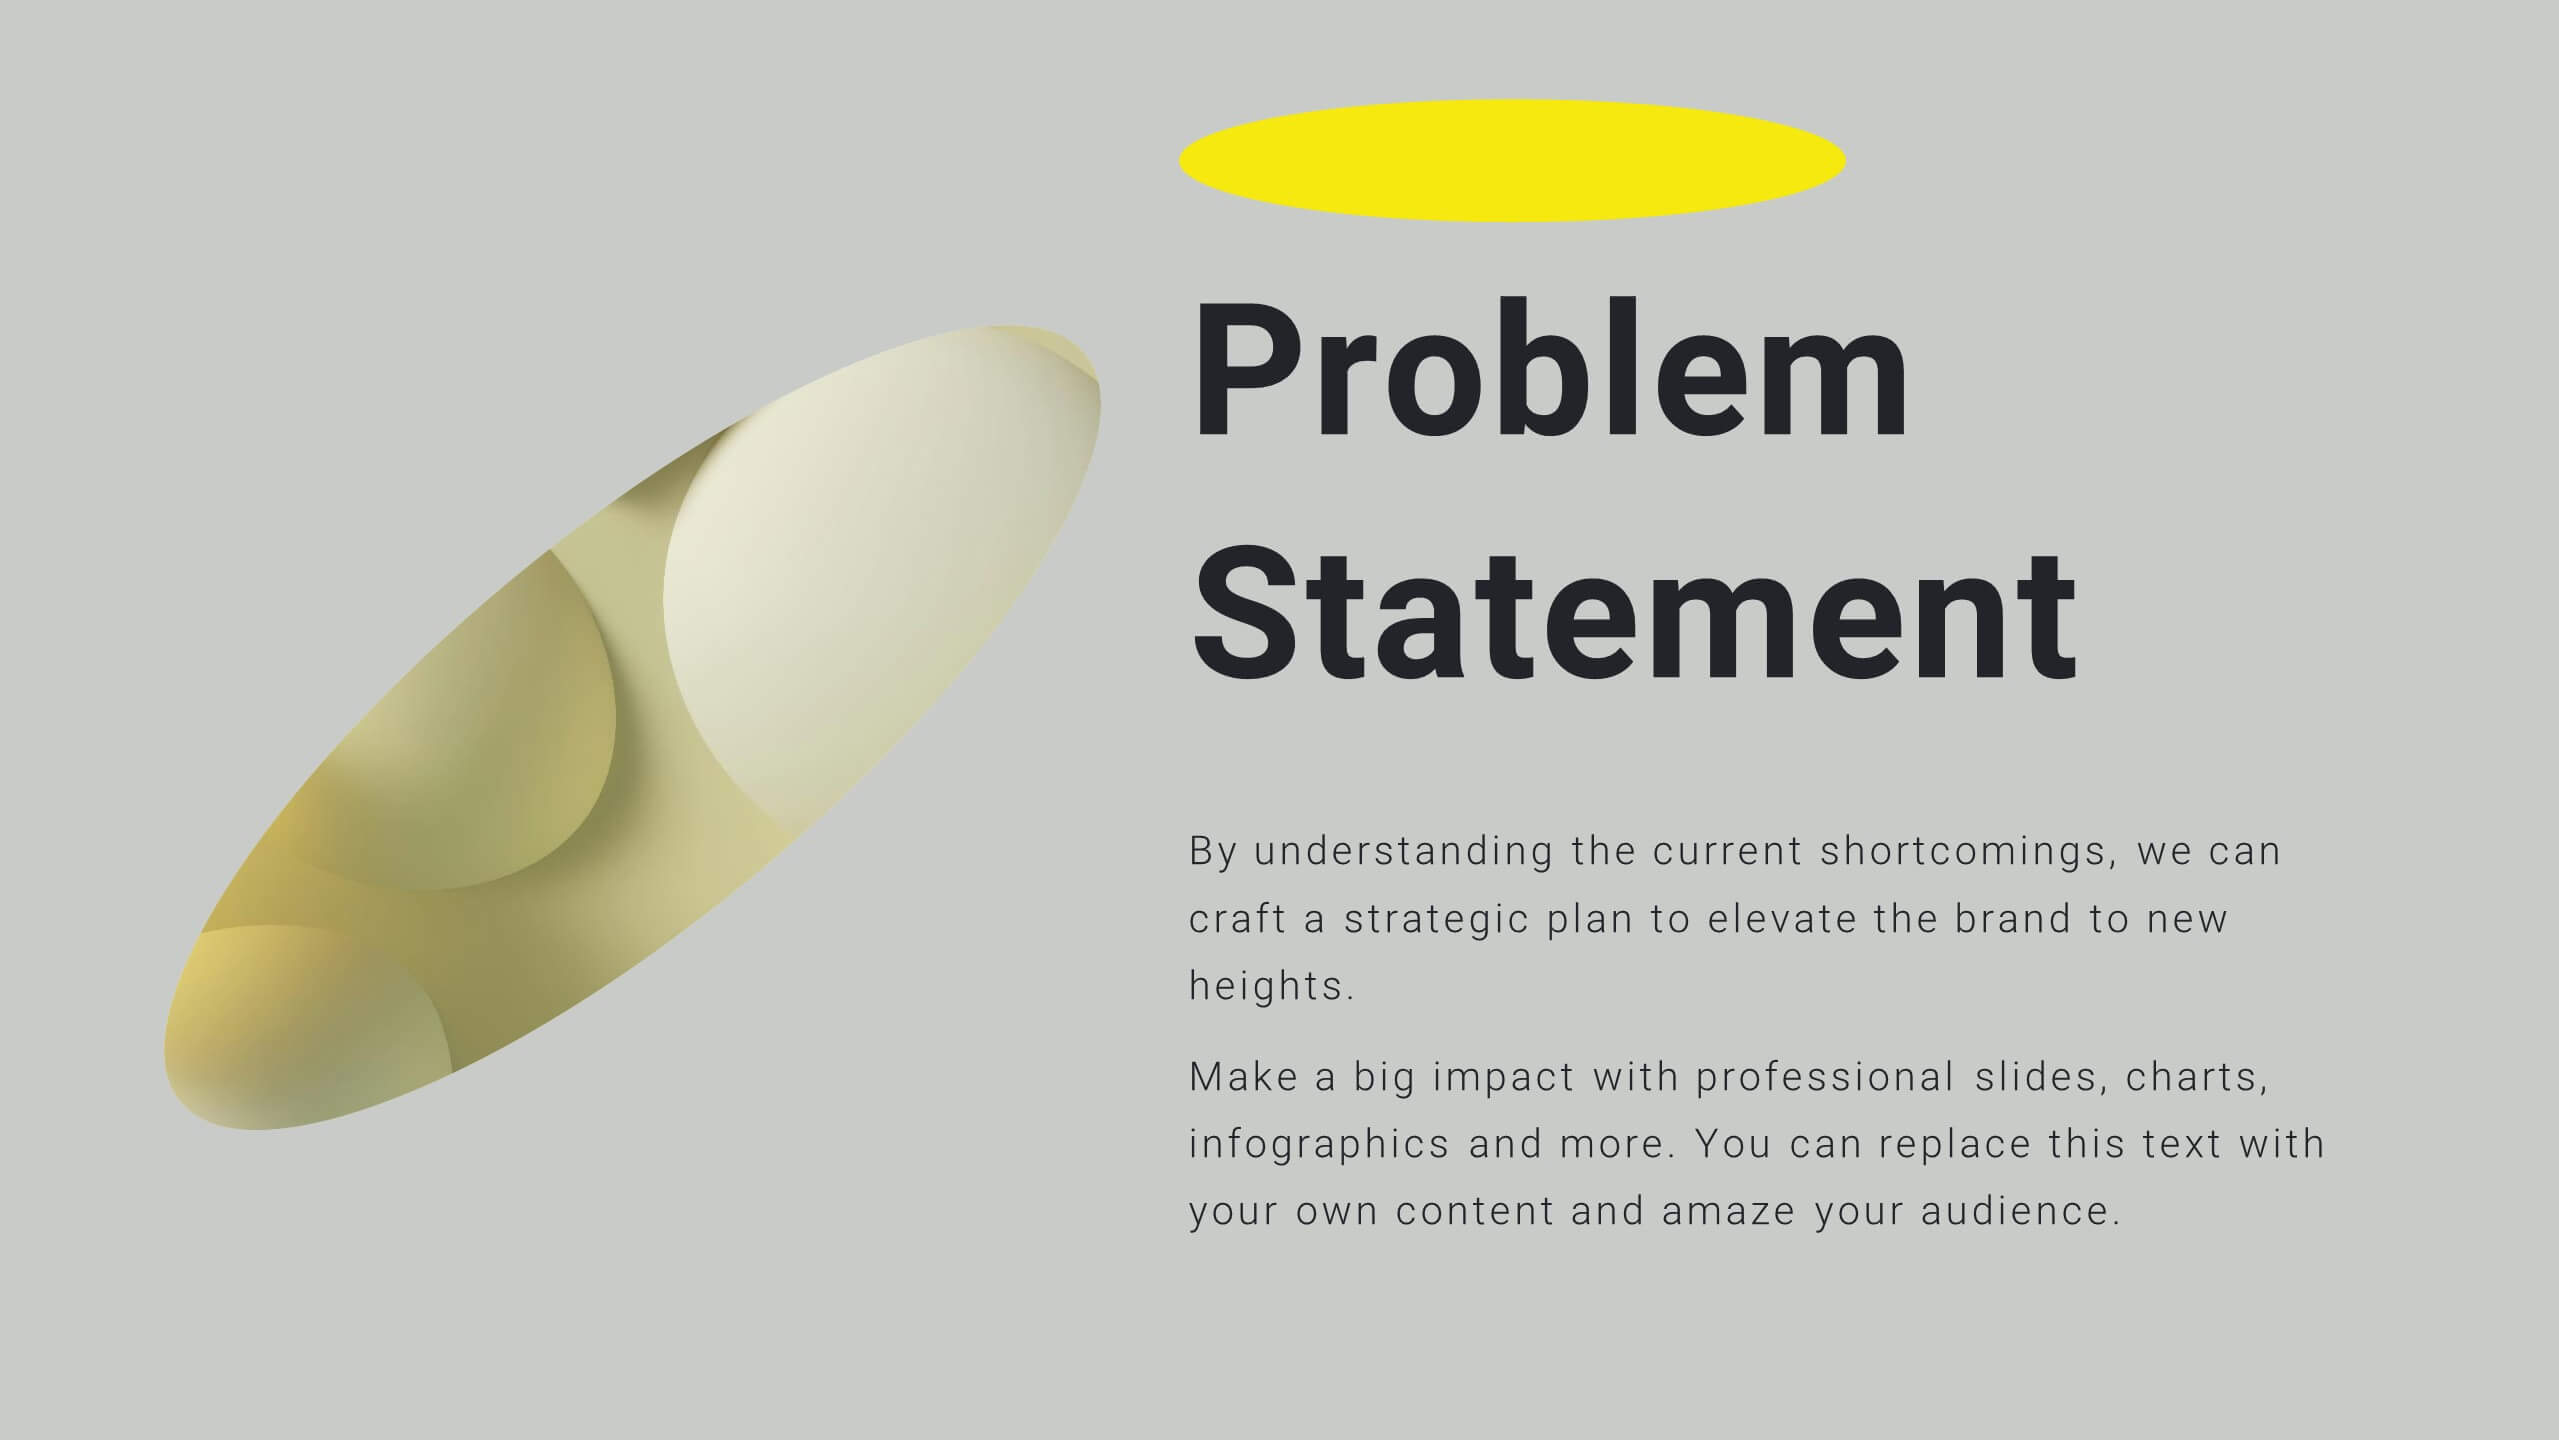
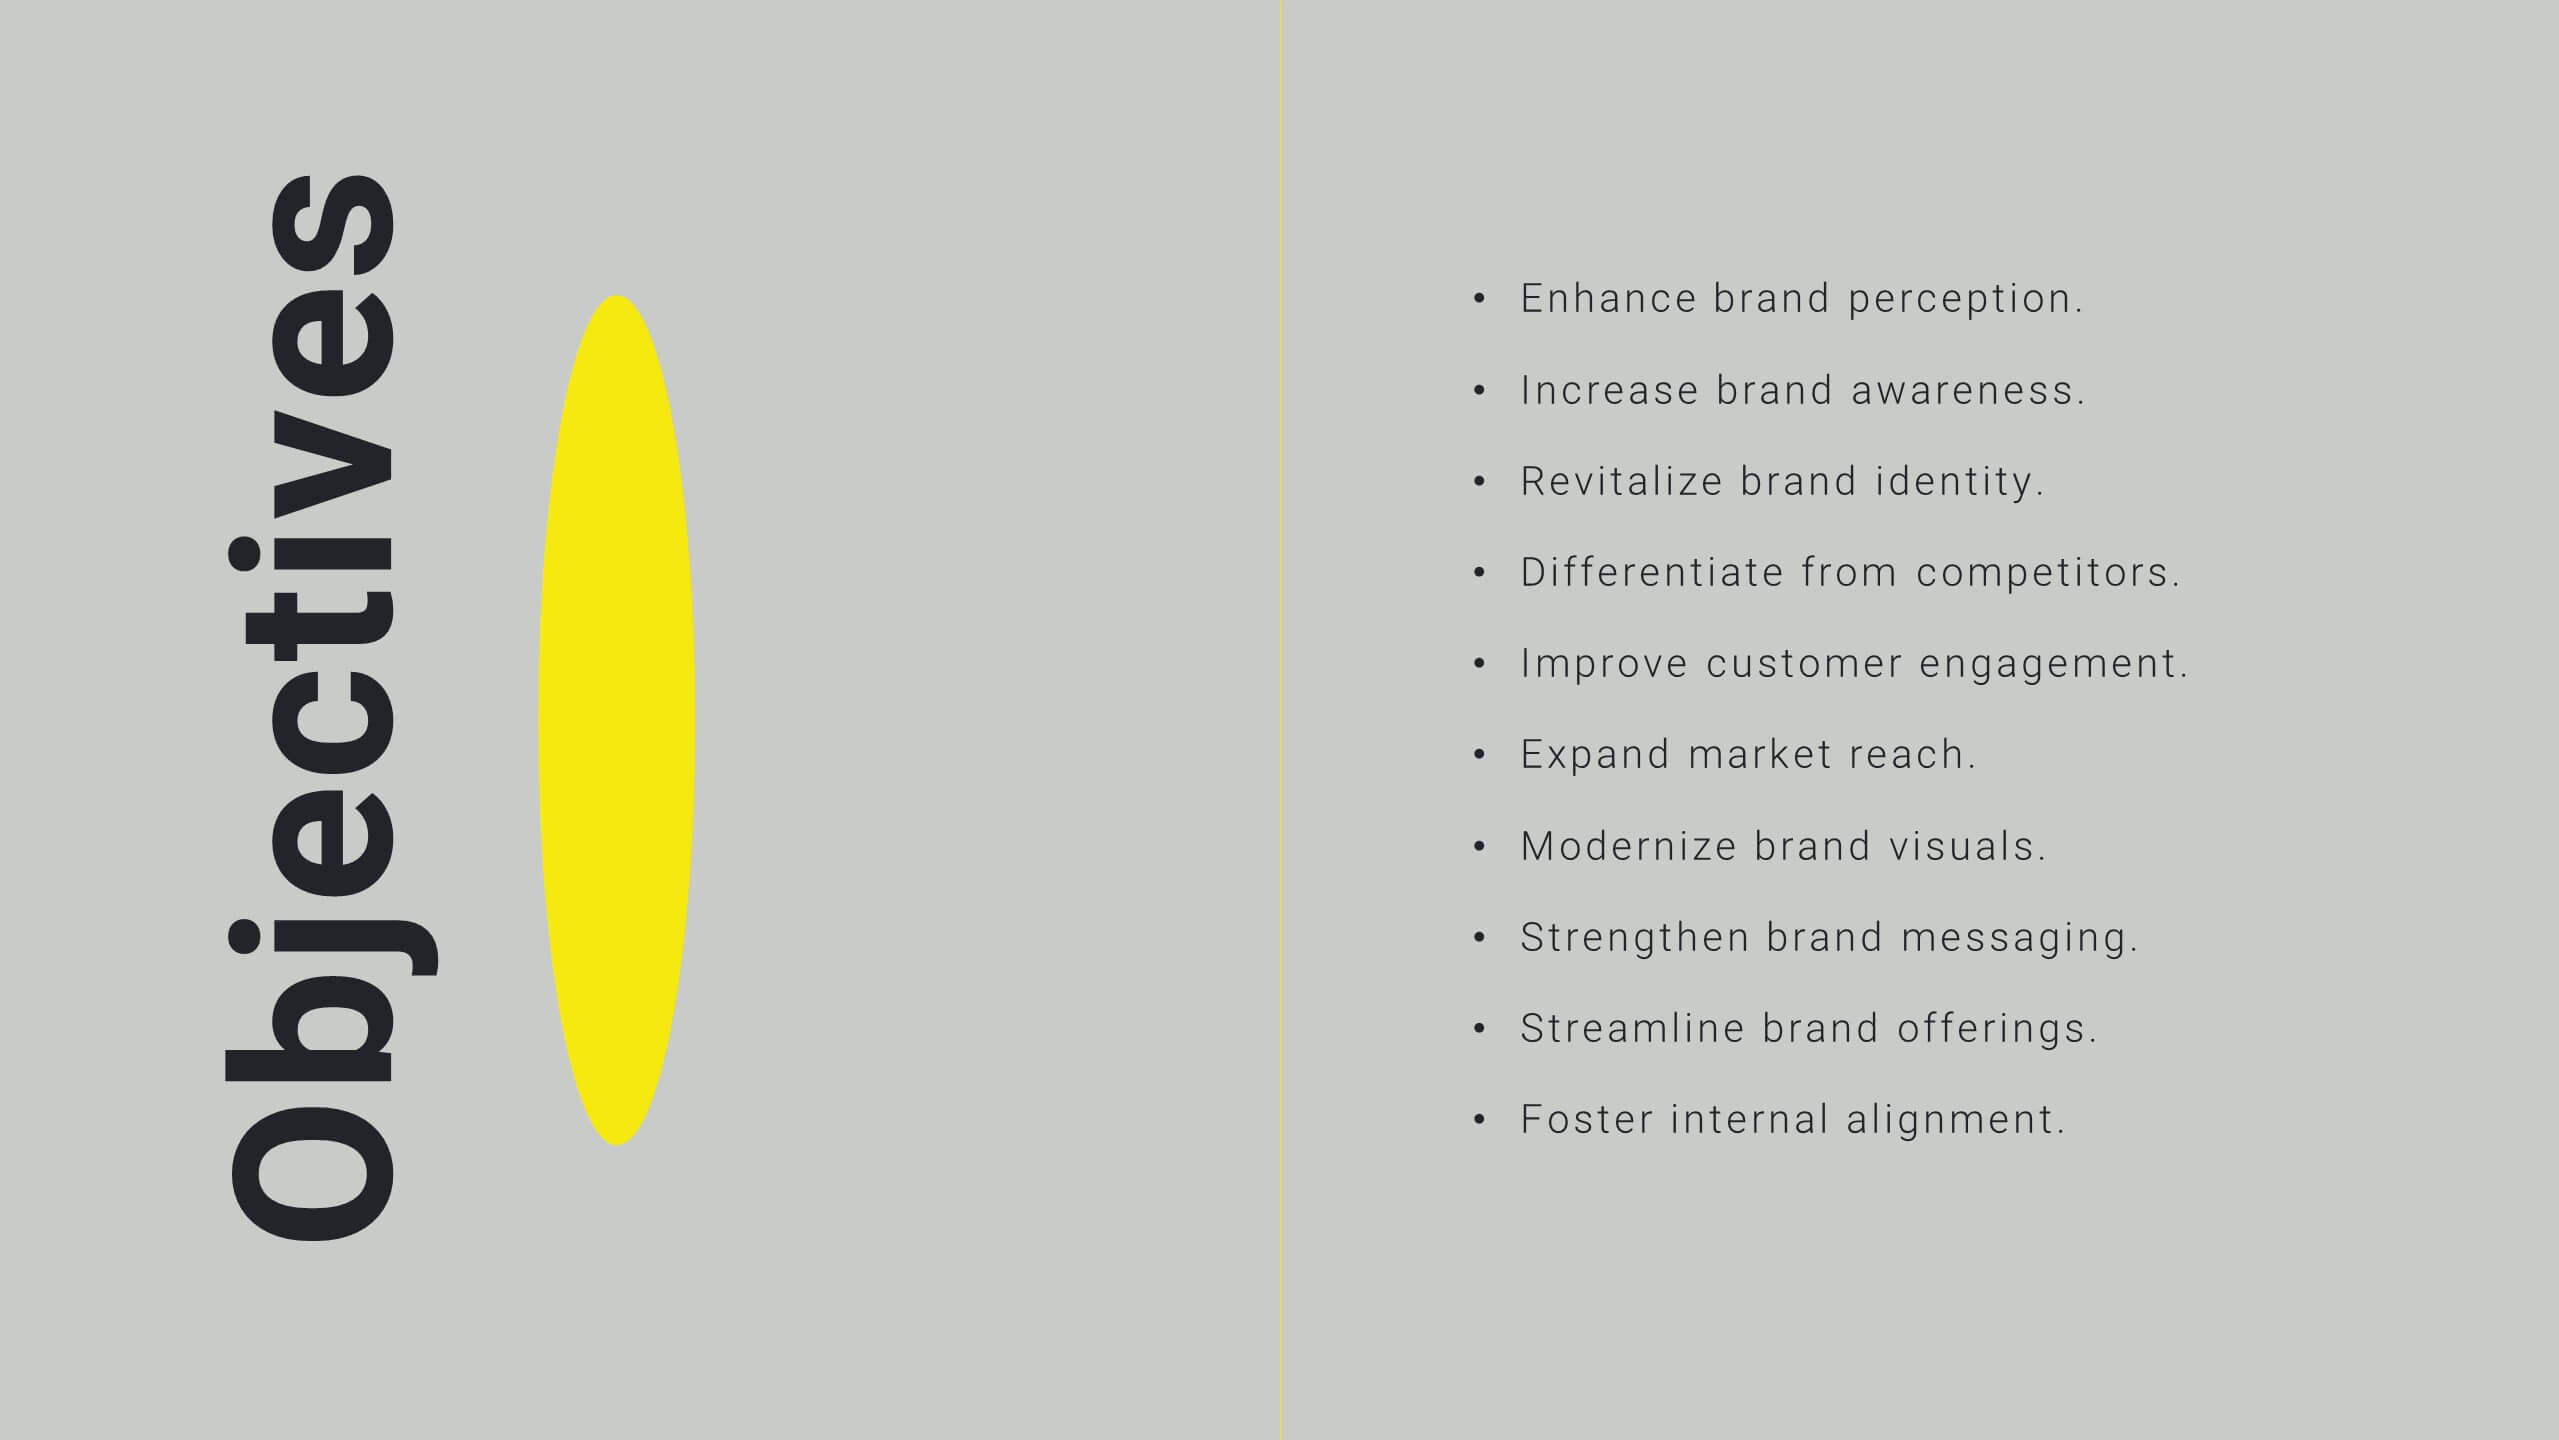
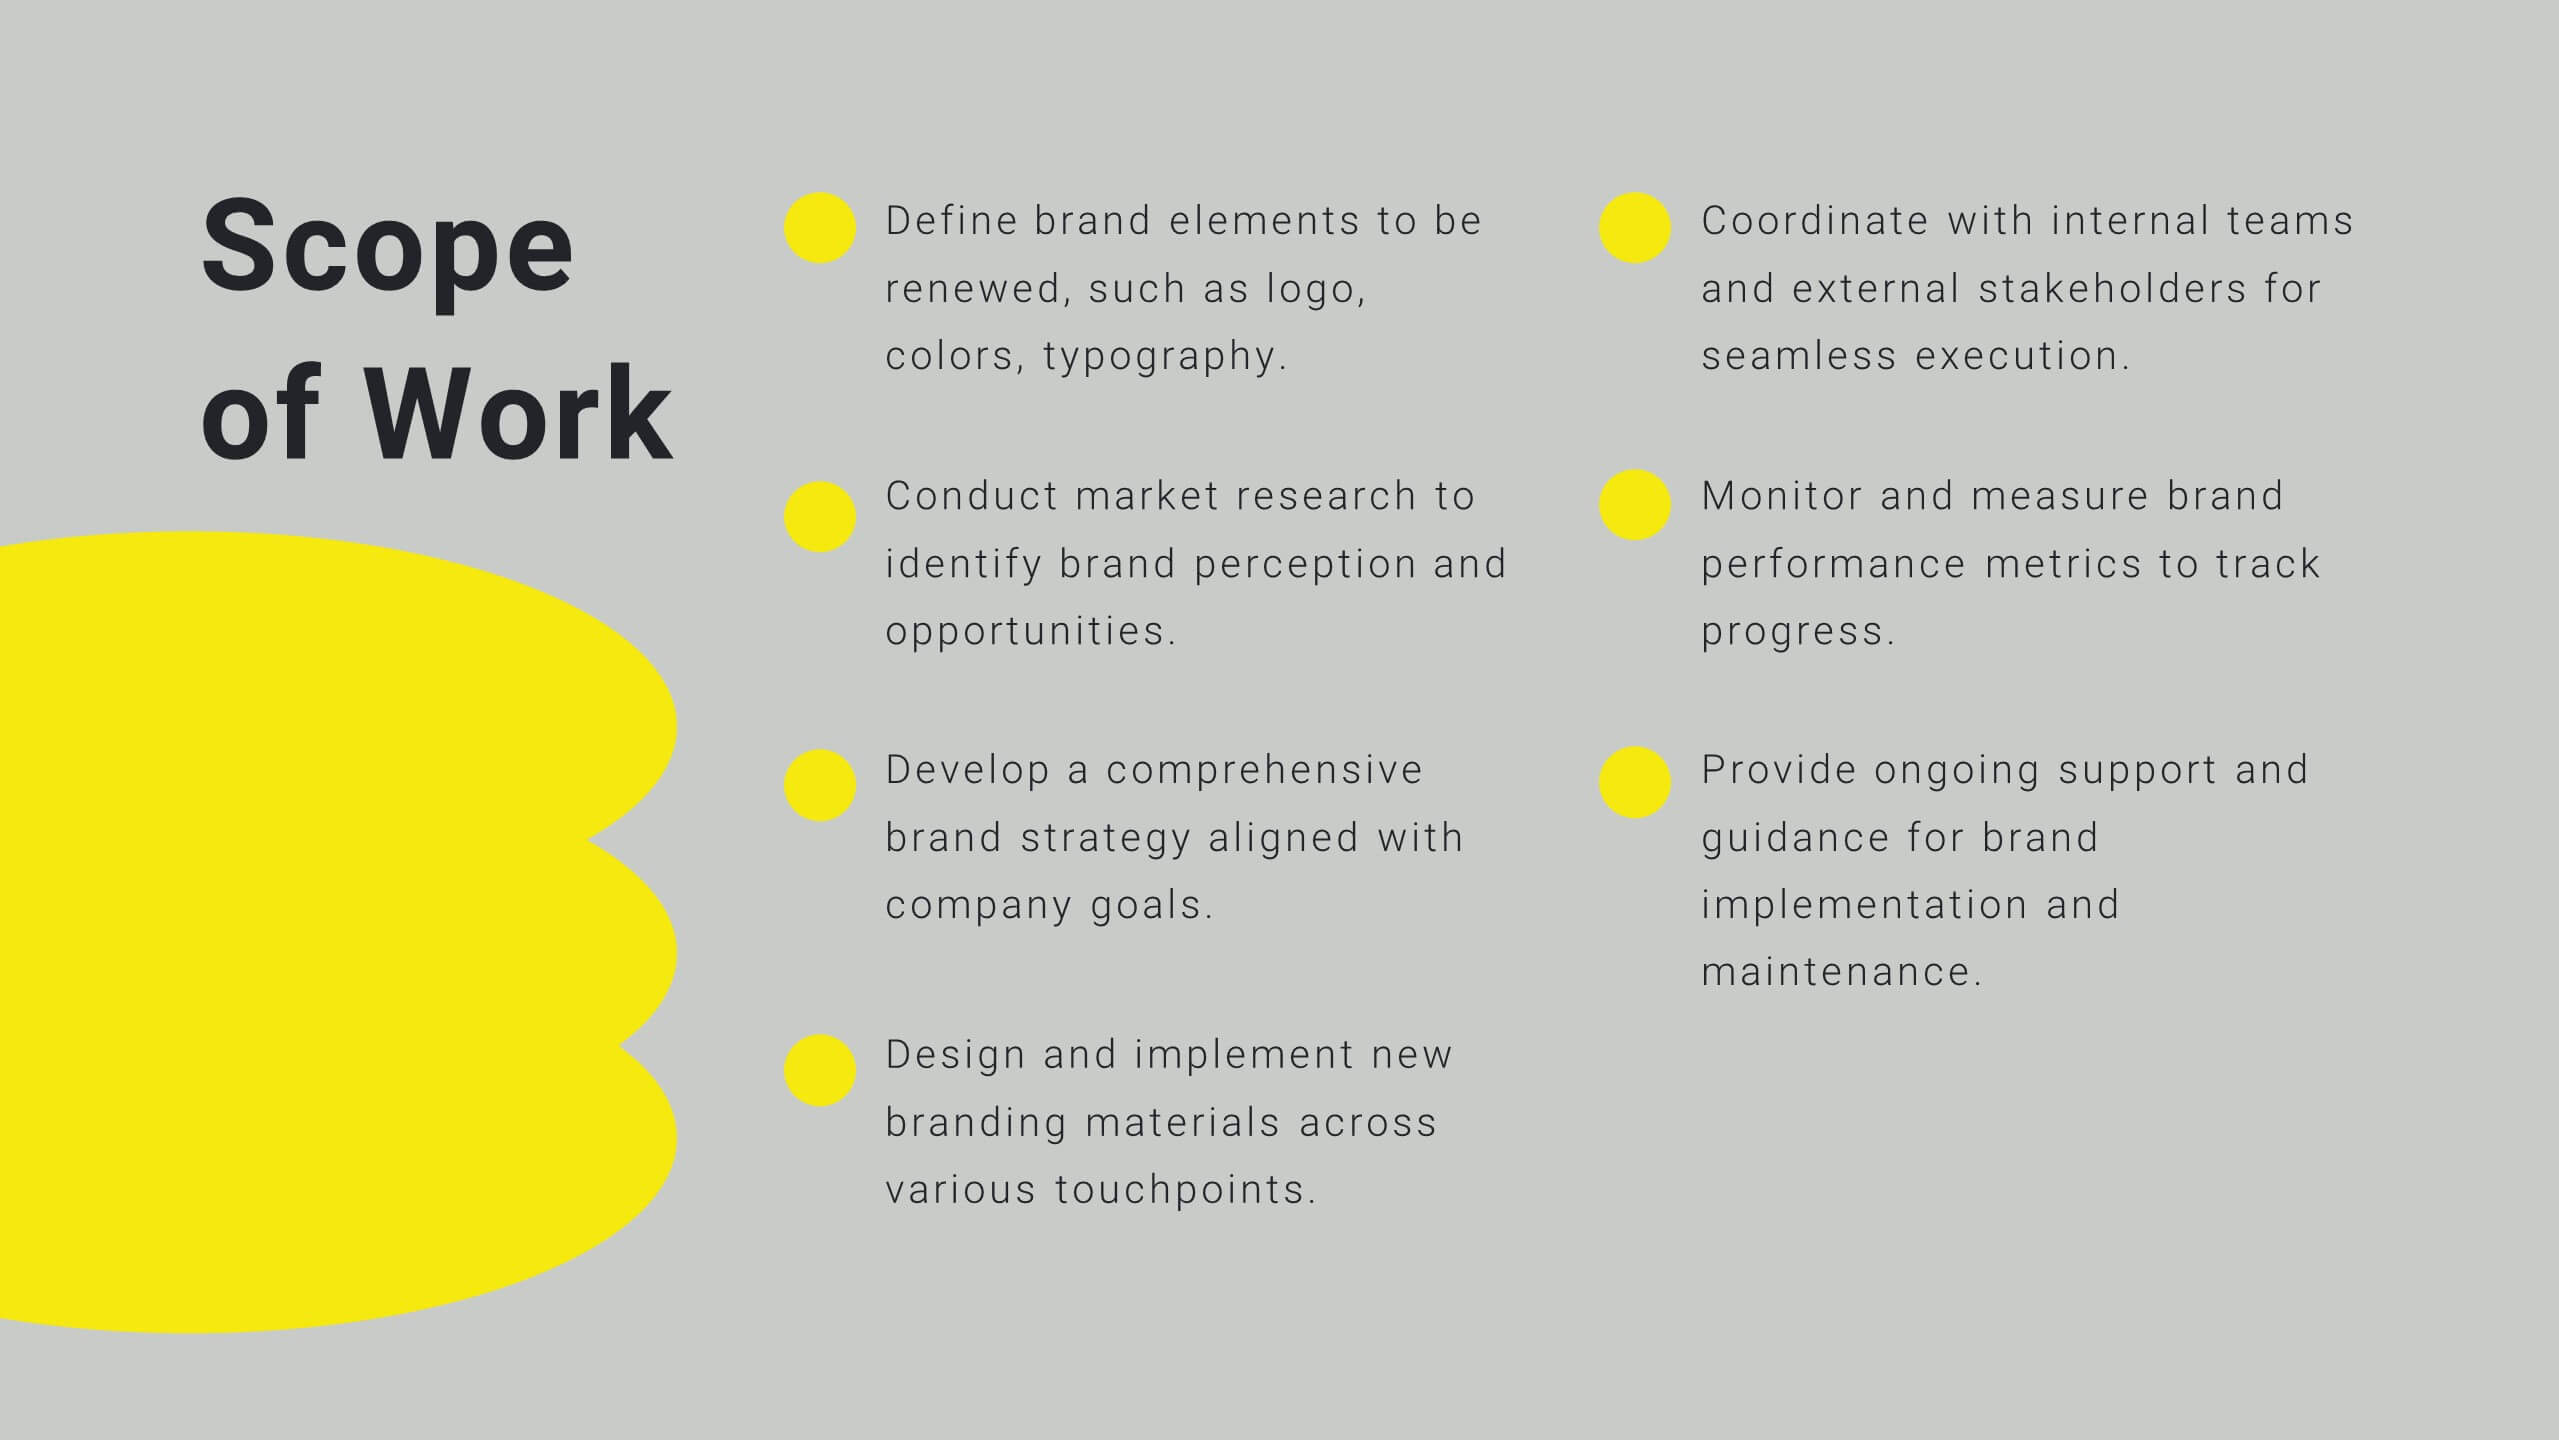
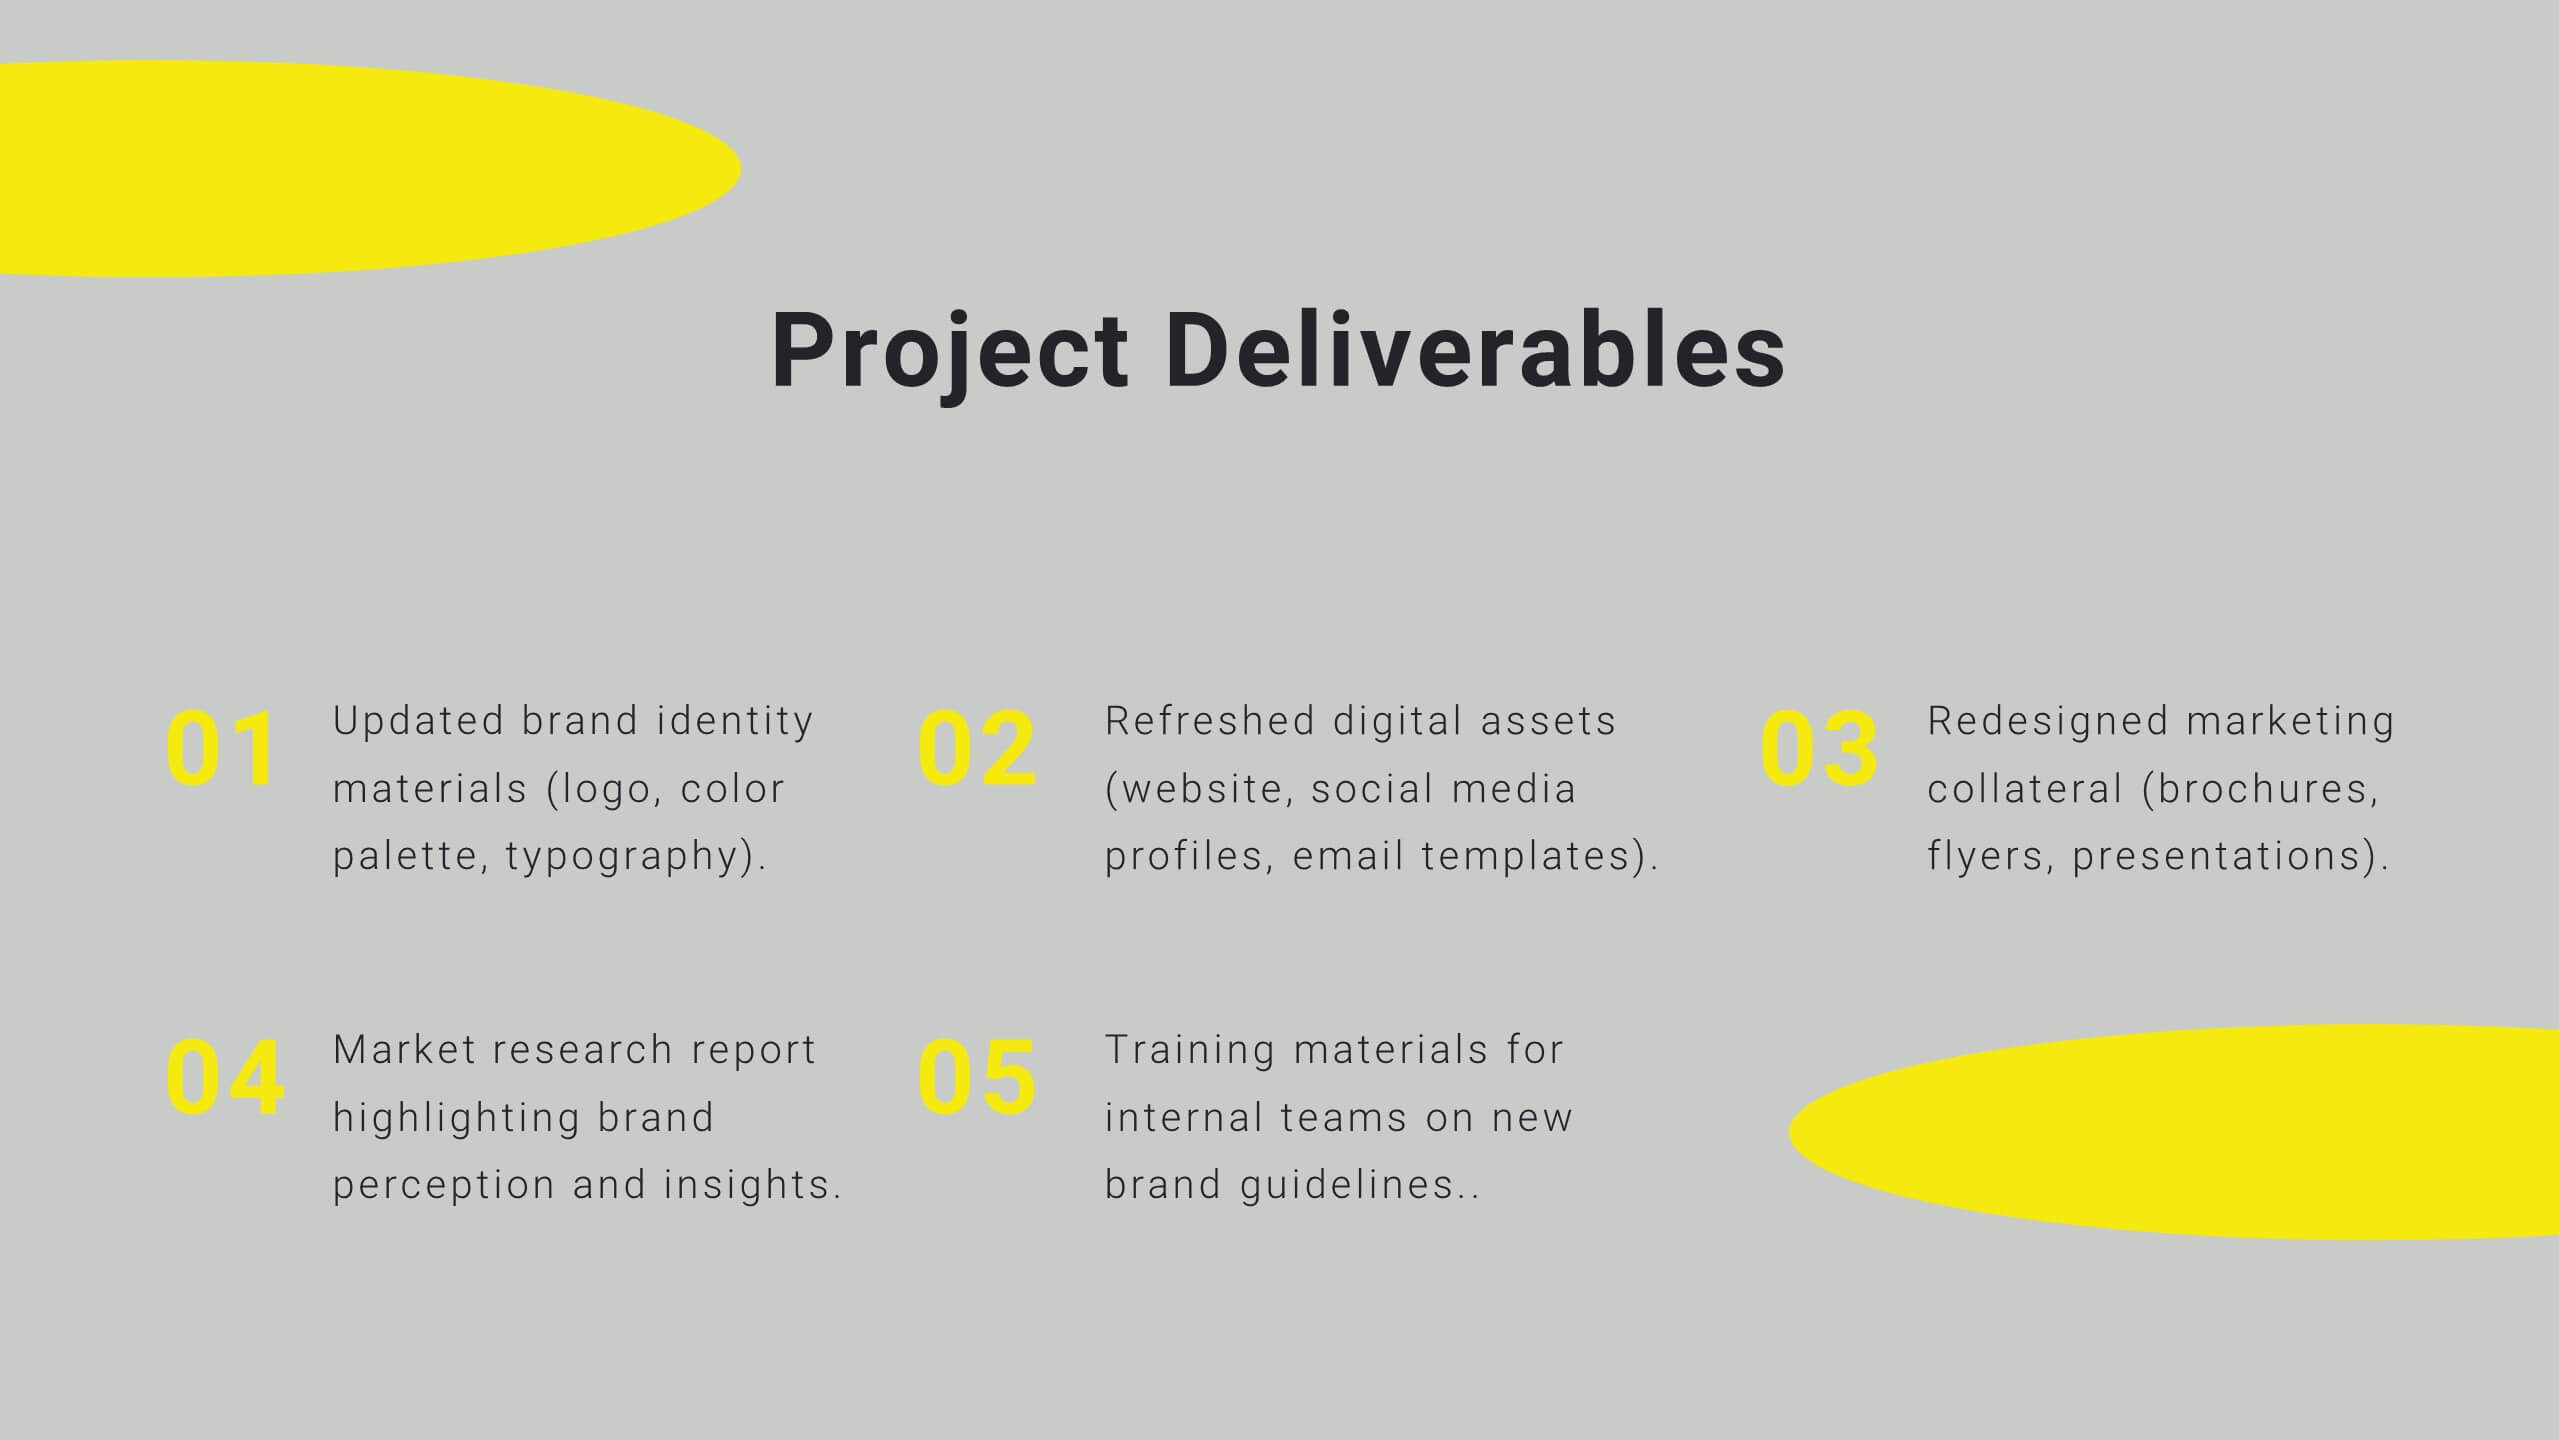
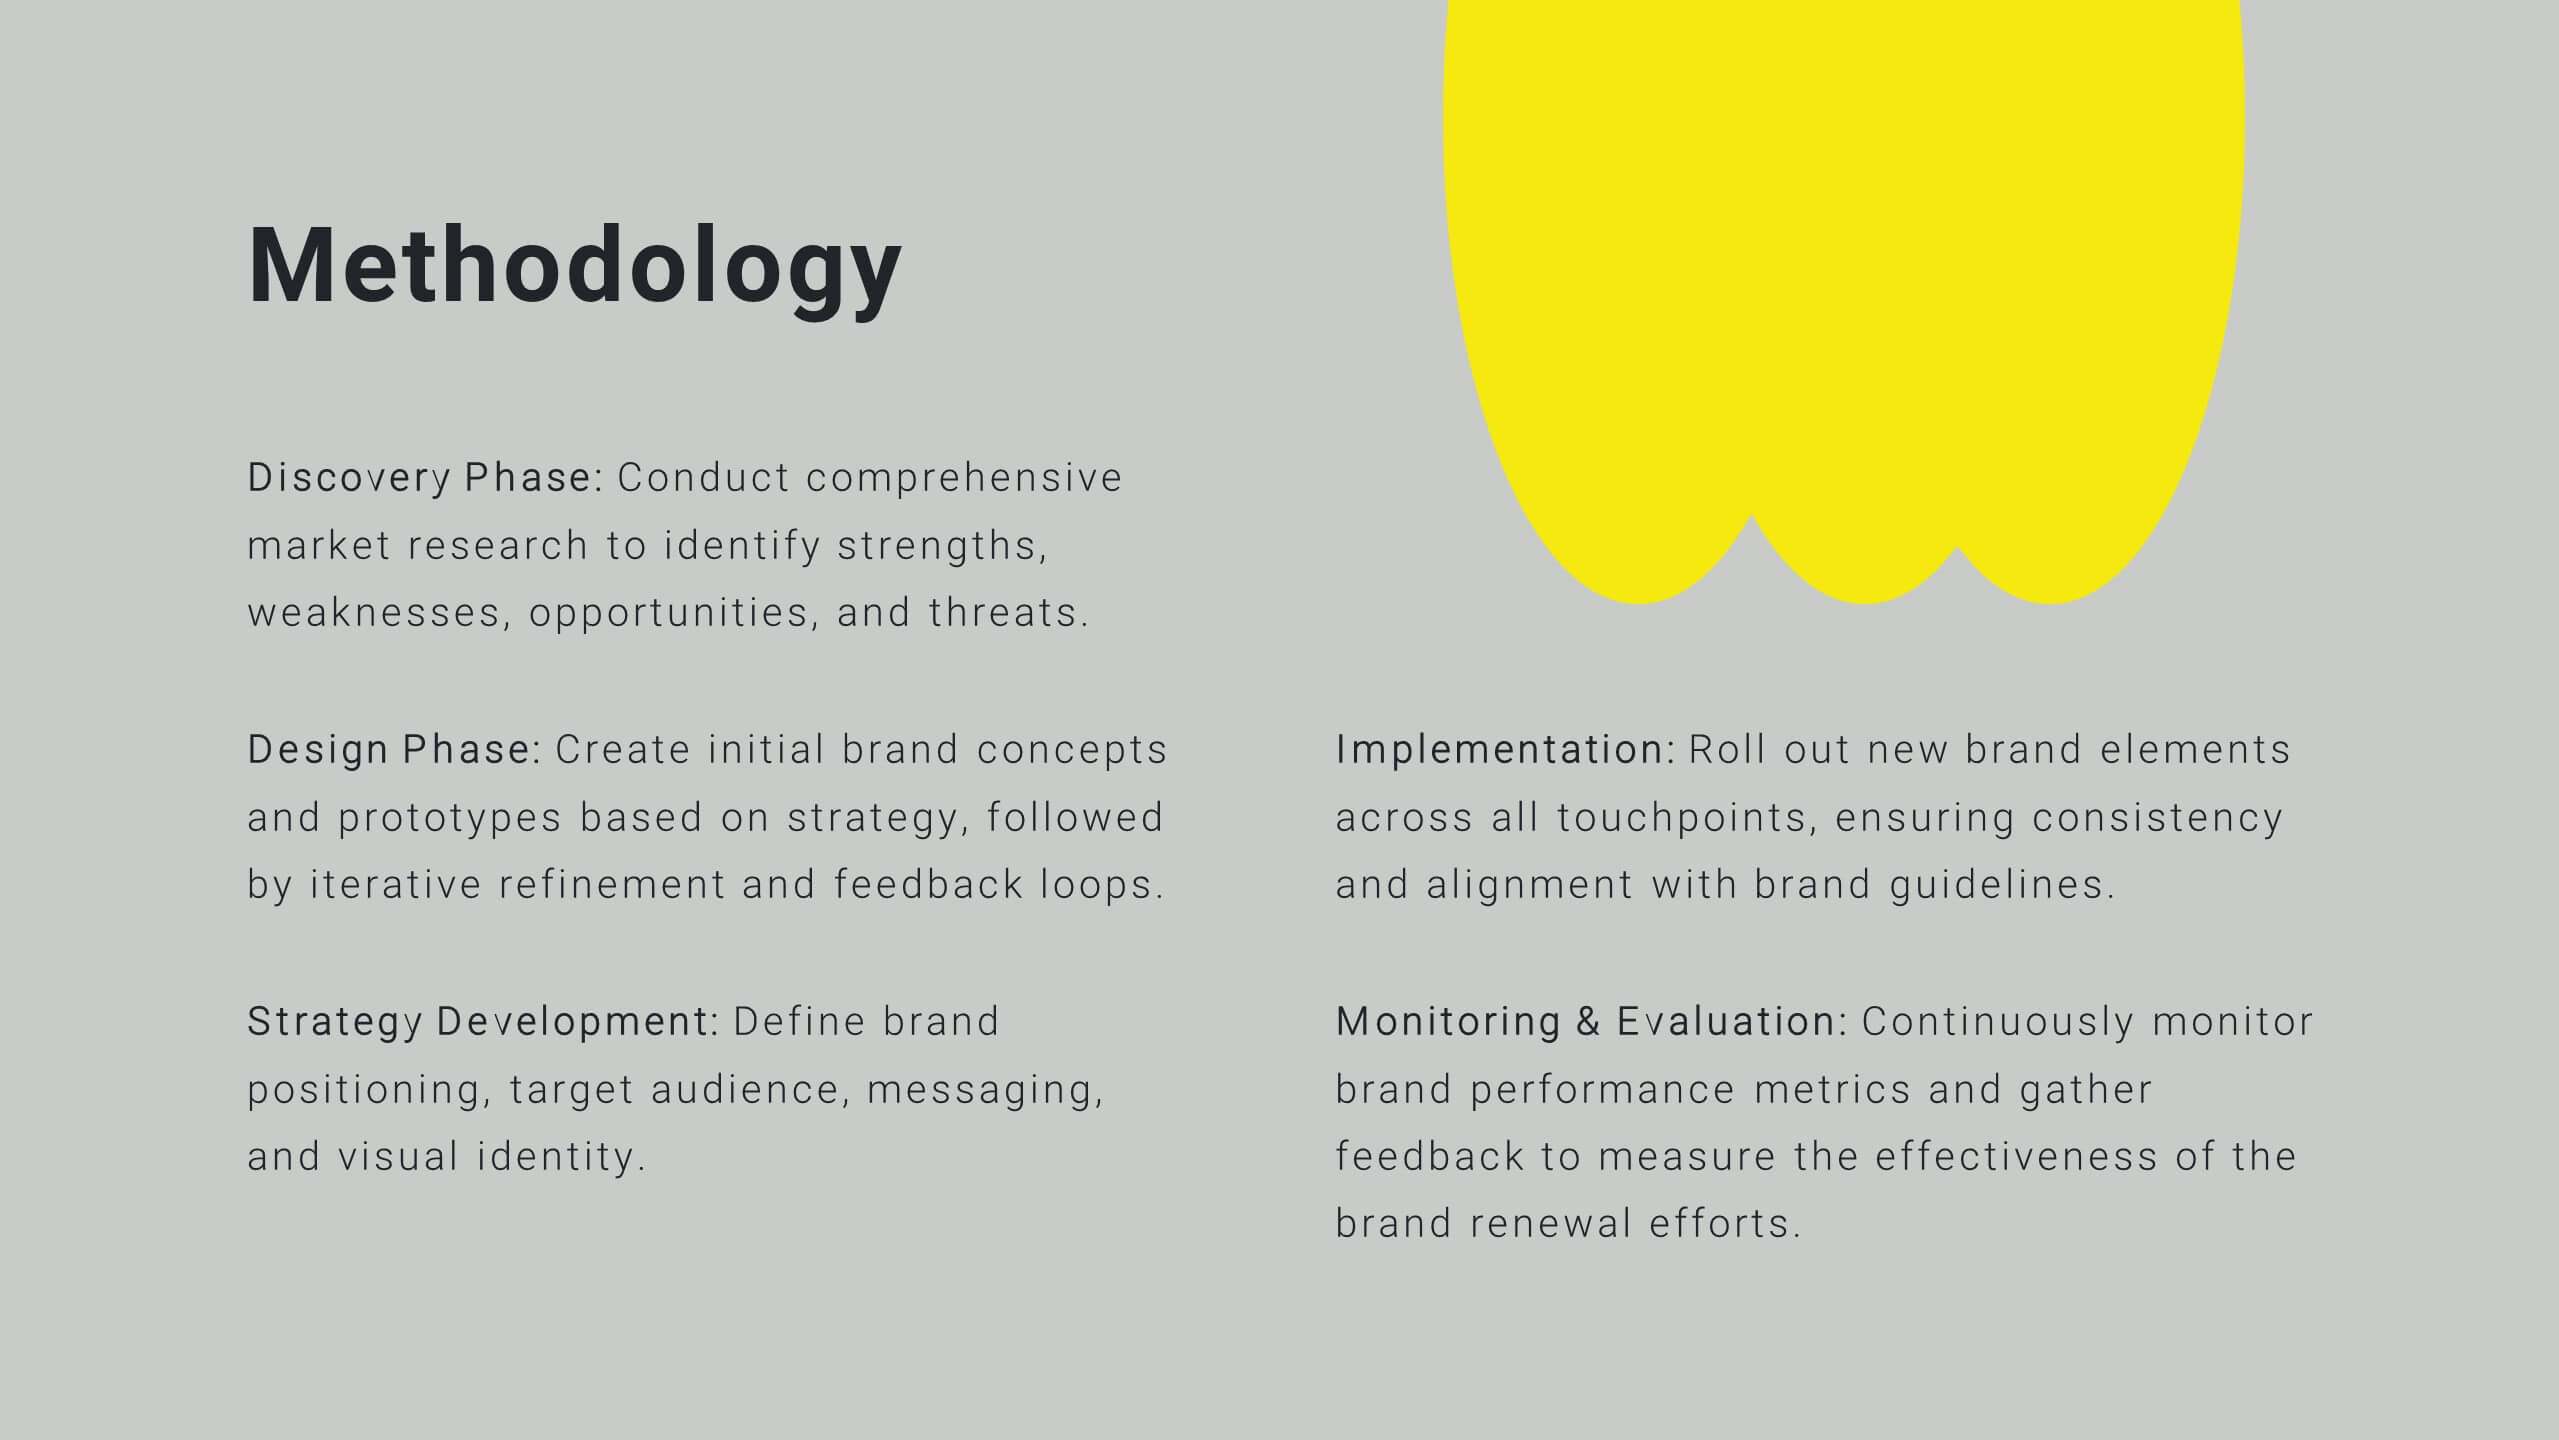
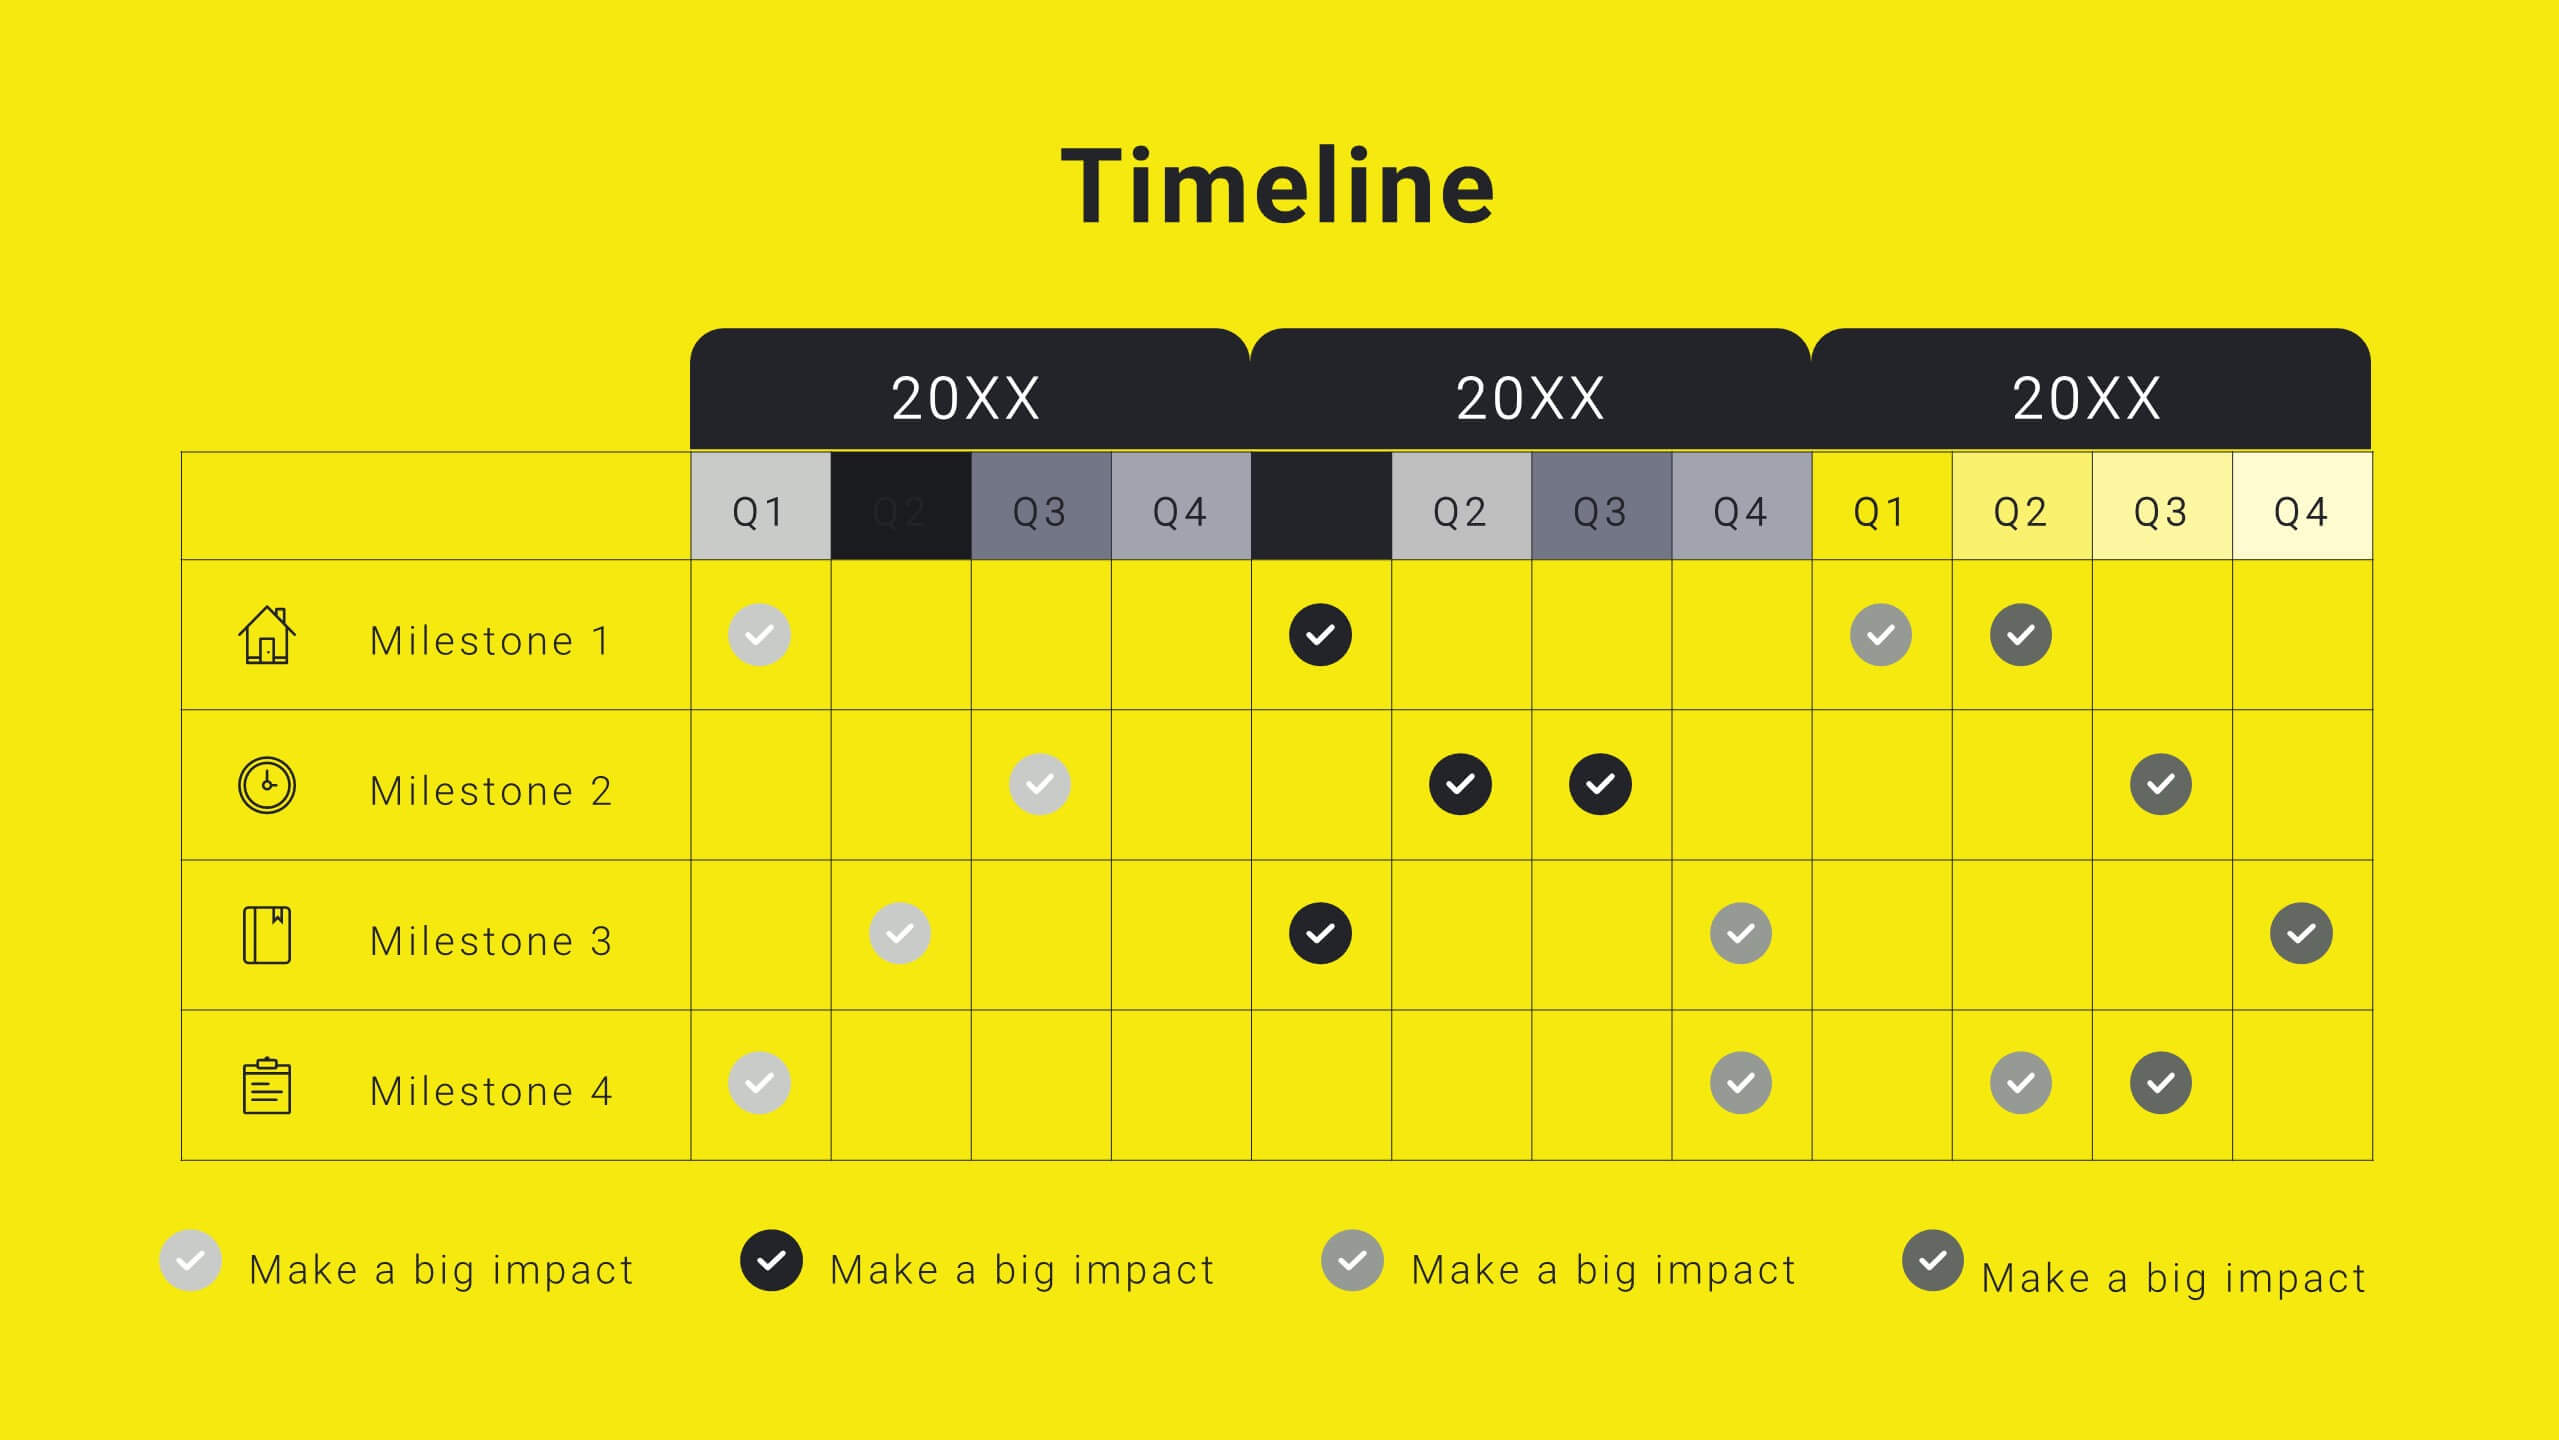
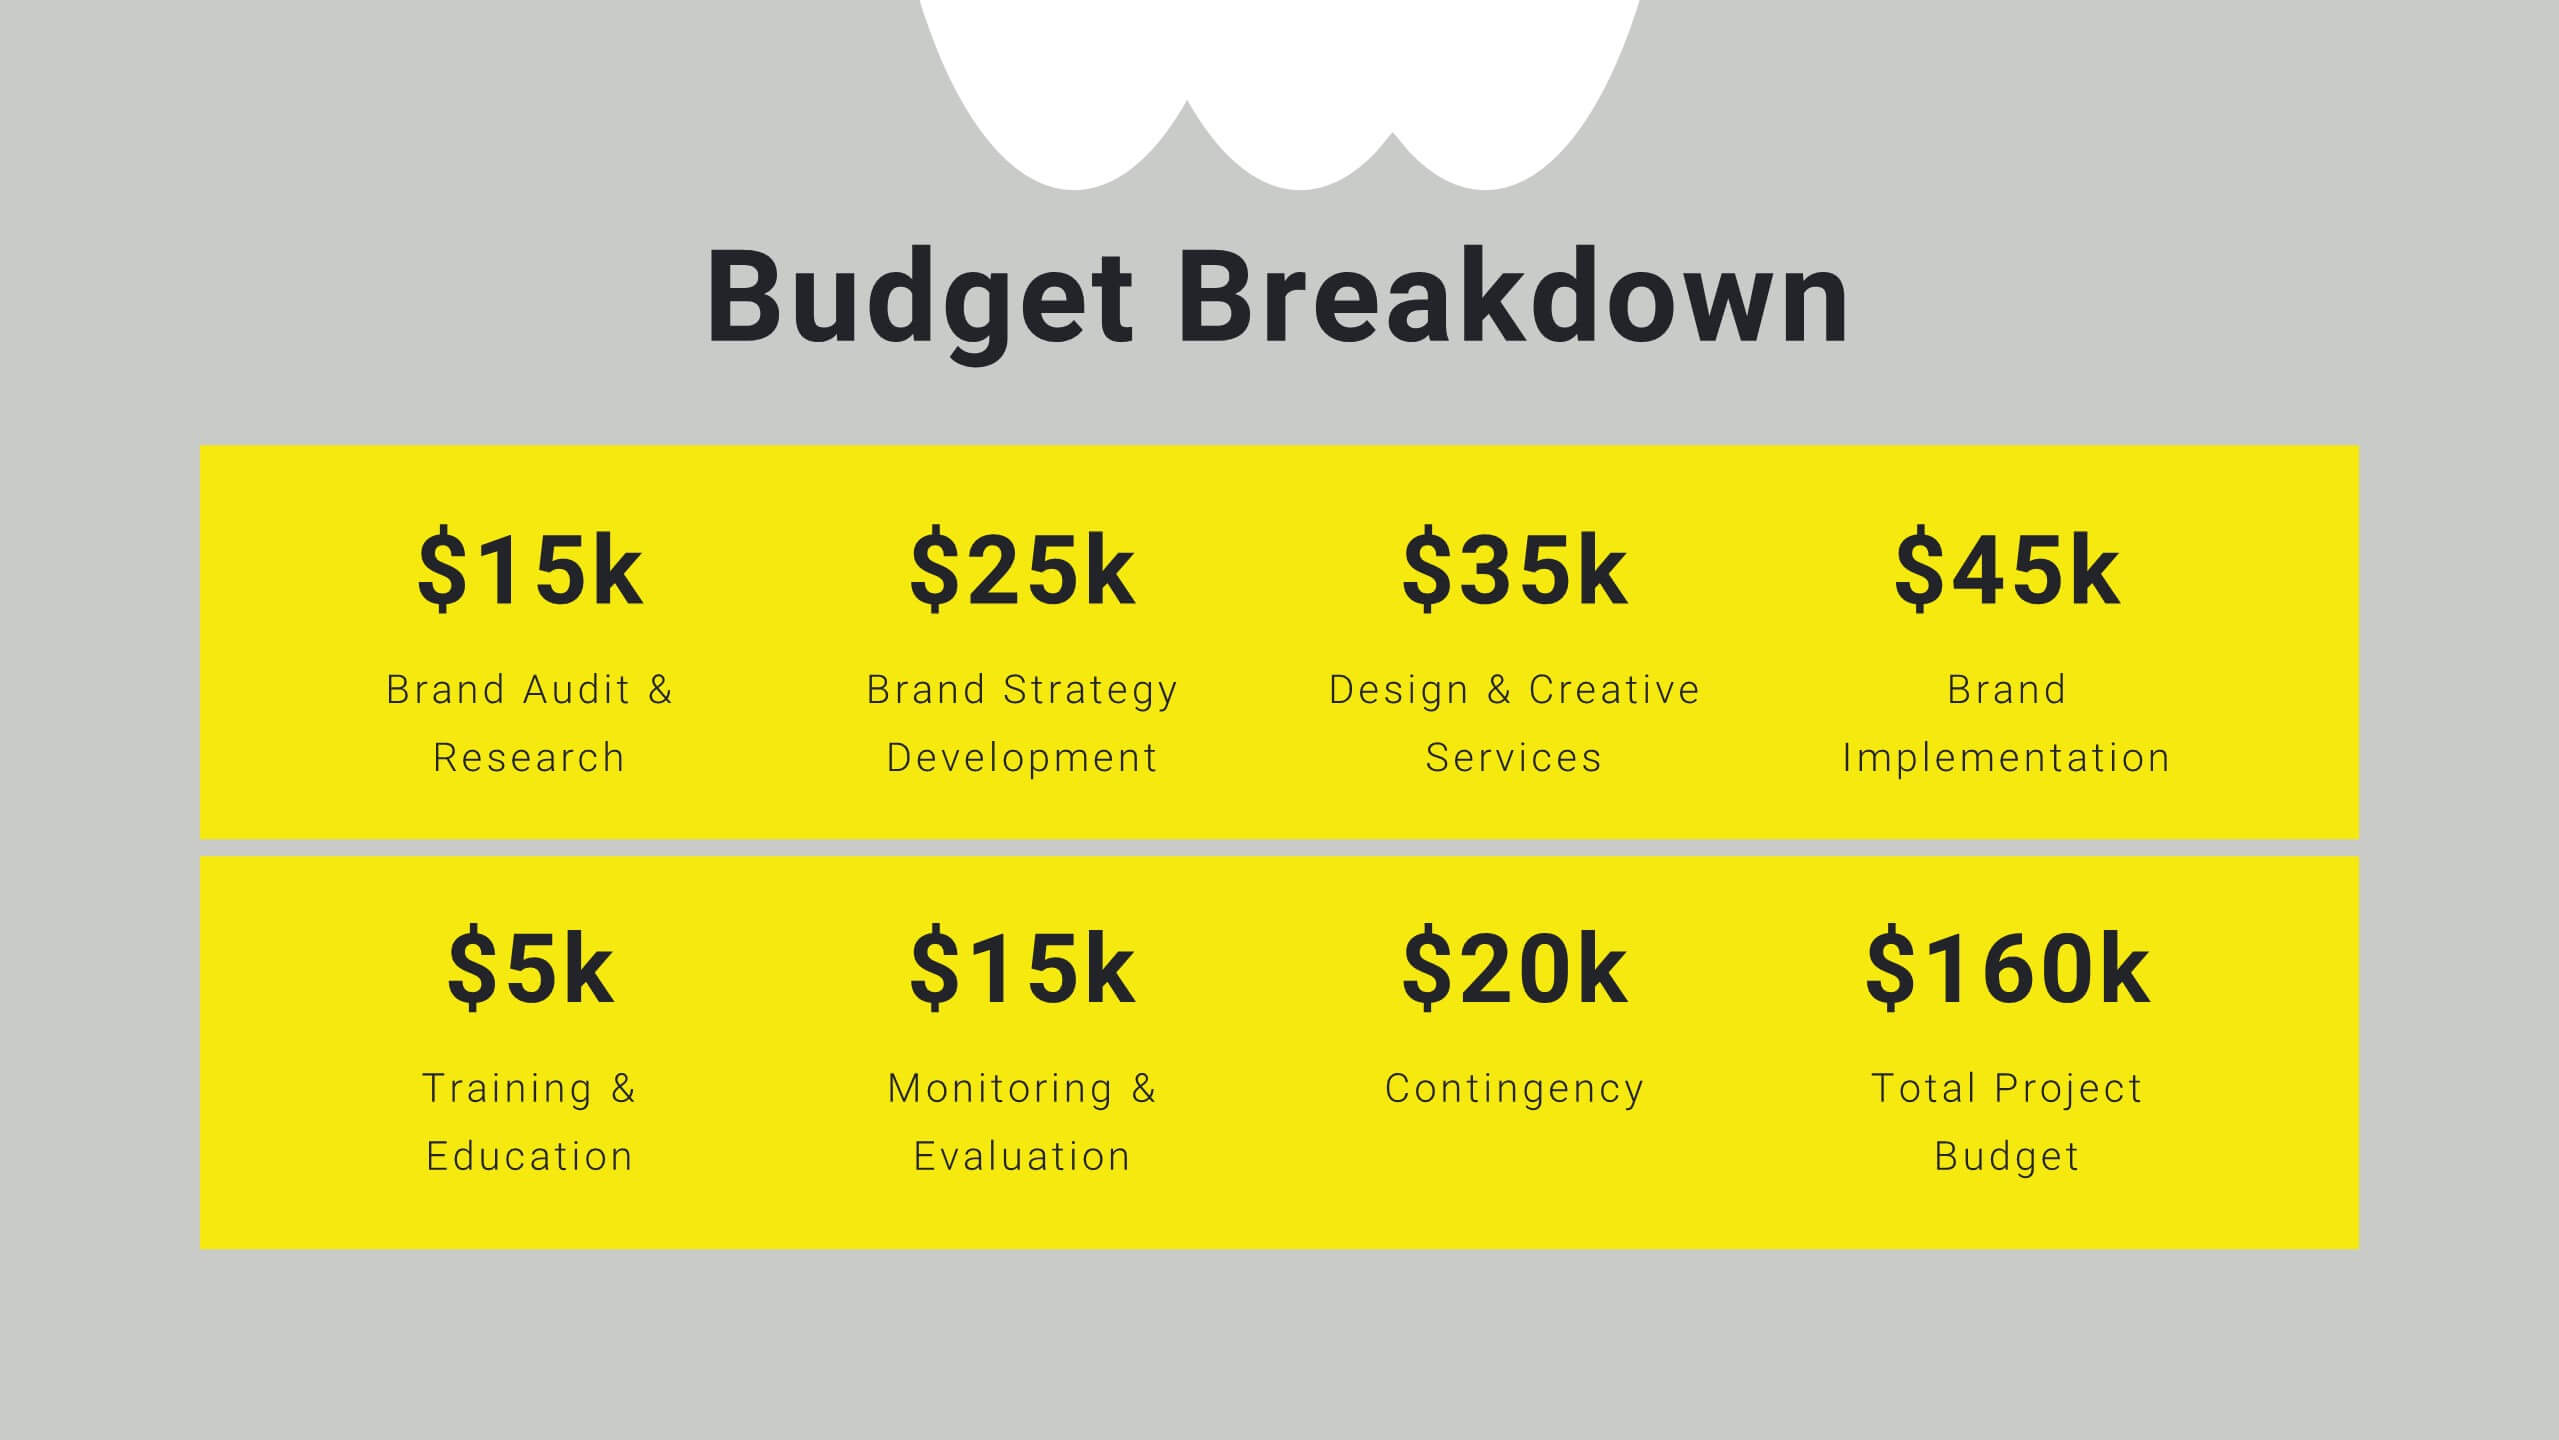
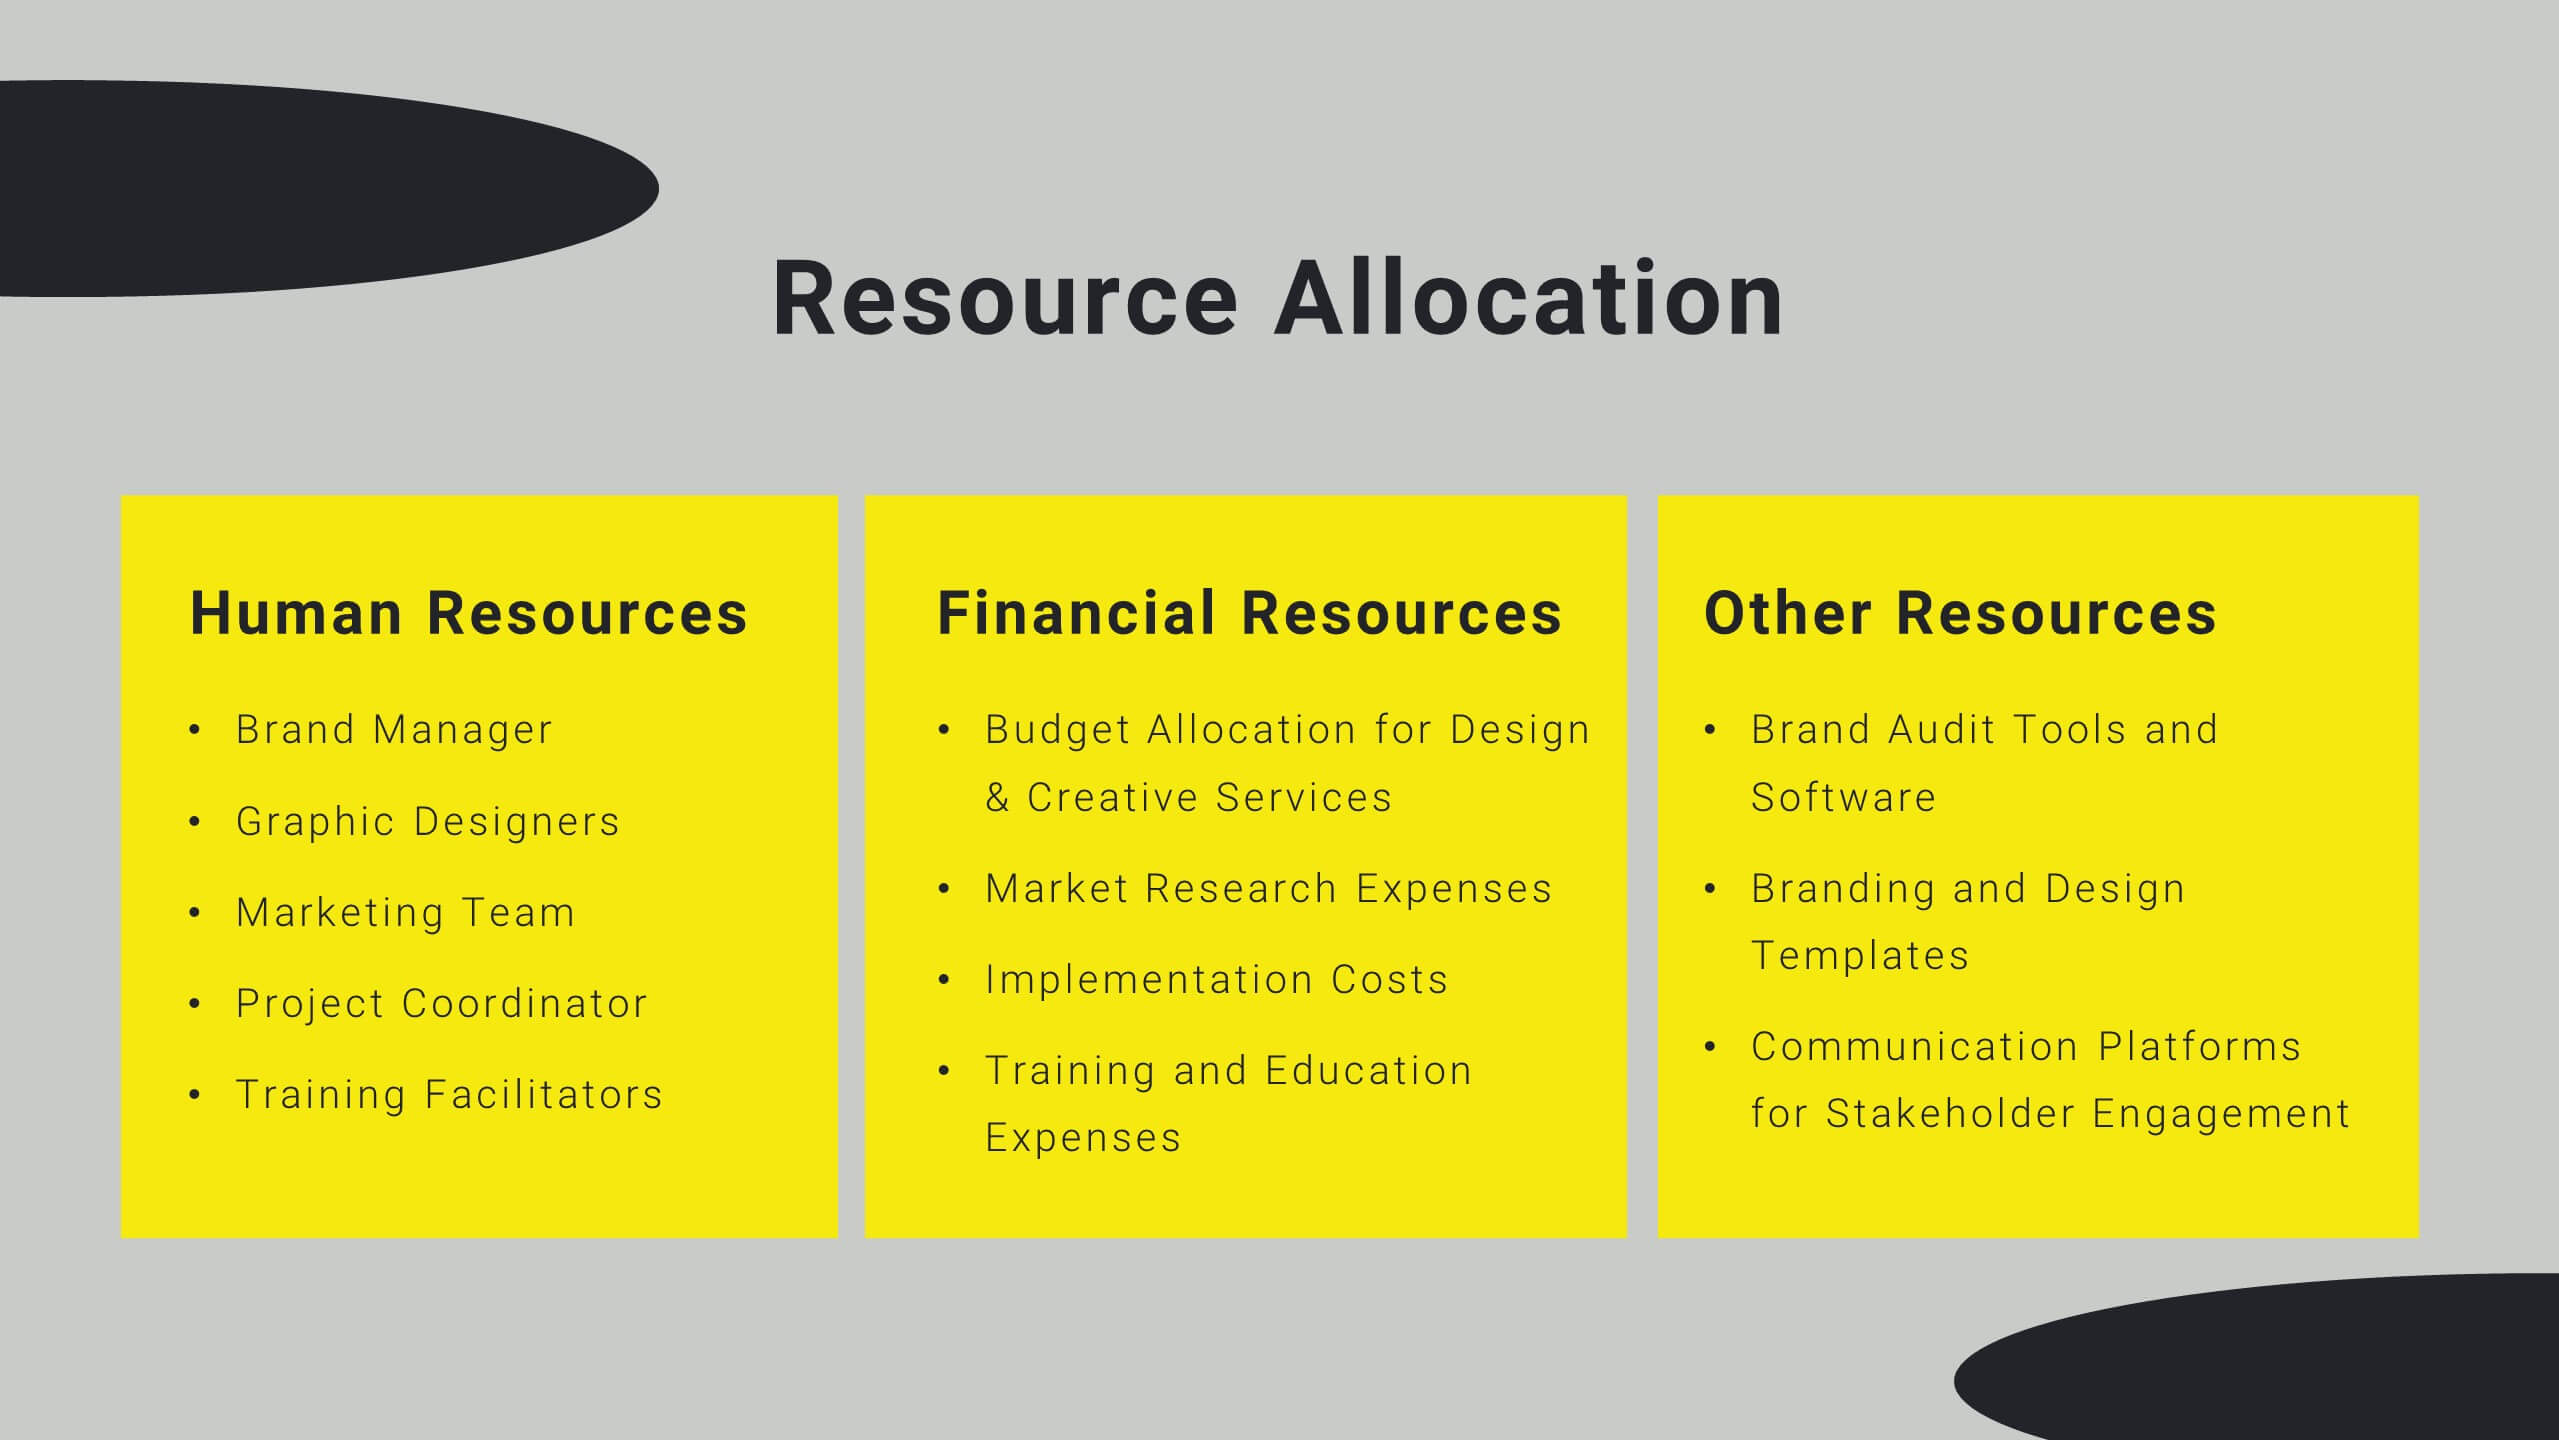
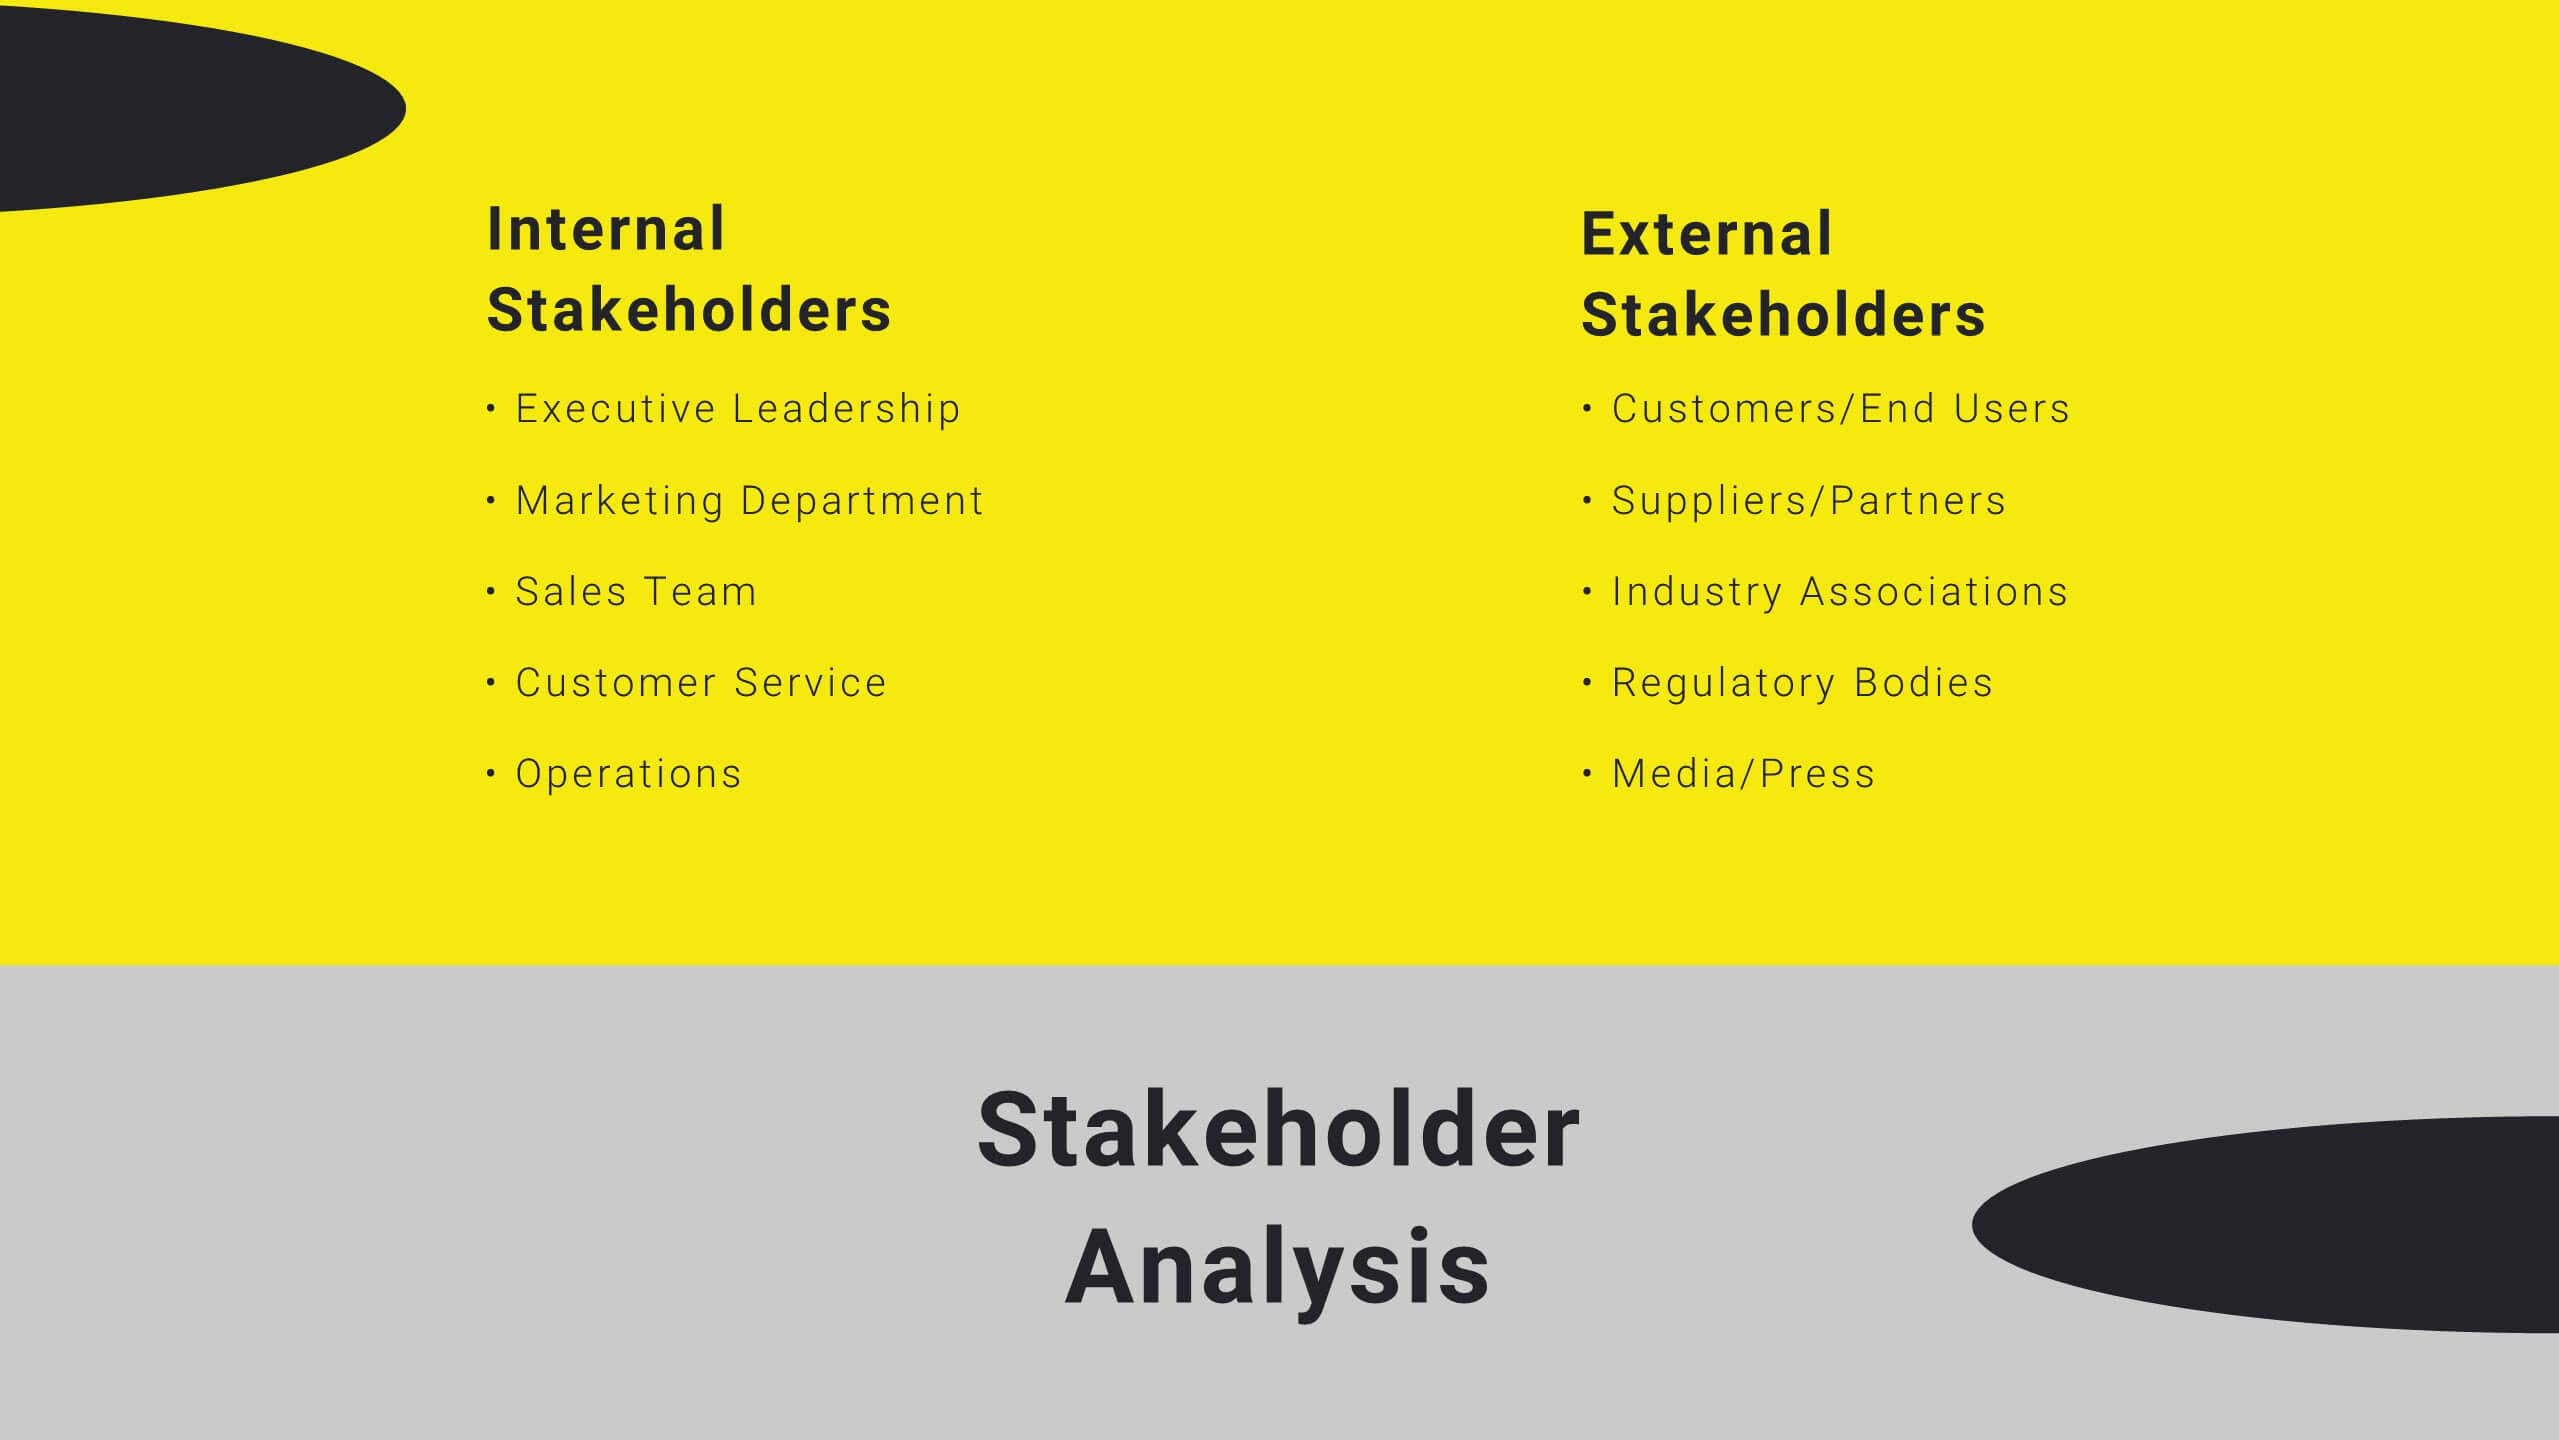
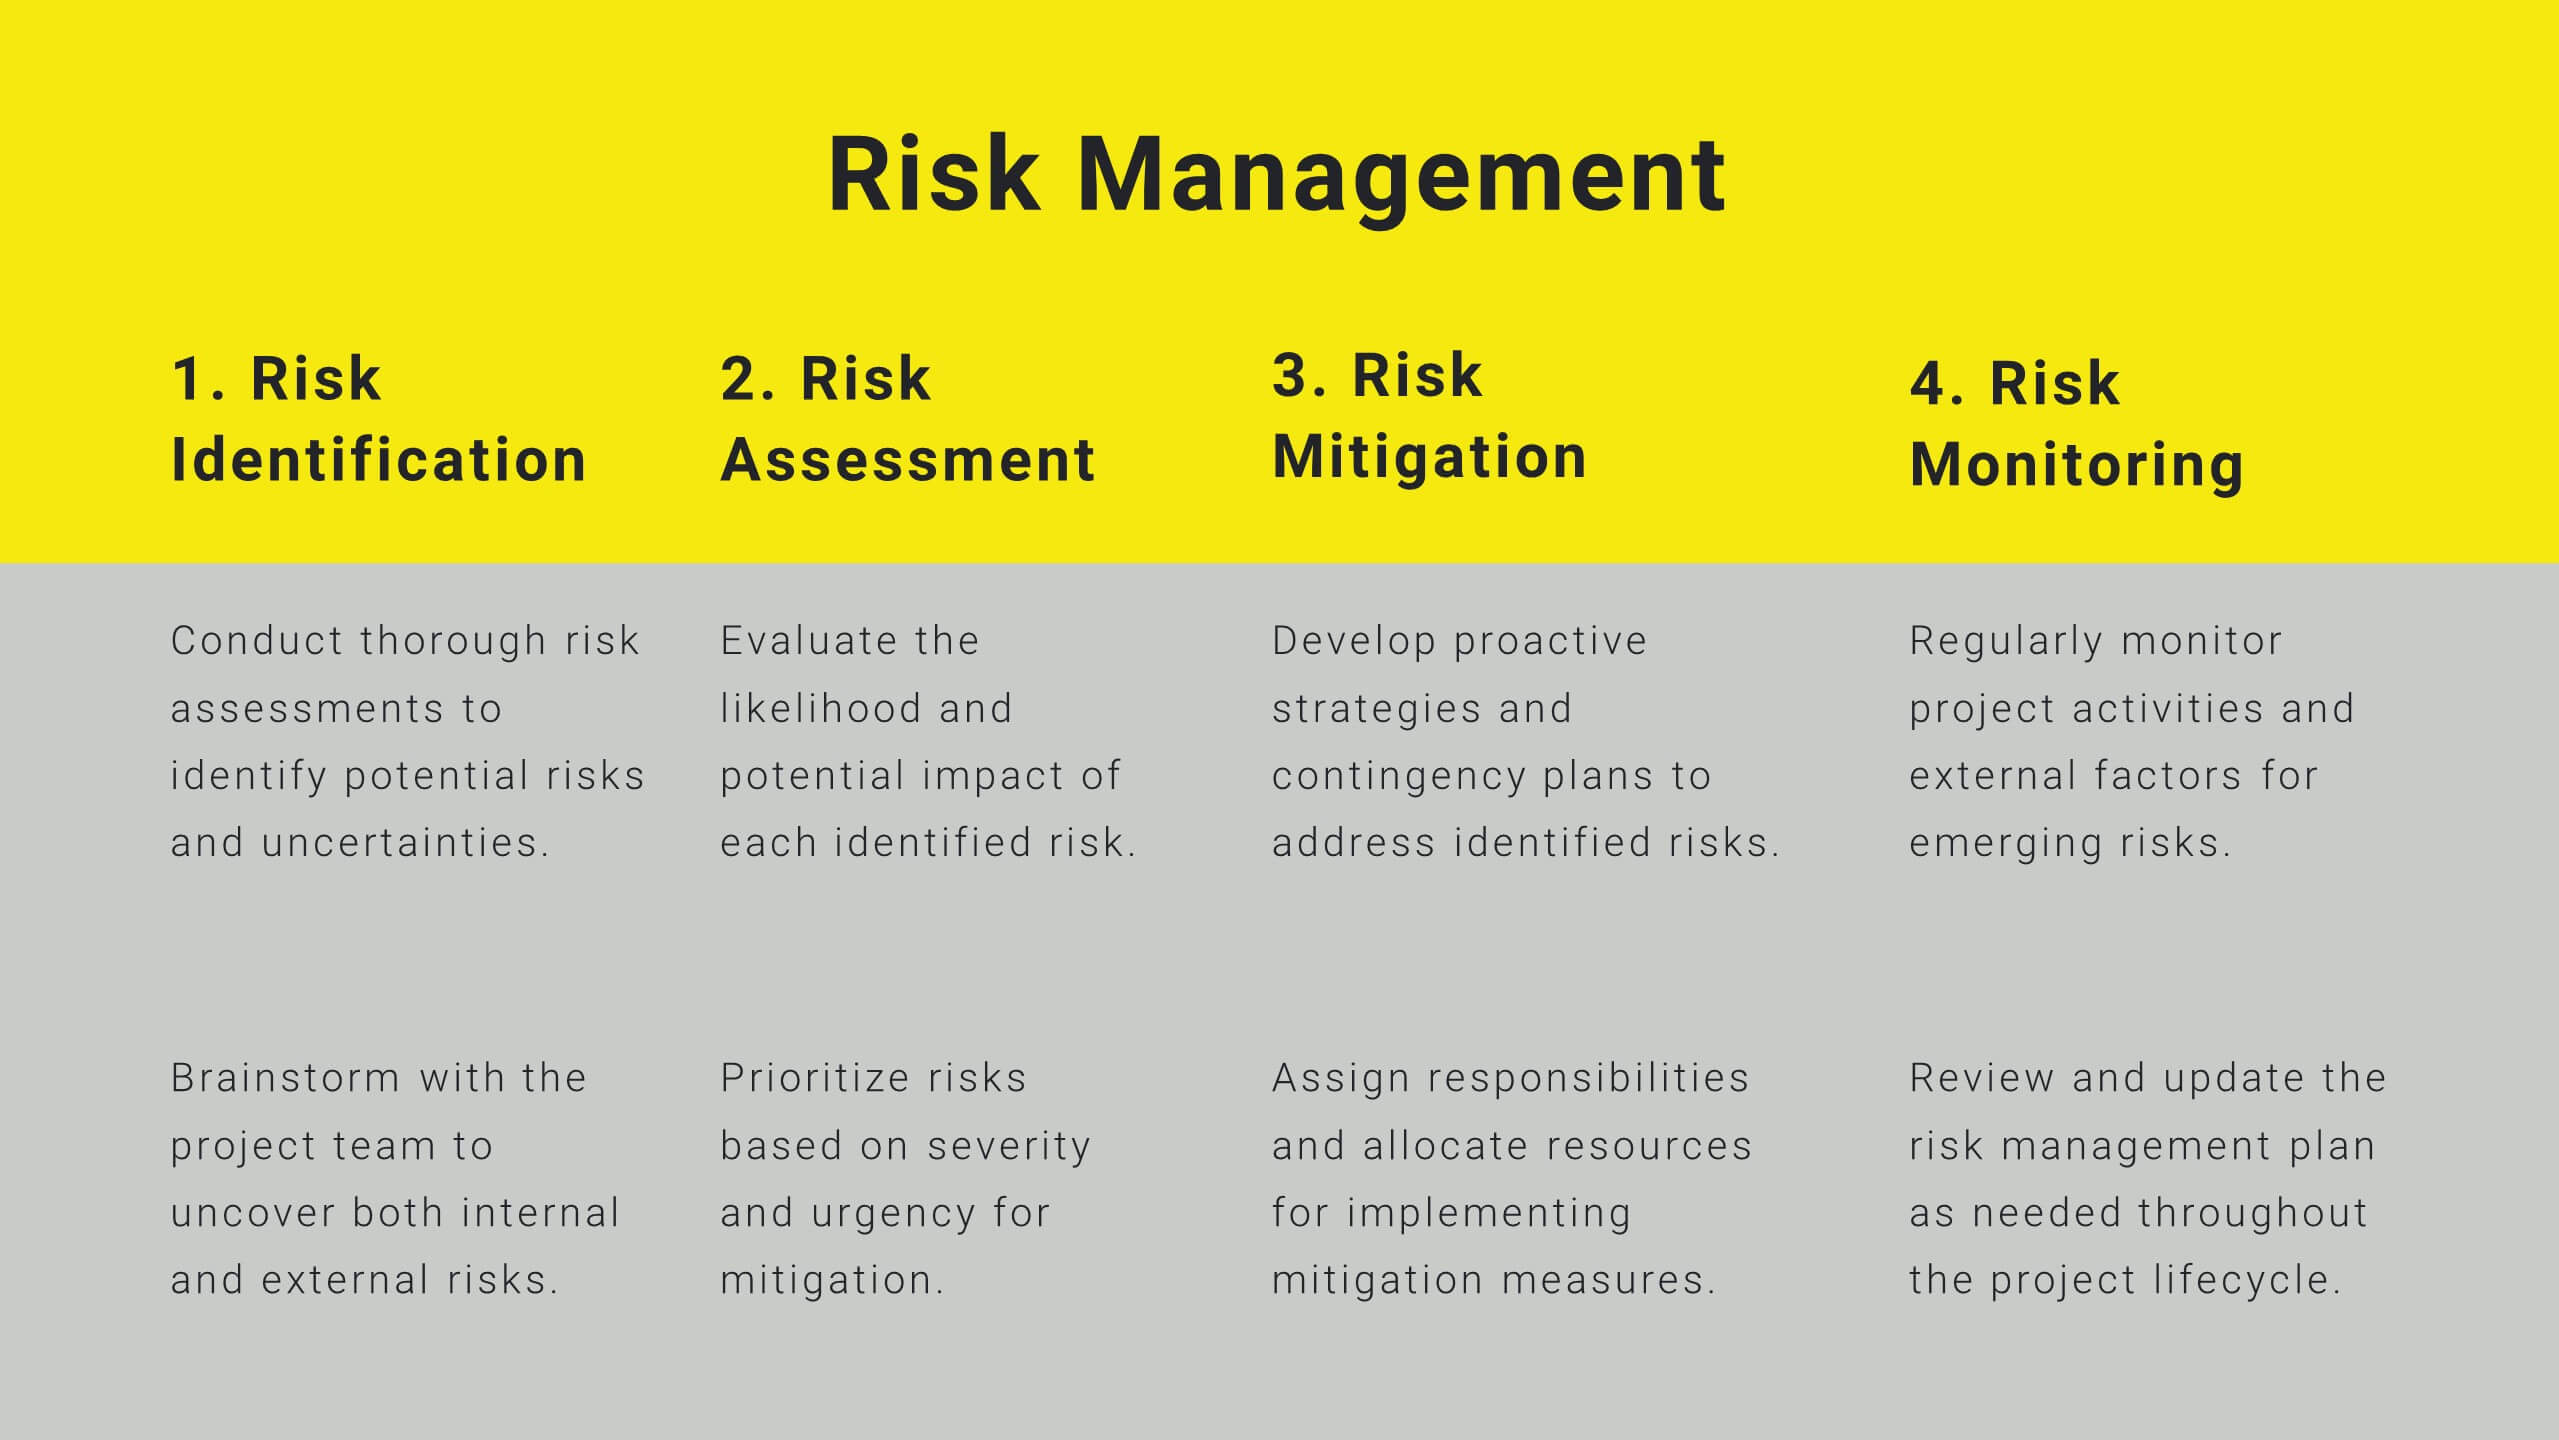
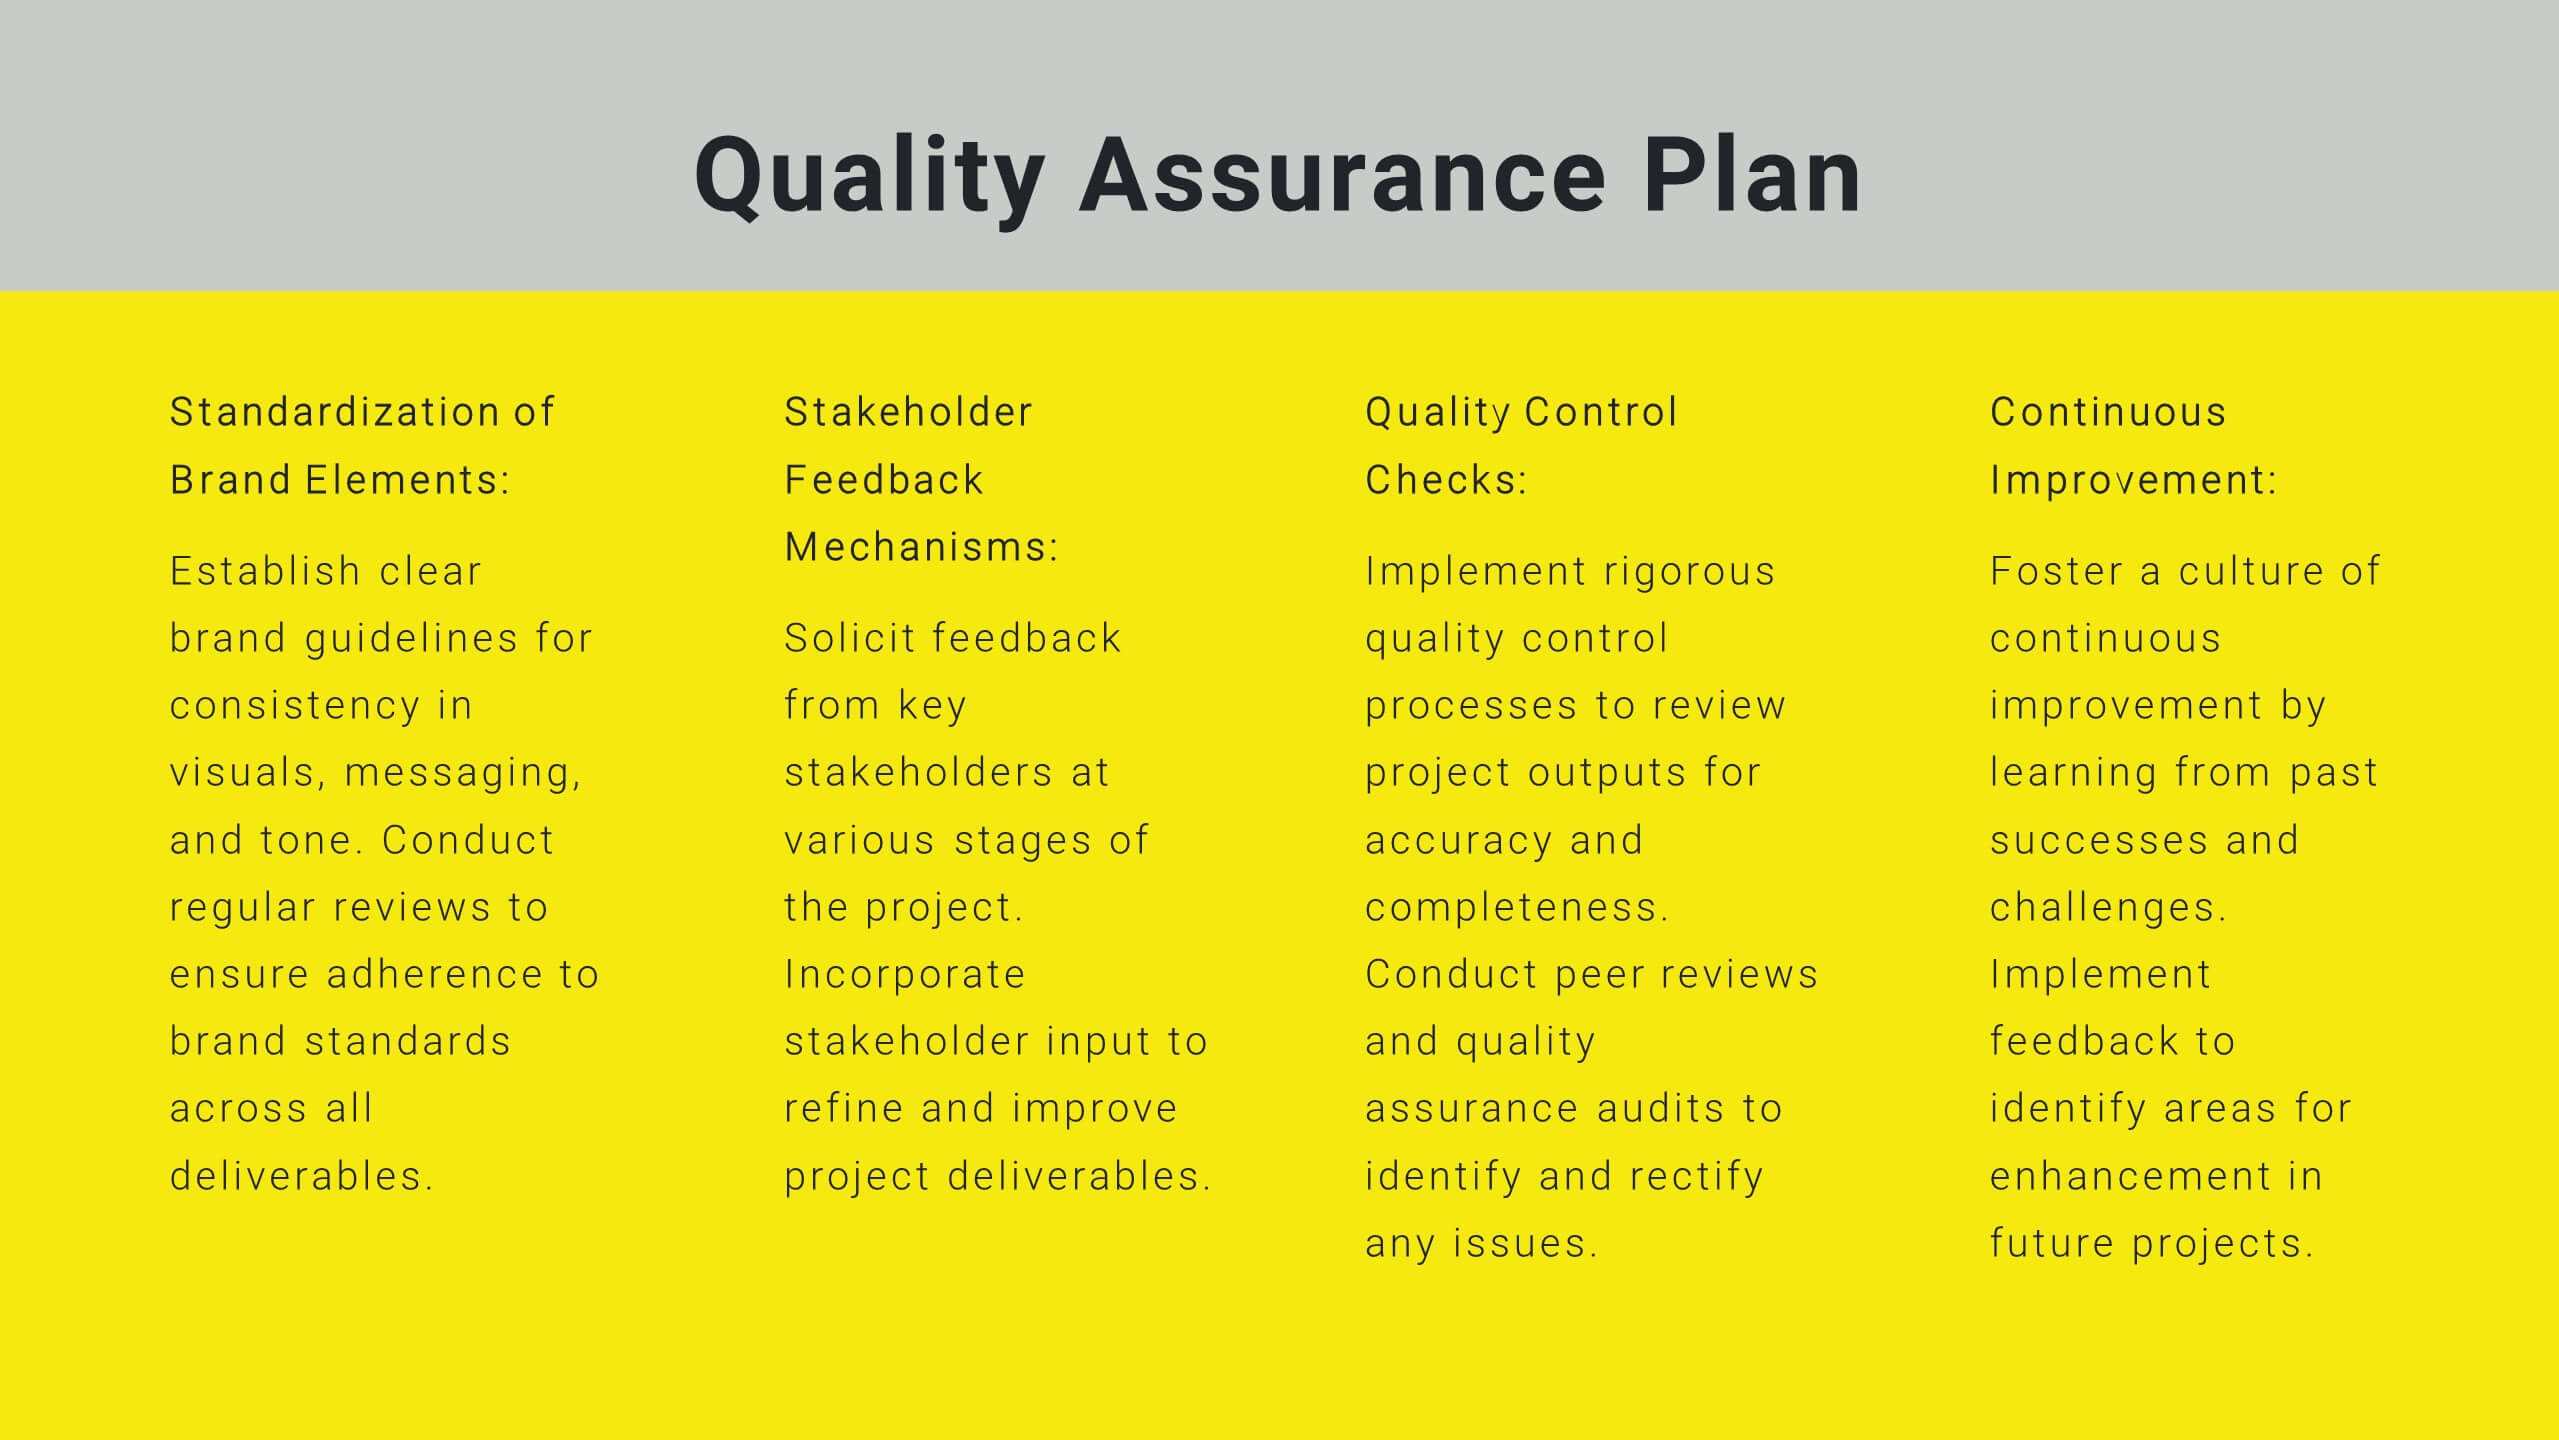
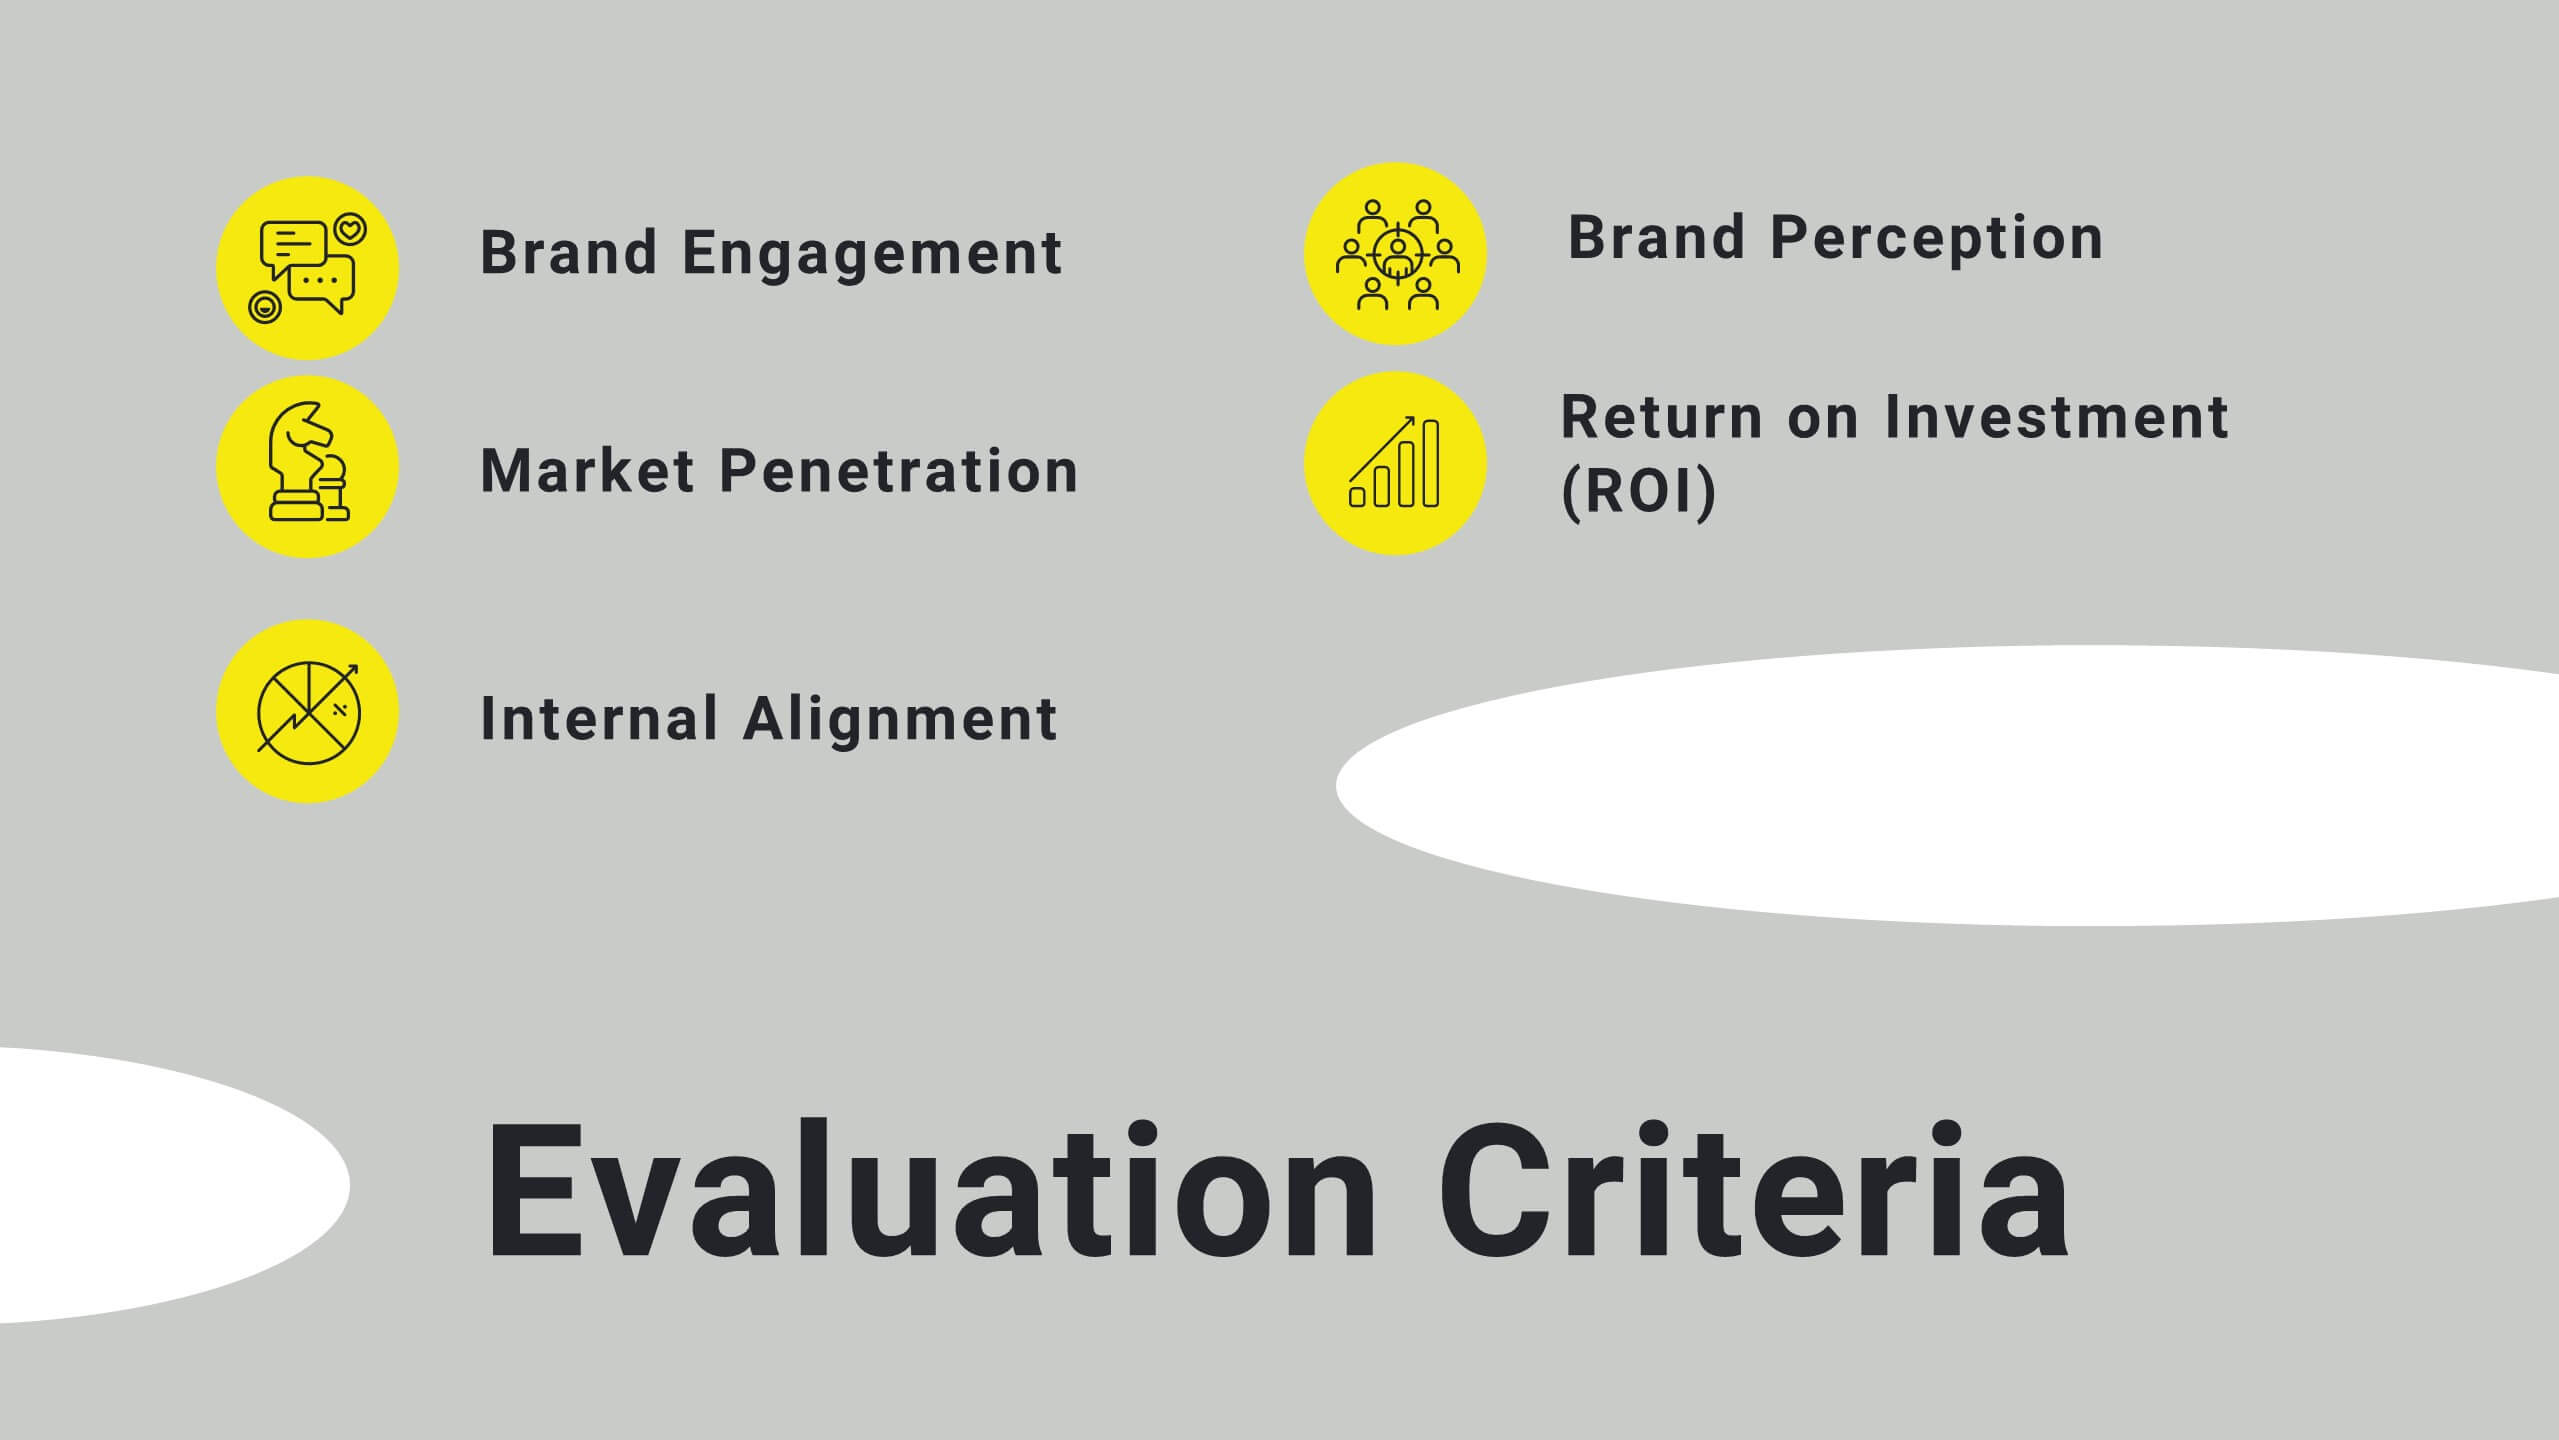
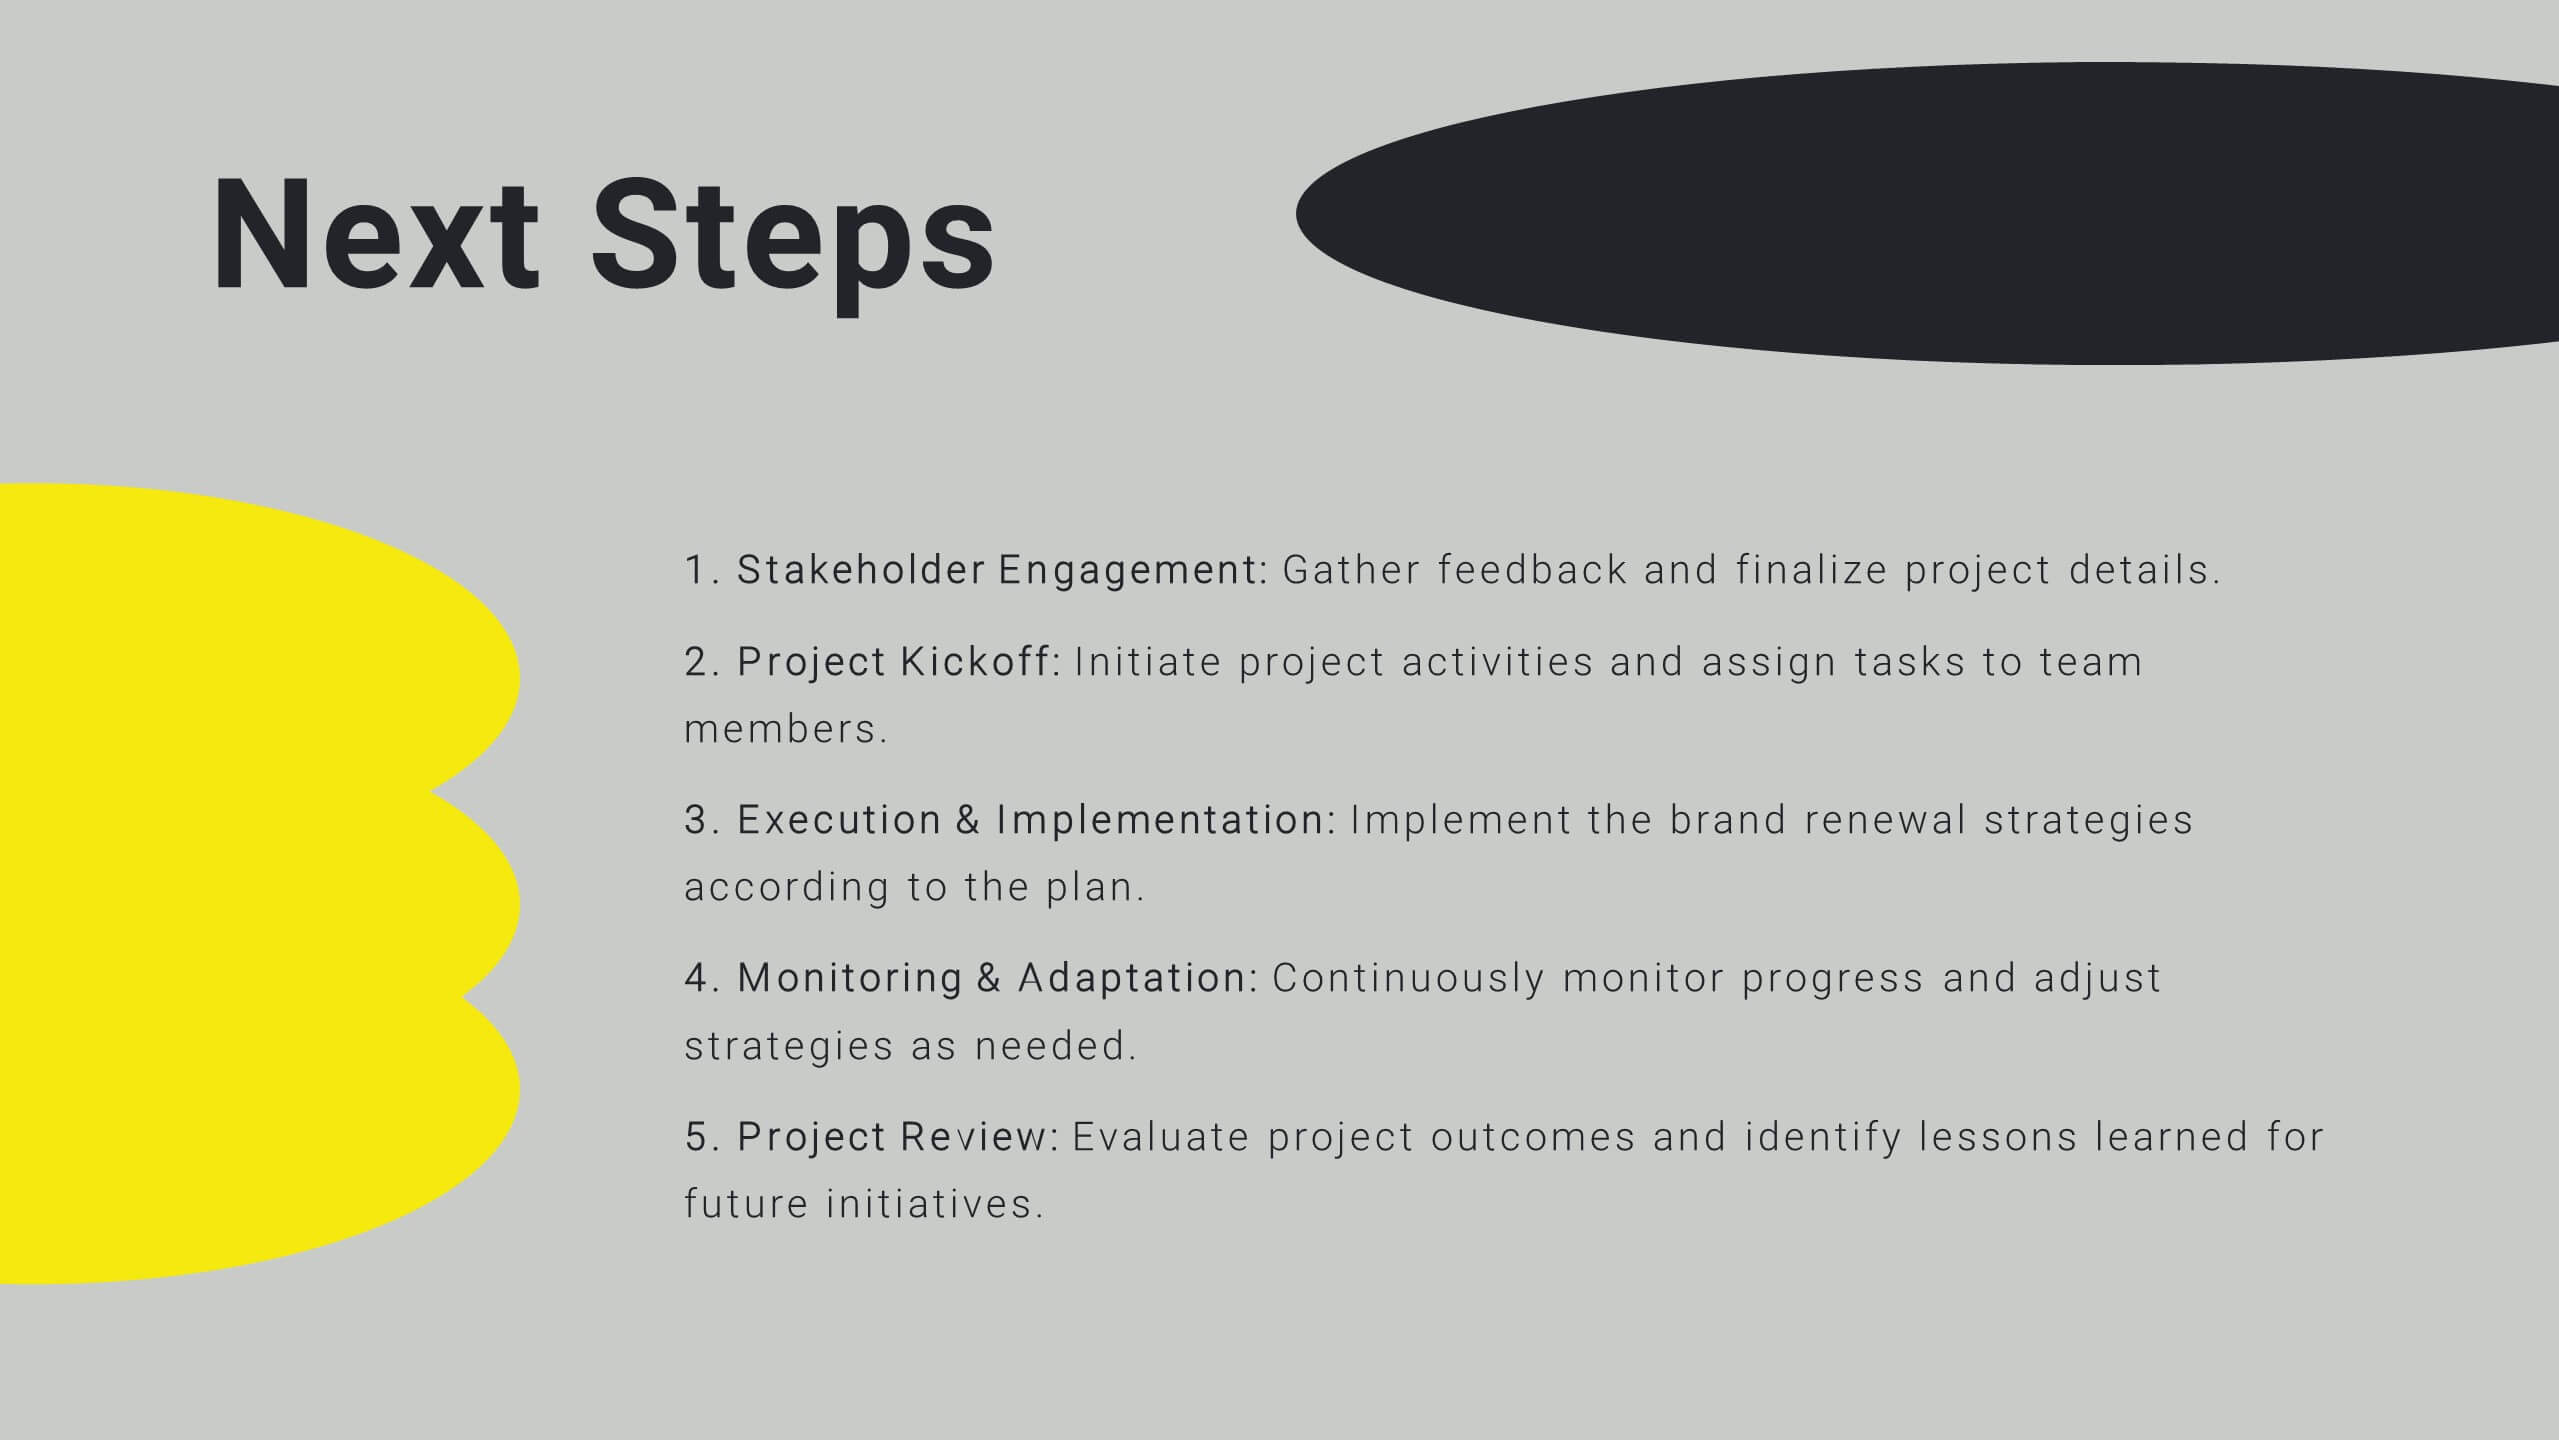
Sable Detailed Project Execution Plan Presentation
Master your project planning with this comprehensive execution plan template! Perfect for detailing project overviews, objectives, and timelines, it includes slides for budget breakdowns, resource allocation, and risk management. Ensure every detail is covered with structured content and clear visuals. Compatible with PowerPoint, Keynote, and Google Slides for seamless presentations on any platform.


5 diapositivas
Pricing Strategy and Comparison Table Presentation
Present your pricing plans with clarity and impact using the Pricing Strategy and Comparison Table Presentation. This slide offers a structured layout to compare features, pricing tiers, and plan benefits side-by-side. Perfect for SaaS, services, or product pitches. Fully editable in Canva, PowerPoint, Google Slides, and Keynote.