


Features
- 5 Unique slides
- Fully editable and easy to edit in Microsoft Powerpoint, Keynote and Google Slides
- 16:9 widescreen layout
- Clean and professional designs
- Export to JPG, PDF or send by email


Do you have any questions?
Recommend


7 slides
Food Infographic Presentation Template
A Food Infographic is a visual representation of information and data related to food. It can be used to educate people on various aspects of food such as its nutritional value, cooking methods, and recipes. This template can be presented in a variety of ways, including charts, graphs, illustrations, and images you can customize with your information. The goal of this Food Infographic is to make complex information about food more accessible and easy to understand for the general public. This template works with Powerpoint, Keynote, and Google Slides, so you can use it on any device.


5 slides
Productivity and Time Optimization Presentation
Visualize time-saving strategies and workflow efficiency with this hourglass-themed productivity template. Ideal for illustrating phased progress, deadlines, or time distribution, this design breaks your message into four clear sections with engaging visuals. Fully editable in PowerPoint, Keynote, and Google Slides.
8 slides
Key Project Milestone Tracker
Stay on top of progress with this streamlined Key Project Milestone Tracker. Designed to showcase up to eight critical milestones with corresponding years, this timeline helps visualize project phases and deadlines clearly. Fully editable in PowerPoint, Keynote, and Google Slides for easy customization.


5 slides
Importance of Sex Education Infographics
Sex Education is an important aspect of human development, but it can be a difficult topic to discuss. It is important for individuals to be knowledgeable about their own bodies and health, as well as understand healthy relationships and consent. These Infographics are visual tools designed to illustrate the need for sex education in schools and society. This template includes statistics, data, and facts about the benefits of sex education, including reducing the risk of sexually transmitted infections and unintended pregnancies, promoting healthy relationships, and empowering young people to make informed decisions about their sexual health.


6 slides
Bubble Map Ideas Infographics
Visualize your ideas creatively with our Bubble Map Ideas infographic template. This template is fully compatible with popular presentation software like PowerPoint, Keynote, and Google Slides, allowing you to easily customize it to brainstorm and organize your concepts using a bubble map format. The Bubble Map Ideas infographic template offers a visually engaging platform to brainstorm and categorize ideas, concepts, and relationships in a structured and visually appealing manner. Whether you're a creative thinker, project manager, or educator, this template provides a user-friendly canvas to create informative presentations and visualizations of your ideas. Elevate your idea generation and organization with this SEO-optimized Bubble Map Ideas infographic template, thoughtfully designed for clarity and ease of use. Customize it to map out your ideas, prioritize them, and identify key connections, ensuring that your creative process becomes more organized and productive. Start crafting your personalized infographic today to bring your ideas to life.


7 slides
Human Anatomy Infographic Presentation
The Human Anatomy is the study of the structure and organization of the human body. This template is perfect for illustrating the most important aspects of anatomy and physiology in a fun, colorful way. This infographic is perfect for students, teachers, and medical practitioners. With this anatomy presentation, you can show how all organs, bones and tissues are connected together to make up incredible living organisms known as humans. Compatible with Powerpoint, keynote and google slides, this infographic template is a great way to explain each human organ in a simple and informative way.


6 slides
Leadership and Business Teamwork Presentation
Drive results through synergy with this dynamic Leadership and Business Teamwork presentation slide. Designed with a six-part segmented pie chart, this layout helps visualize collaborative frameworks, team roles, or leadership models in an engaging way. Ideal for team workshops, leadership development, or strategic planning meetings. Easy to personalize in PowerPoint, Keynote, or Google Slides.


6 slides
5-Step SEO Marketing Funnel Presentation
Ignite your marketing story with a bold, flowing visual that makes every step feel purposeful and easy to follow. This presentation breaks down each stage of the SEO funnel, helping you explain strategy, performance, and conversion paths with clarity. Fully compatible with PowerPoint, Keynote, and Google Slides.


4 slides
Customer-Focused Benefit Breakdown Presentation
Put your audience at the center with the Customer-Focused Benefit Breakdown Presentation. This slide design features a spotlight-style layout that emphasizes user-centric advantages and clearly communicates your value propositions. Ideal for marketing plans, sales strategies, or user journey analysis. Fully customizable and compatible with PowerPoint, Keynote, and Google Slides.


7 slides
Digital Marketing Services Infographic
A Digital Marketing Services Infographic is a visual representation of information and data related to digital marketing services. This template is a type of graphic design that presents complex or large amounts of information in a simple and informative way. This infographic includes statistics, charts, graphs, and other visual elements to convey your information about various aspects of digital marketing, such as social media marketing, content marketing, search engine optimization, email marketing, and paid advertising. Compatible with Powerpoint, Keynote and Google Slides.


5 slides
RACI Role Assignment Matrix Overview Presentation
Clarify team responsibilities with the RACI Role Assignment Matrix Overview Presentation. This professional template helps define who is Responsible, Accountable, Consulted, and Informed across key project tasks. Perfect for streamlining communication, reducing overlap, and improving accountability. Fully editable in PowerPoint, Canva, and Google Slides.
21 slides
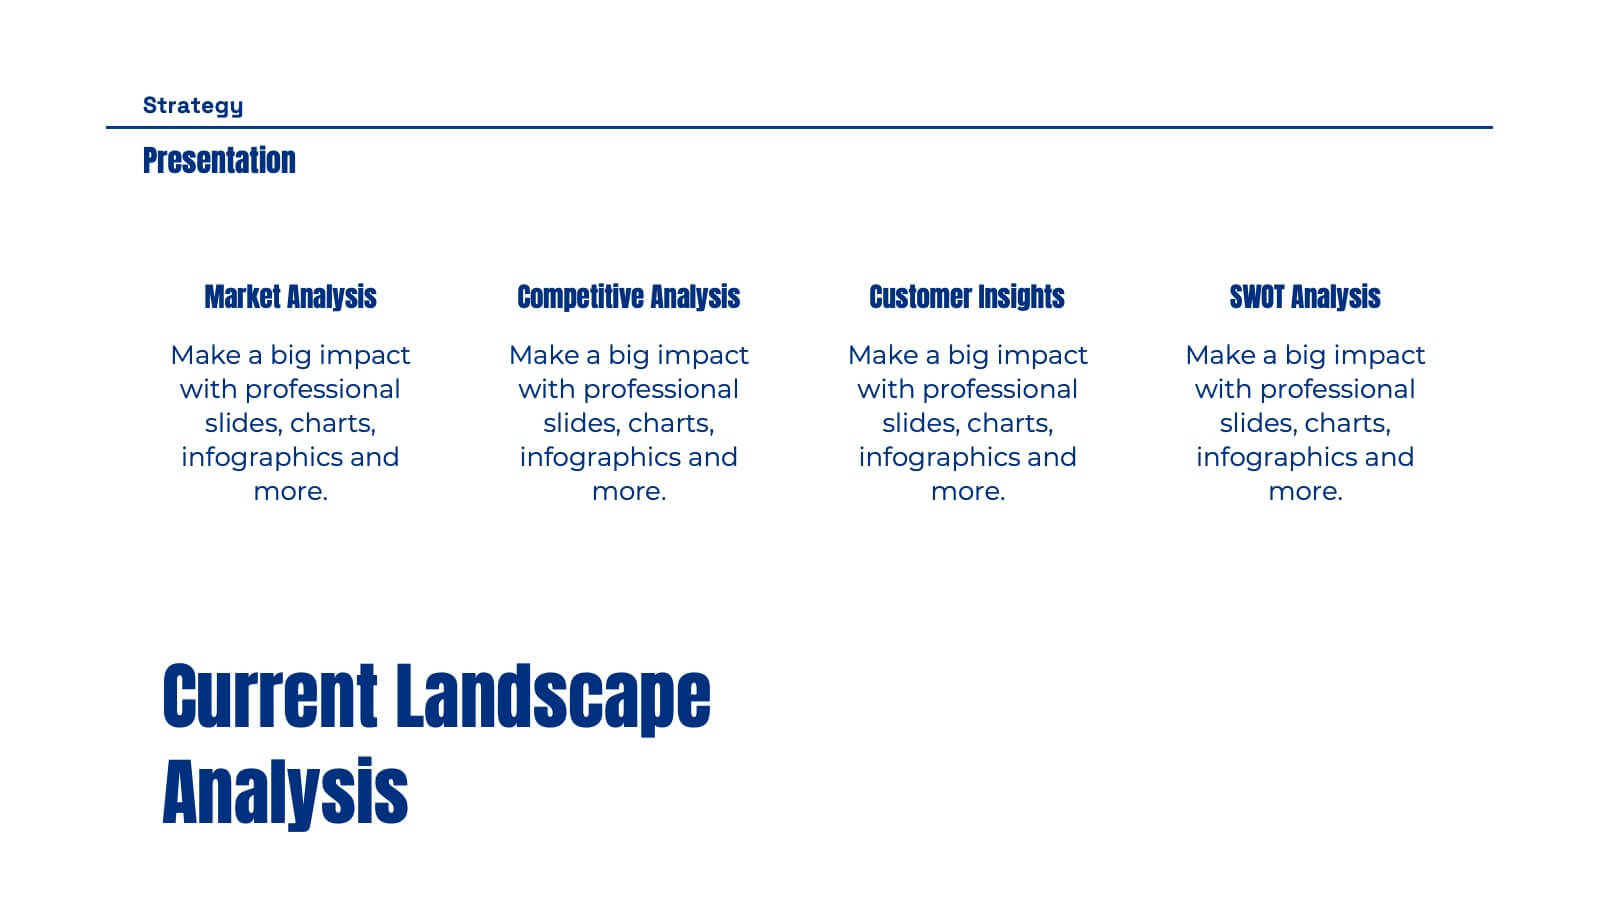
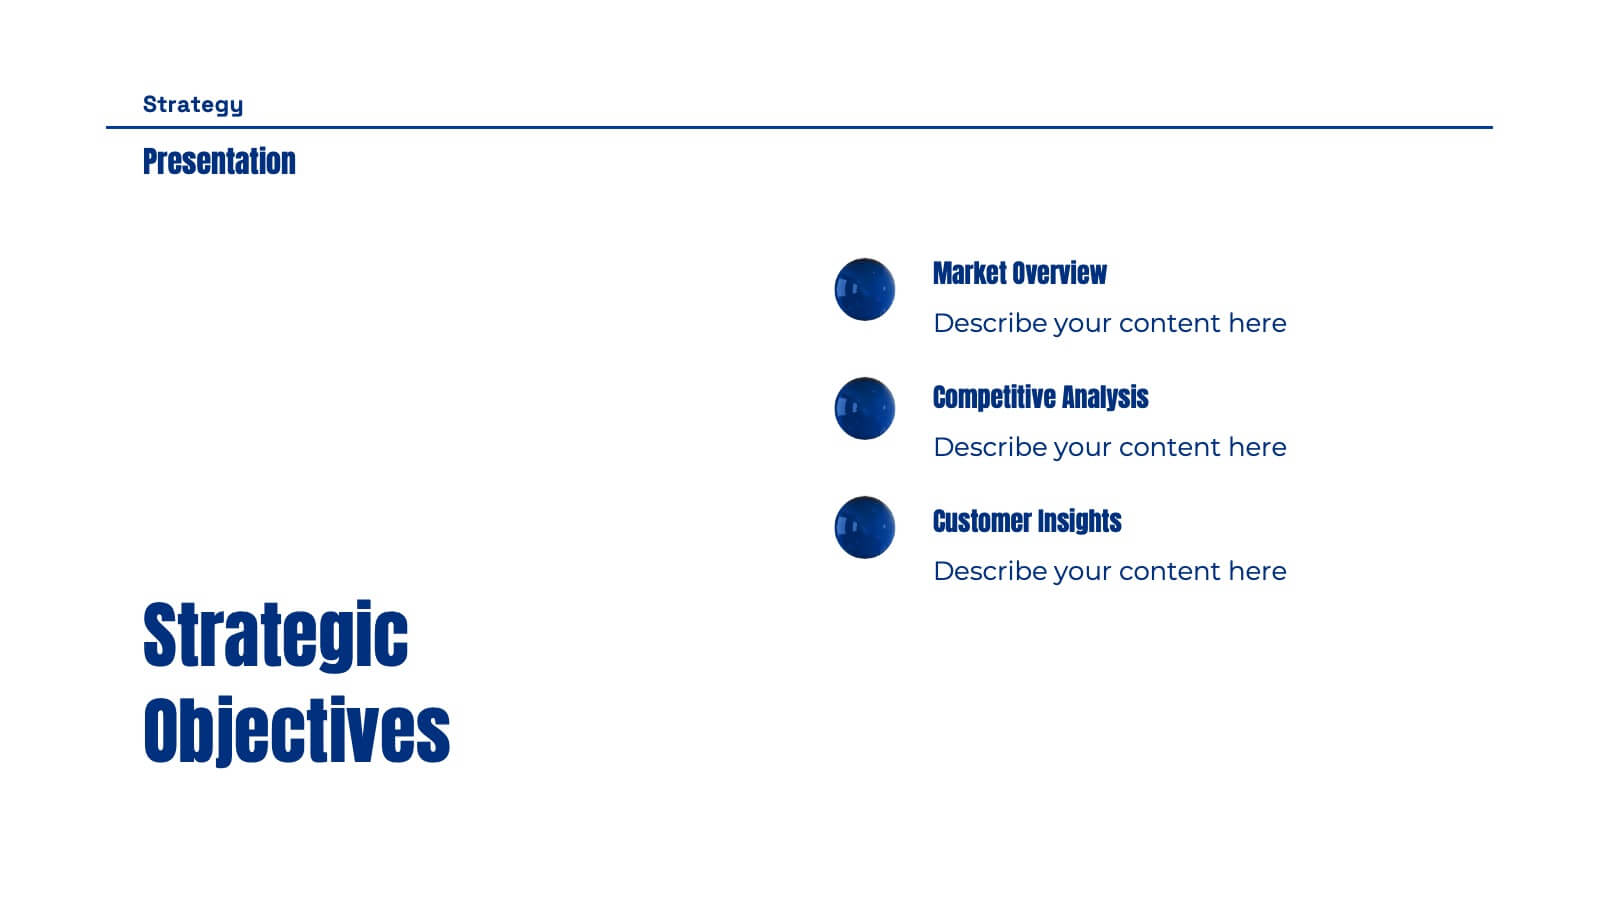
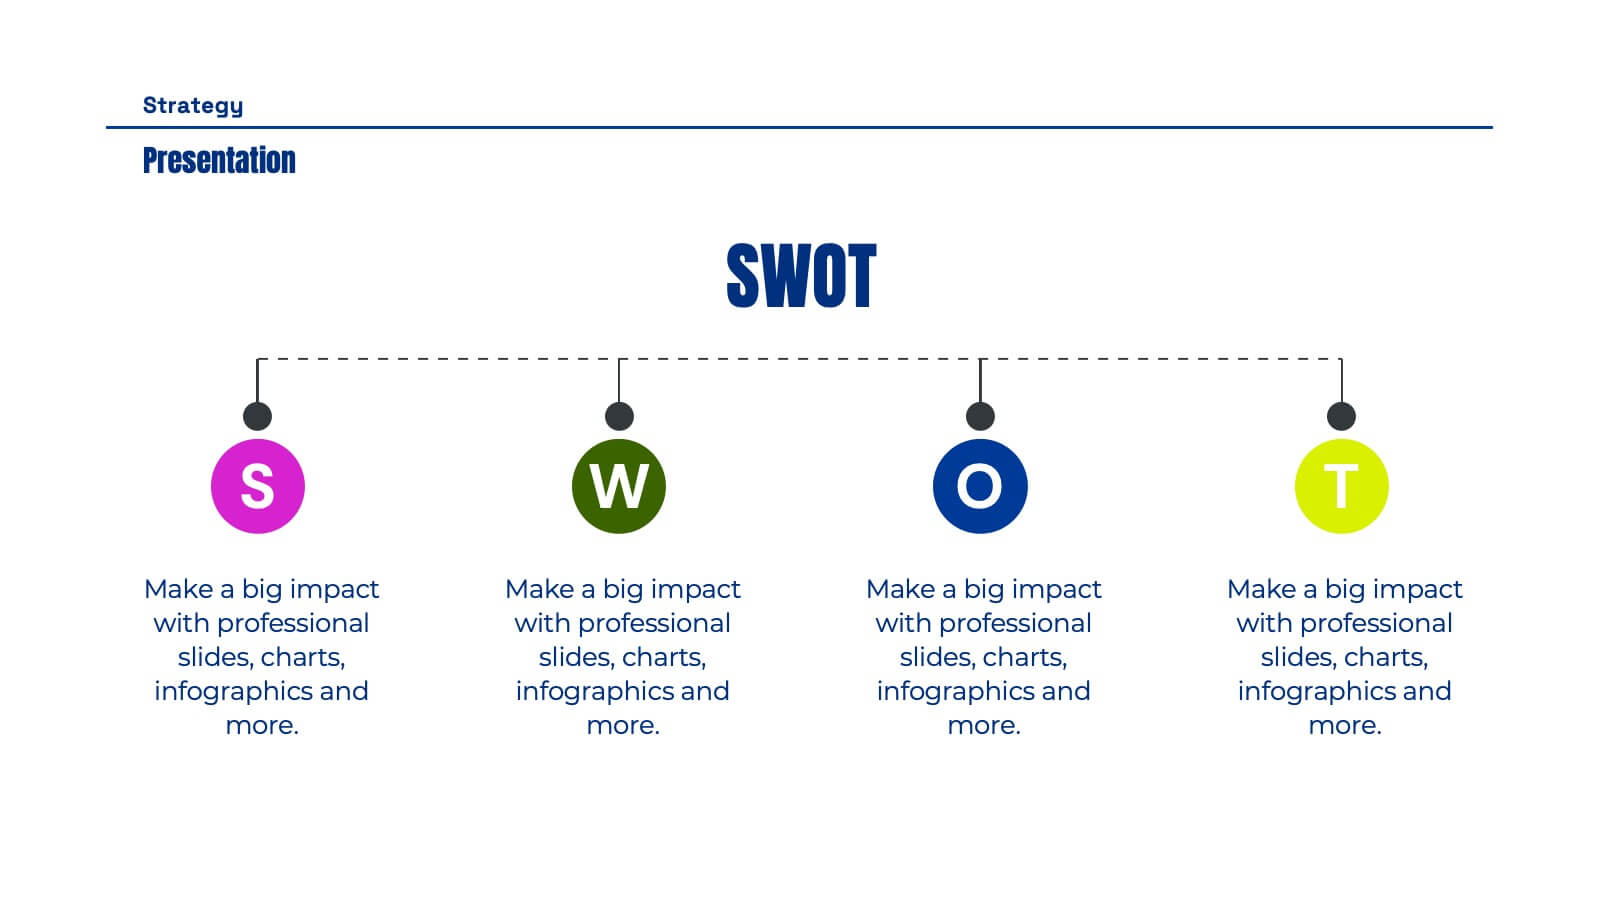
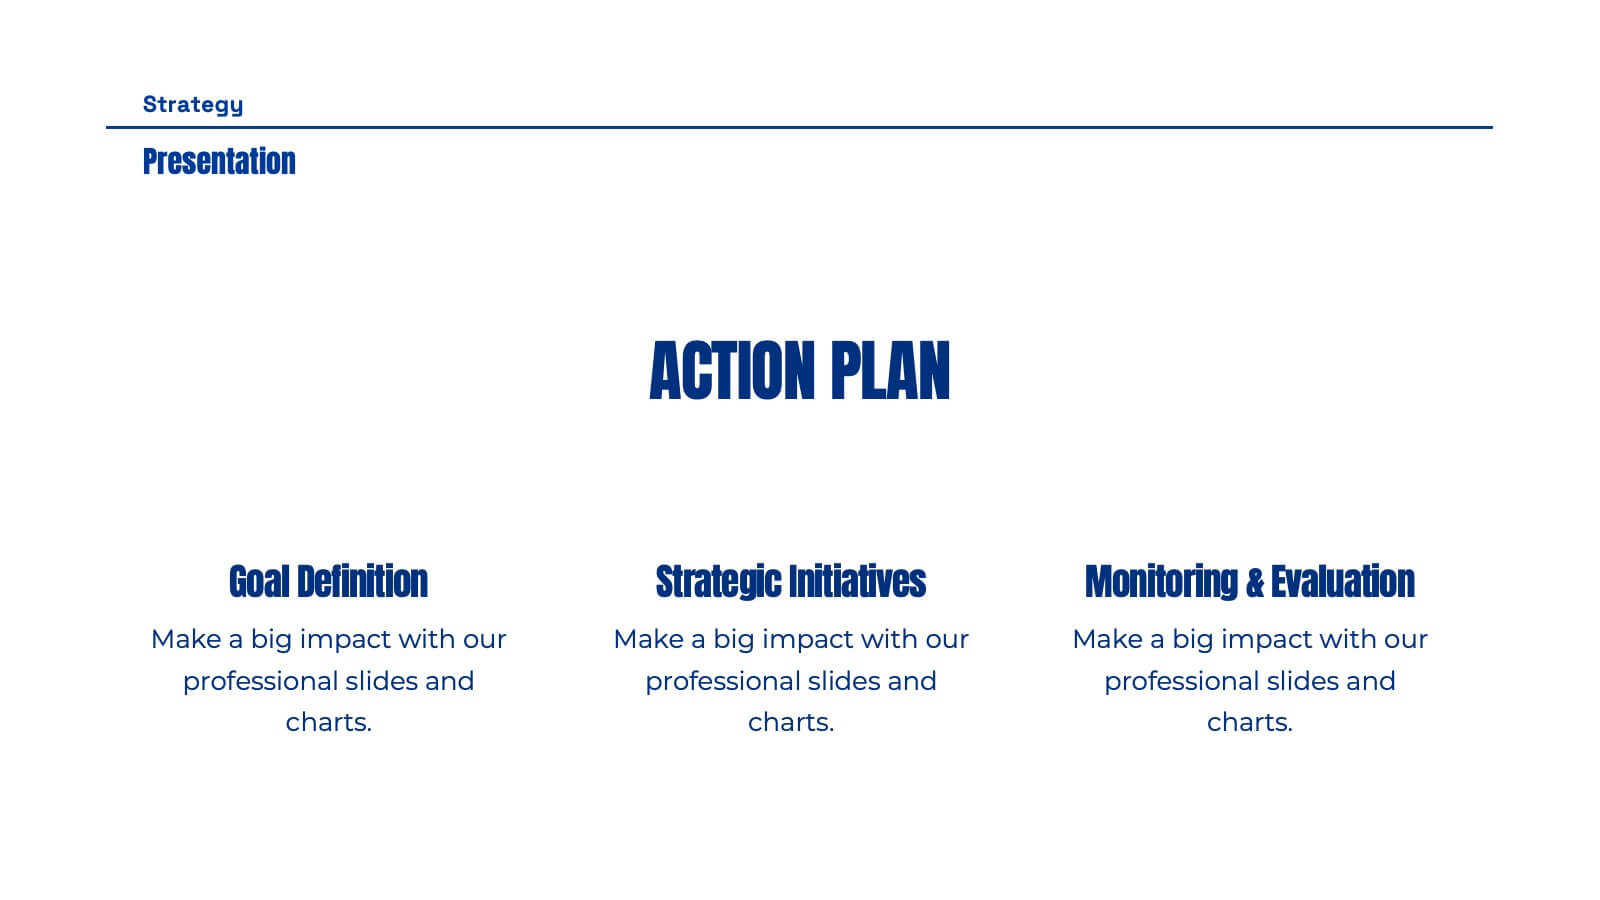
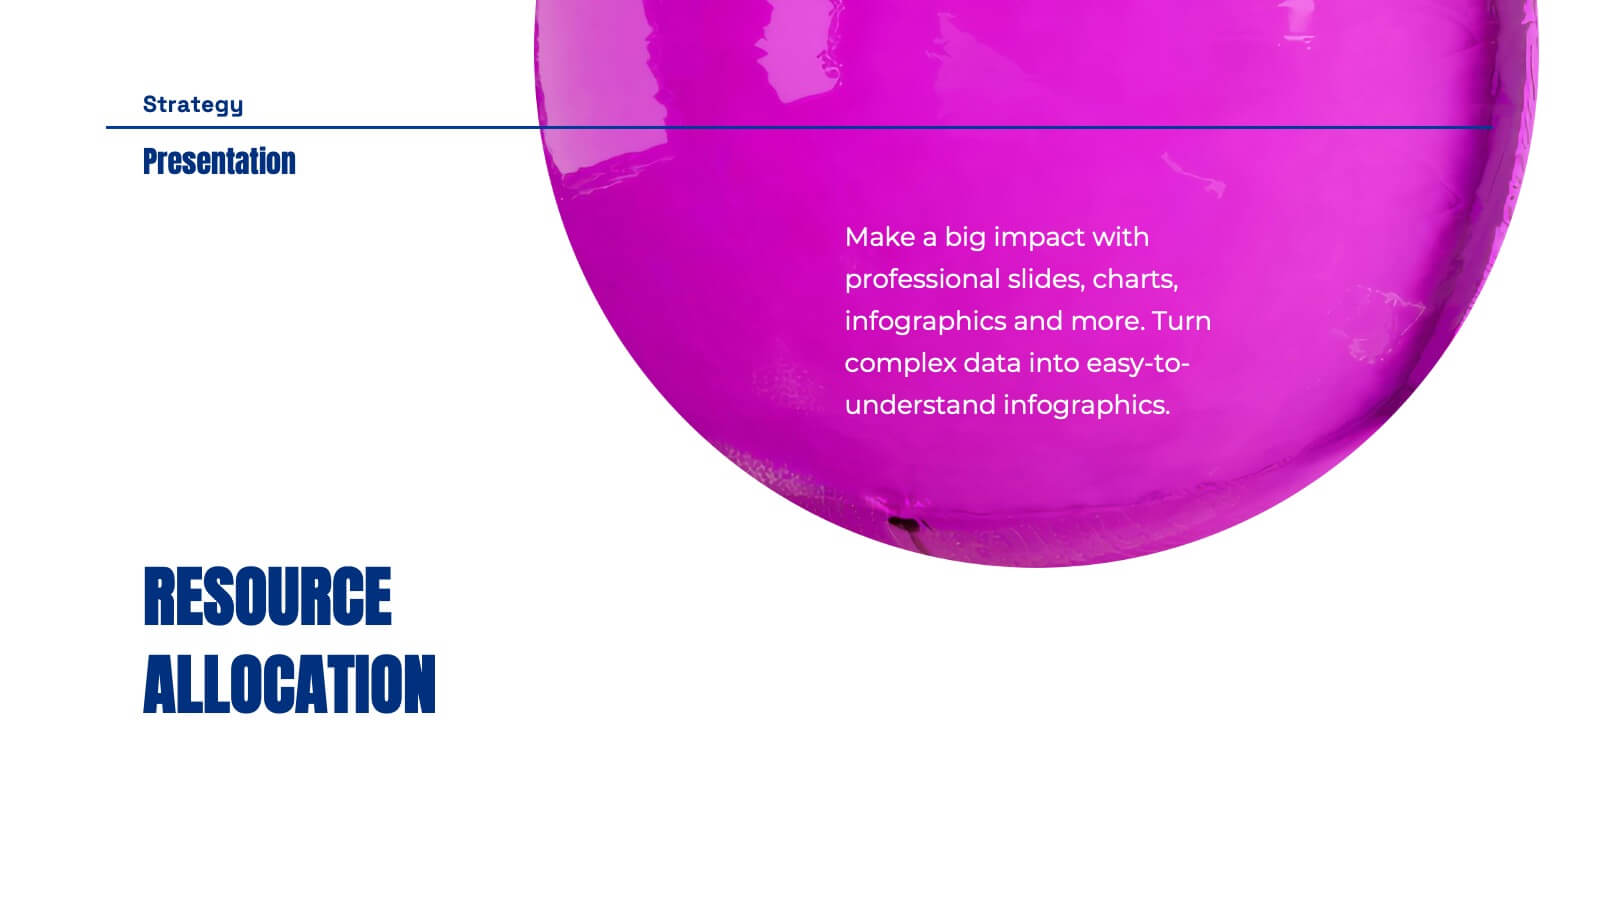
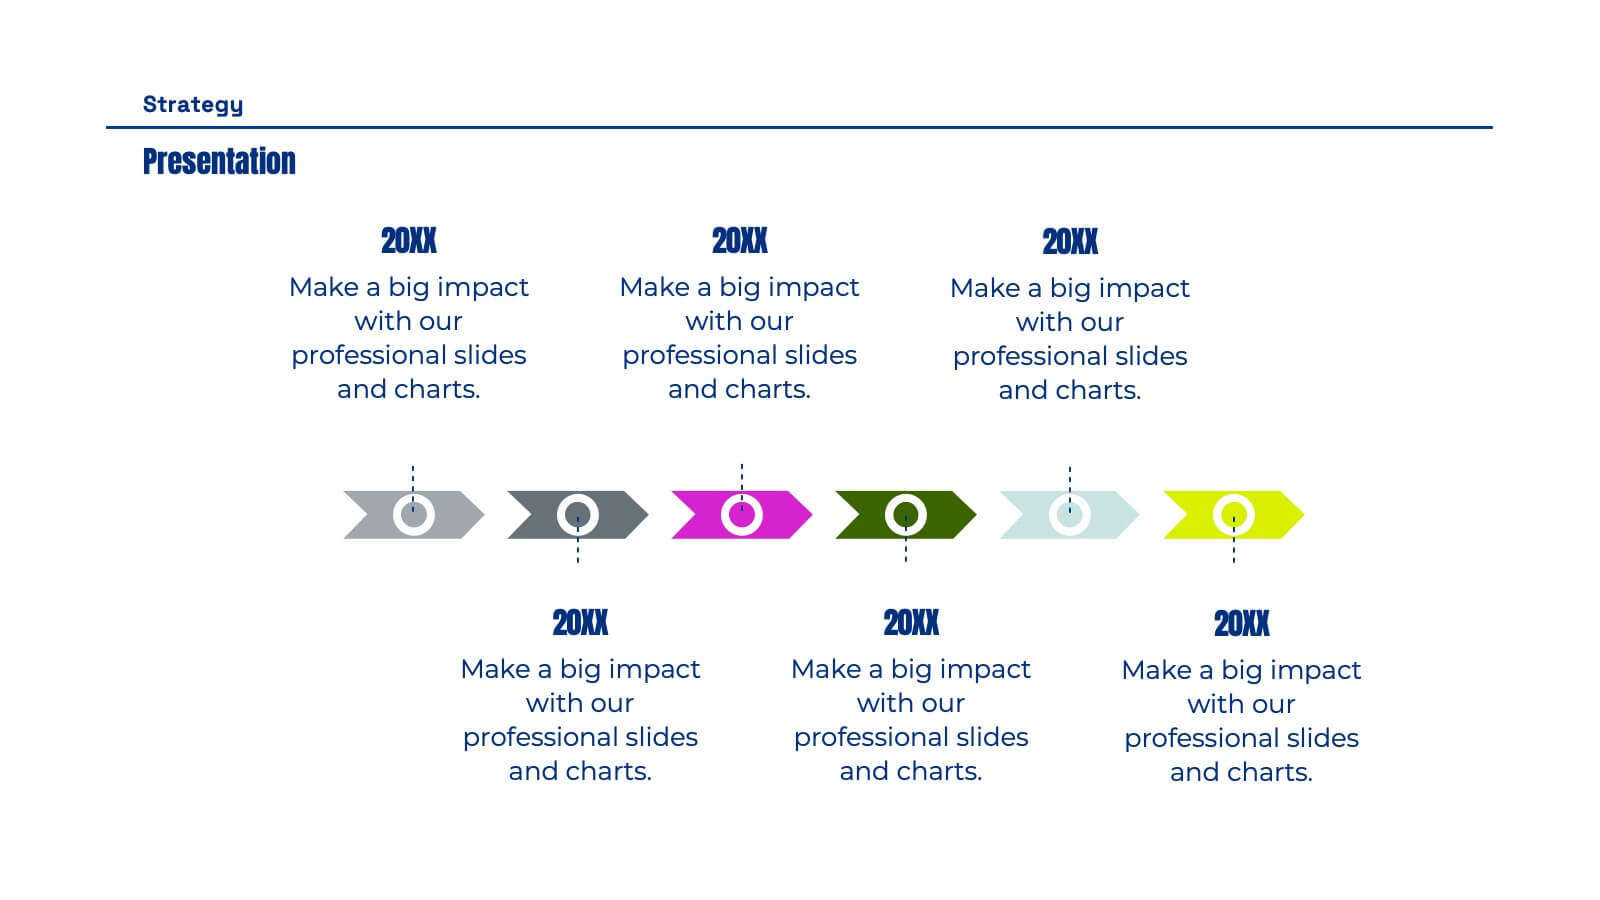
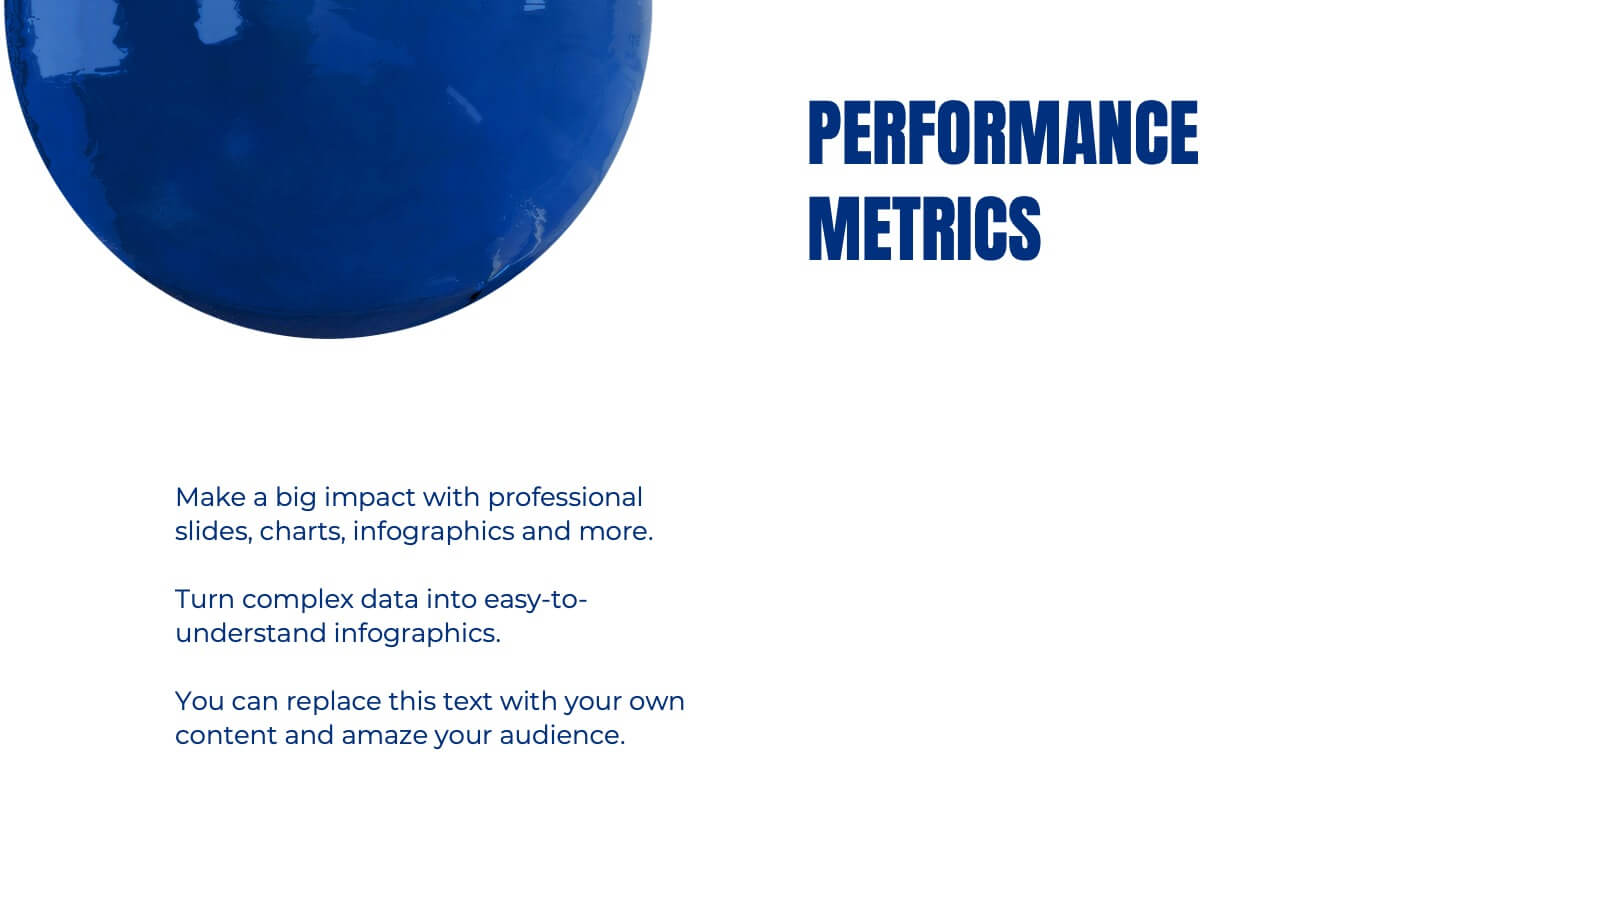
Ops Business Strategy Presentation
Set your strategy in motion with this dynamic, visually striking presentation template! Perfect for conveying key business insights like competitive analysis, market trends, and strategic objectives, it helps organize your plan for success. Each slide focuses on clarity and effectiveness, making it ideal for impactful presentations. Compatible with PowerPoint, Keynote, and Google Slides for effortless use across platforms.


21 slides
Sungrove Startup Strategy Presentation
Define and present your startup strategy with this sleek and dynamic template, tailored for showcasing innovative plans and competitive positioning. Dive into key slides like customer needs and market insights, business model breakdown, and unique value proposition to clearly outline your vision. Highlight target market analysis, financial forecasts, and growth projections to ensure stakeholders grasp the potential of your business. The template also includes sections for team introductions, infrastructure planning, and competitor landscape analysis to give a holistic overview of your strategy. Designed for customization and compatibility with PowerPoint, Google Slides, and Keynote, this template is perfect for entrepreneurs or startups aiming to deliver a compelling presentation.


4 slides
Digital Education and Online Learning Tools Presentation
Bring your audience straight into the world of modern learning with a clear, engaging layout that highlights essential digital tools and online teaching methods. This presentation breaks down key platforms, features, and benefits in a simple visual flow that’s easy to follow. Fully compatible with PowerPoint, Keynote, and Google Slides.


4 slides
School Administration and Curriculum Planning Presentation
Streamline academic operations with the School Administration and Curriculum Planning Diagram. This structured template helps educators, administrators, and school leaders effectively visualize curriculum structures, plan schedules, and organize school management tasks. Designed for clarity and efficiency, it ensures a seamless planning experience for any educational institution. Fully customizable and compatible with PowerPoint, Keynote, and Google Slides.


4 slides
Competitive Advantage Blue Ocean Strategy
Highlight strategic positioning with this Competitive Advantage Blue Ocean template. Designed with clear flow visuals and modern iconography, it’s perfect for showcasing unique value propositions, competitive edges, and market leadership strategies. Easy to edit in PowerPoint, Keynote, and Google Slides for seamless customization.


7 slides
Tables of Content Infographic Presentation Template
A table of contents infographic can serve as a visual representation of the content outline and help to convey the overall structure and organization of the information. This template displays the headings and subheadings of the document, along with the page numbers or slide numbers, in an easy-to-follow format. The purpose of our table of contents infographic template is to provide an overview of the content and help you navigate the presentation more efficiently. It is often used in academic papers, reports, magazines, and books, and can also be used in digital documents and presentations.