


Features
- 26 Unique slides
- Fully editable and easy to edit in Microsoft Powerpoint, Keynote and Google Slides
- 16:9 widescreen layout
- Clean and professional designs
- Export to JPG, PDF or send by email


Do you have any questions?
Recommend


5 slides
Planning and Delivery in Five Phases Presentation
Guide your audience through each step of your execution plan using the Planning and Delivery in Five Phases Presentation. This clean, drop-pin style layout highlights five essential milestones for structured delivery and progress tracking. Each phase is color-coded for easy reference. Fully editable in PowerPoint, Keynote, Google Slides, and Canva.


19 slides
Kinetic Sales Forecast Presentation
Forecast your sales with style using this vibrant template! Perfect for detailing company overview, sales process, team, and strategy. Includes sections for case studies, pricing, and future opportunities. Ideal for sales teams to impress stakeholders. Compatible with PowerPoint, Keynote, and Google Slides.


4 slides
Aviation Logistics and Scheduling Presentation
Coordinate timelines and optimize operations with the Aviation Logistics and Scheduling presentation. This layout uses a control tower illustration to visualize four key scheduling points—ideal for showcasing flight operations, airport coordination, or air traffic planning. Great for logistics teams, airline operations managers, or aviation consultants. Fully editable in PowerPoint, Keynote, and Google Slides.


6 slides
Big Data Visualization Dashboard Presentation
Bring your data story to life with a slide that feels dynamic, modern, and effortlessly clear. This presentation highlights key metrics through clean icons and a bold circular progress graphic, making complex information easy to follow and visually engaging. Perfect for sharing insights, tracking performance, or presenting analytics updates. Fully compatible with PowerPoint, Keynote, and Google Slides.


8 slides
South America Business Development Map Presentation
Unlock market potential with the South America Business Development Map template, an essential tool for professionals showcasing key insights and growth opportunities across the region. It features a customizable map and percentage indicators for various metrics, ideal for presenting business development opportunities in a visually engaging format. This template is perfect for creating dynamic and informative presentations tailored to regional analysis and development strategies.


5 slides
Product Development to Decline Model Presentation
Showcase the full journey of a product from its inception to phase-out with the Product Development to Decline Model presentation. This circular diagram clearly outlines the four core stages, ideal for product managers, business analysts, and strategic planners. Each section features clean icons and editable text zones to highlight key insights and milestones. Fully customizable in PowerPoint, Keynote, and Google Slides.


21 slides
Janus Project Timeline Presentation
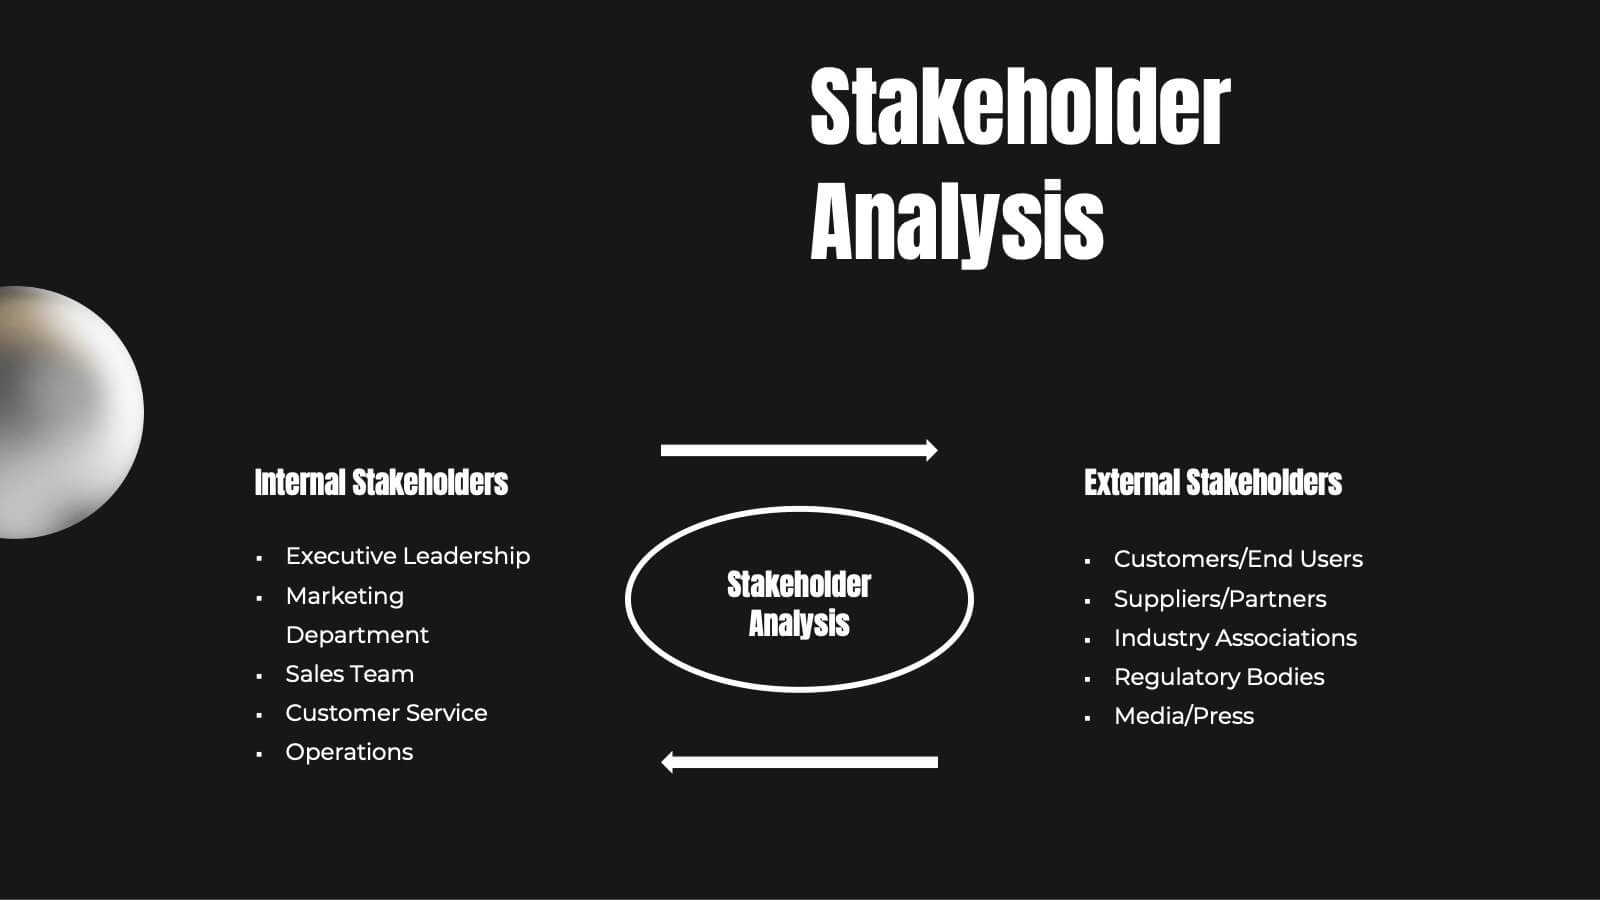
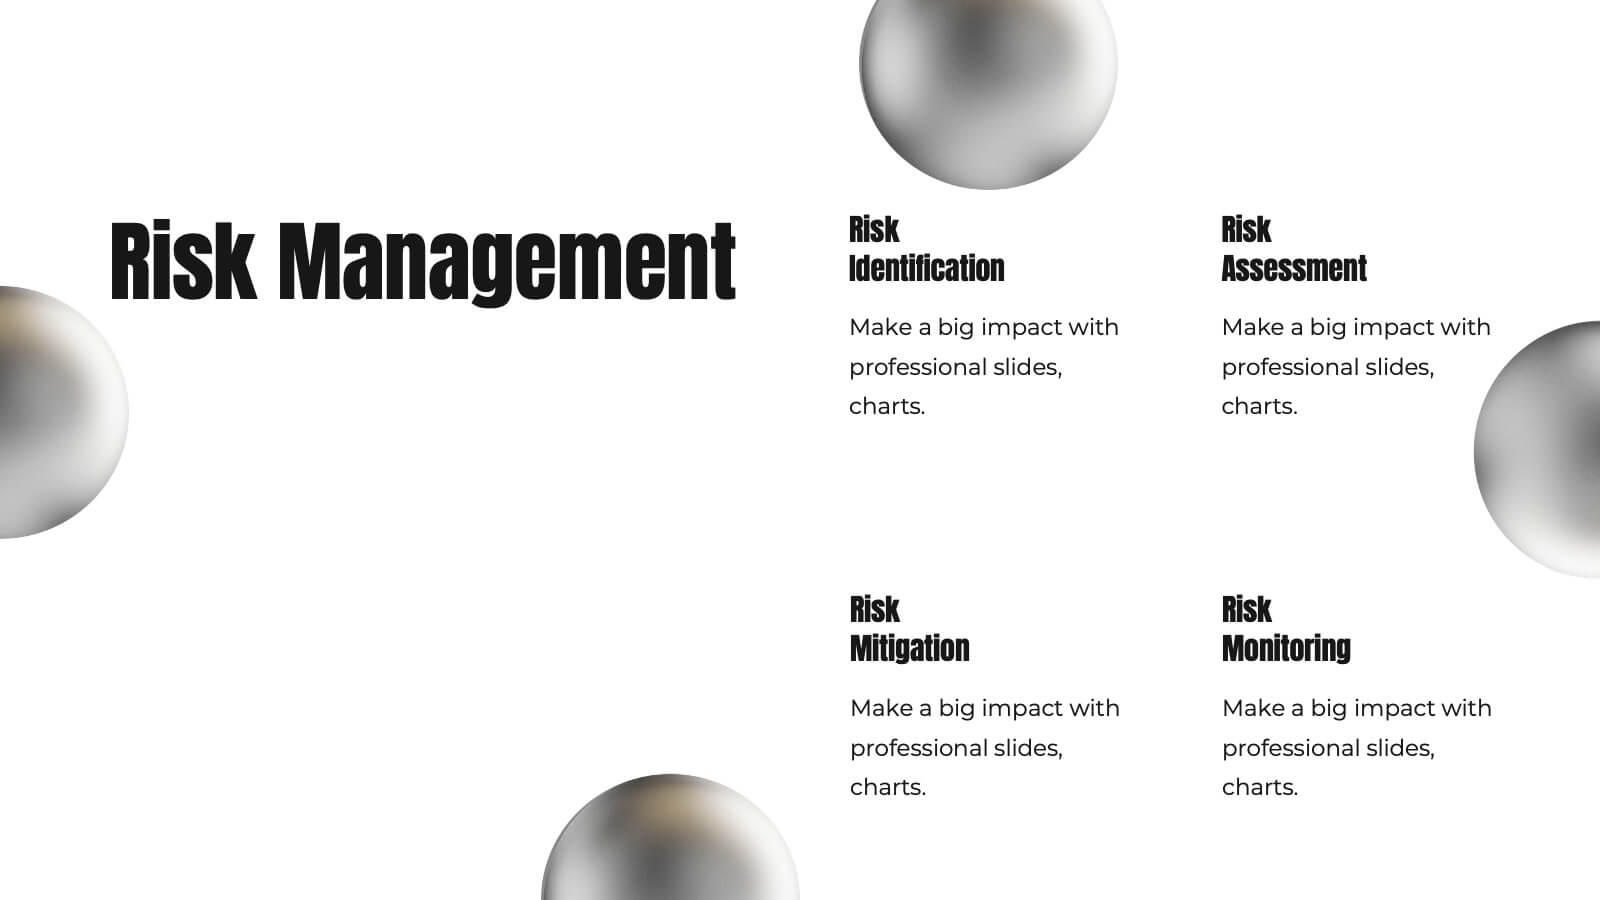
Craft a seamless project plan with this sleek and professional presentation template! Designed to guide you through every step, from project overview and scope of work to risk management and resource allocation, this template covers all the essentials. It's perfect for keeping your team on track with clear deliverables, timelines, and evaluation criteria. Compatible with PowerPoint, Keynote, and Google Slides for effortless presentations.


6 slides
Real Estate and Building Development
Visualize the complete property development process with this modern, keyhole-inspired presentation design. Ideal for real estate developers, architects, and construction planners, this slide clearly outlines six project stages—from concept to completion—using bold icons and a radial layout. Editable in PowerPoint, Keynote, and Google Slides.


24 slides
Wanderra UX Design Presentation
Elevate your user experience strategy with this comprehensive presentation template. Covering key aspects such as personas, wireframes, usability guidelines, and design systems, this template helps you create engaging and intuitive experiences. Fully customizable and compatible with PowerPoint, Keynote, and Google Slides.


7 slides
Modern Food Menu Presentation
Bring your ideas to the table with a clean and modern layout that turns any food-related content into an easy, visually appealing story. This presentation helps you showcase dishes, categories, or menu insights with clarity and style, making information simple to follow. Fully compatible with PowerPoint, Keynote, and Google Slides.


5 slides
Target Market and Audience Segmentation Presentation
Identify and engage your ideal audience with the Target Market and Audience Segmentation presentation. This clear, timeline-style infographic uses a bullseye layout to highlight key market segments and their progression. Ideal for marketing strategies, customer profiling, and campaign planning. Fully customizable in Canva, PowerPoint, and Google Slides.


6 slides
Startup Goals and MVP Rollout Plan Presentation
Launch with clarity using the Startup Goals and MVP Rollout Plan Presentation. This dynamic circular layout features a rocket icon and segmented design to represent phased growth and product milestones. Ideal for showcasing early-stage priorities, MVP deliverables, and go-to-market strategies. Compatible with PowerPoint, Keynote, Google Slides, and Canva for full customization.


28 slides
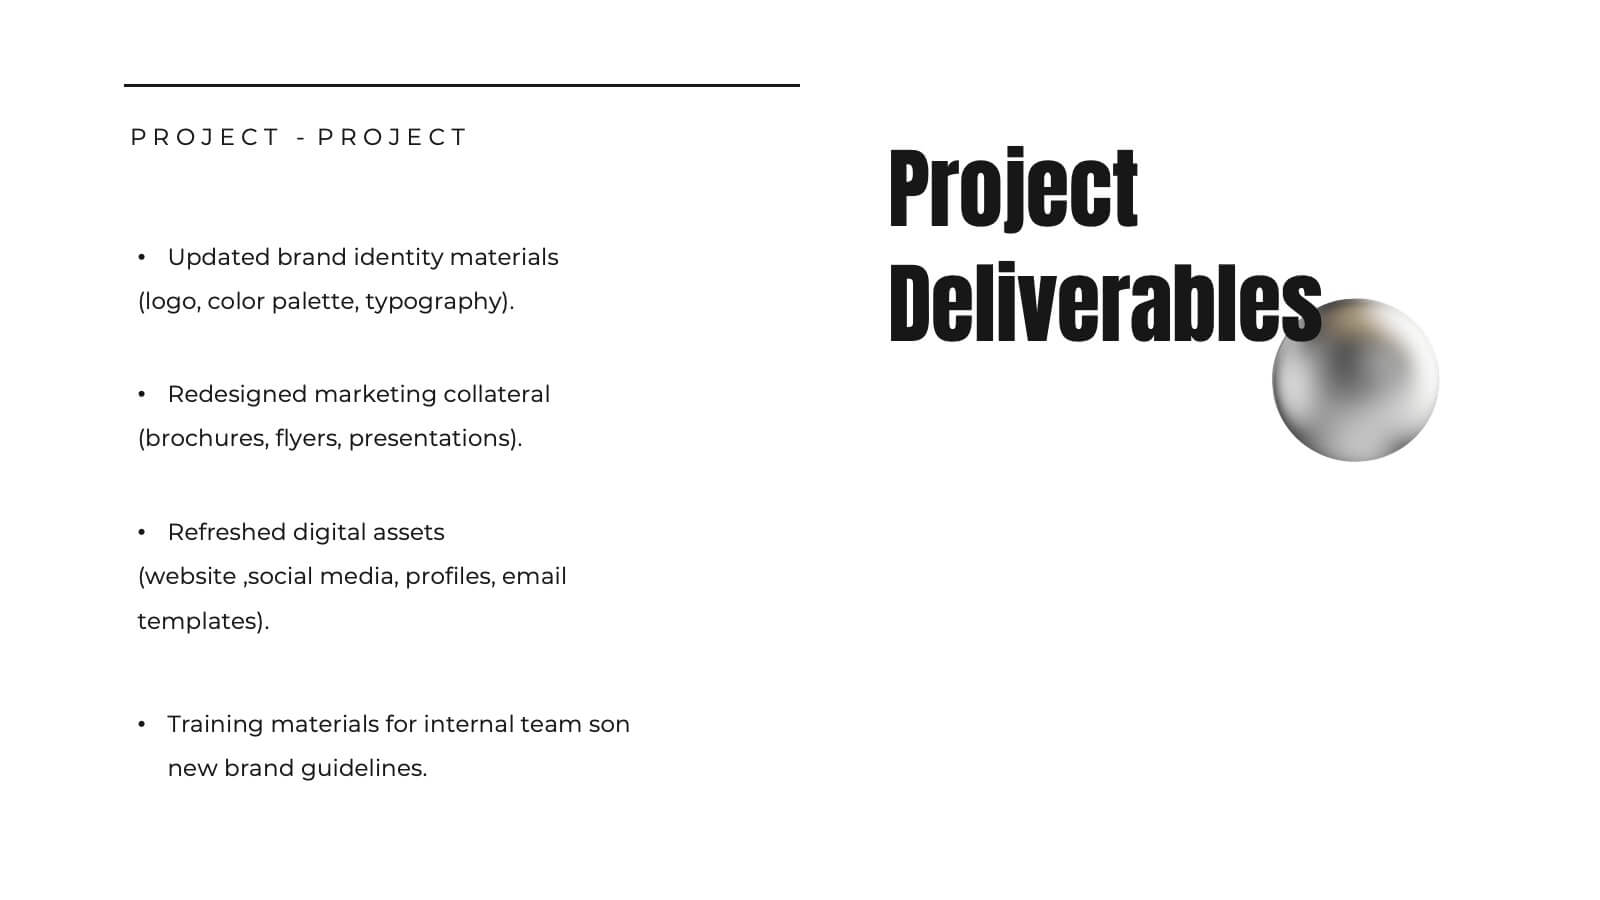
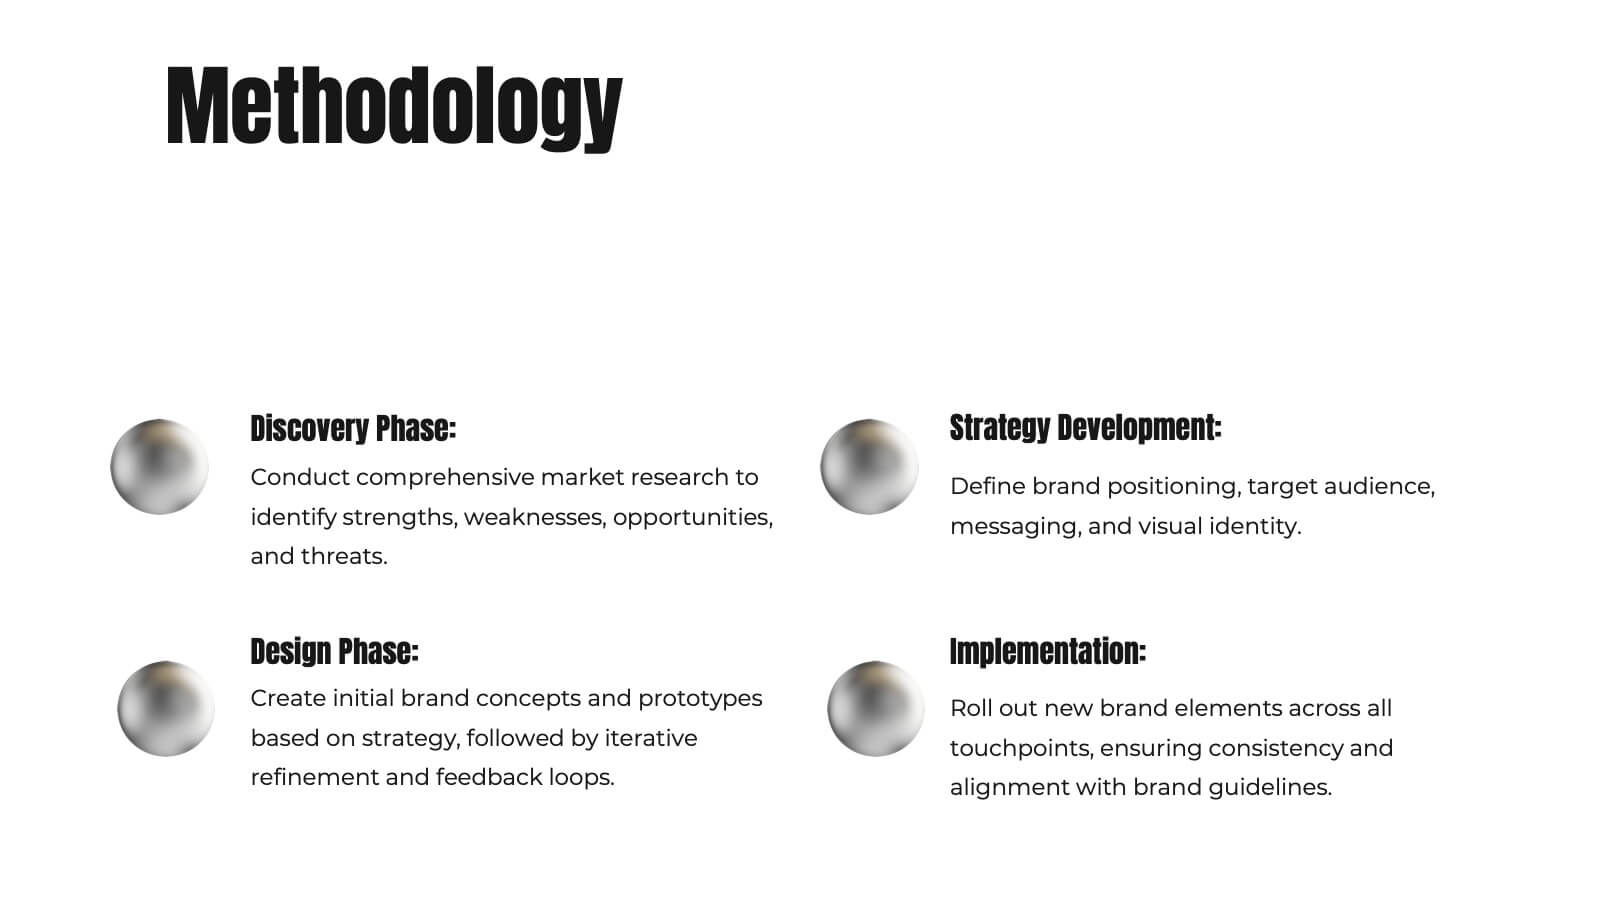
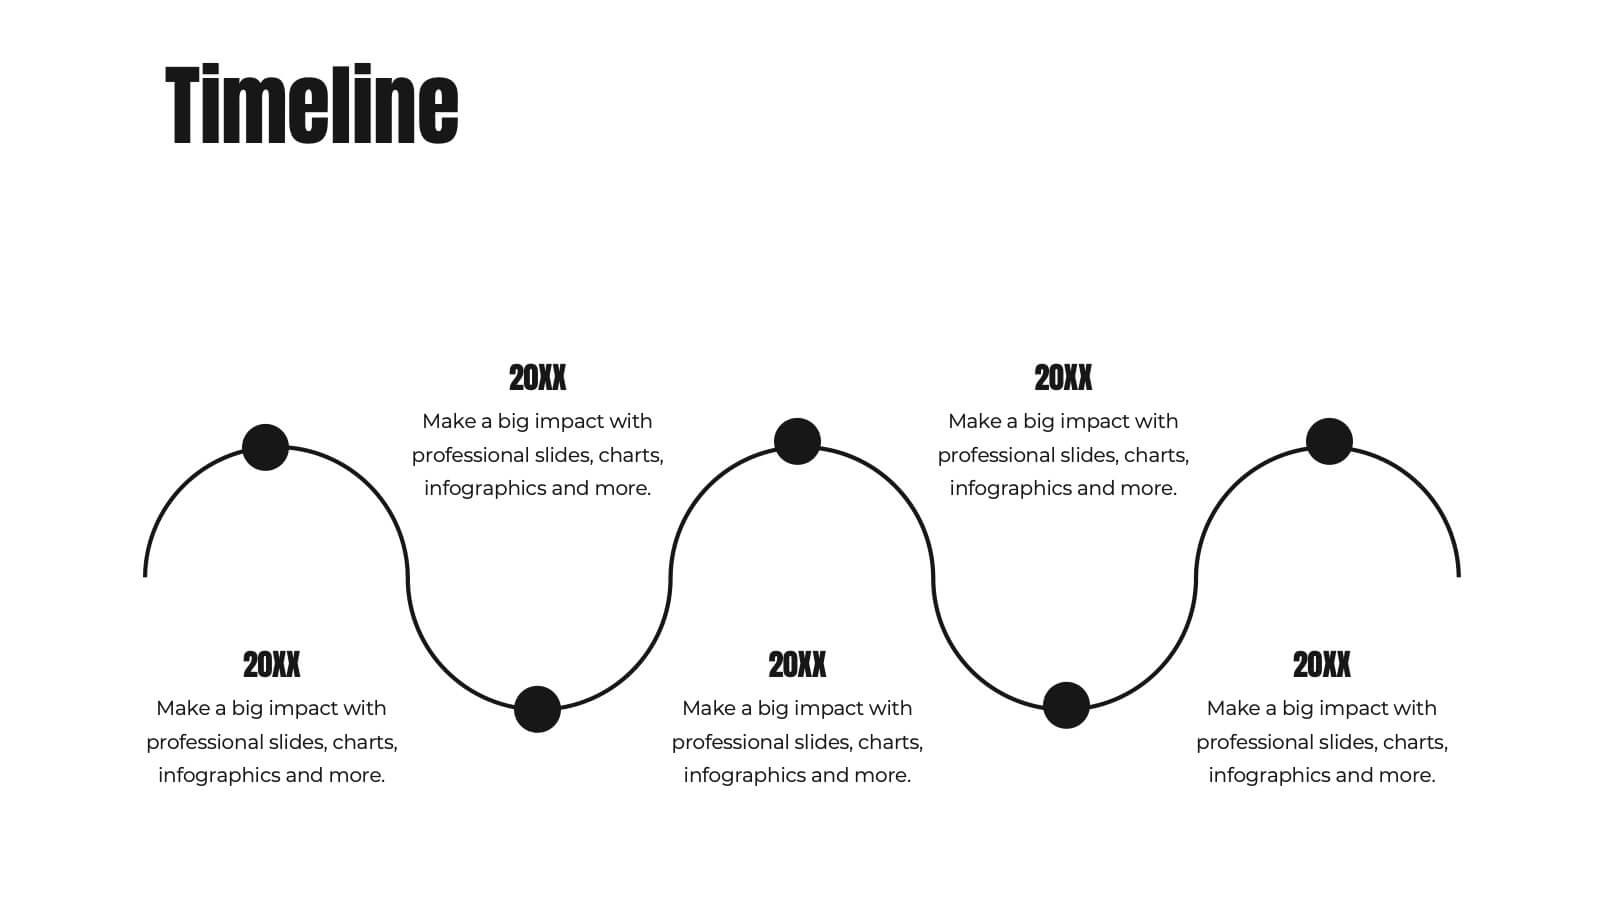
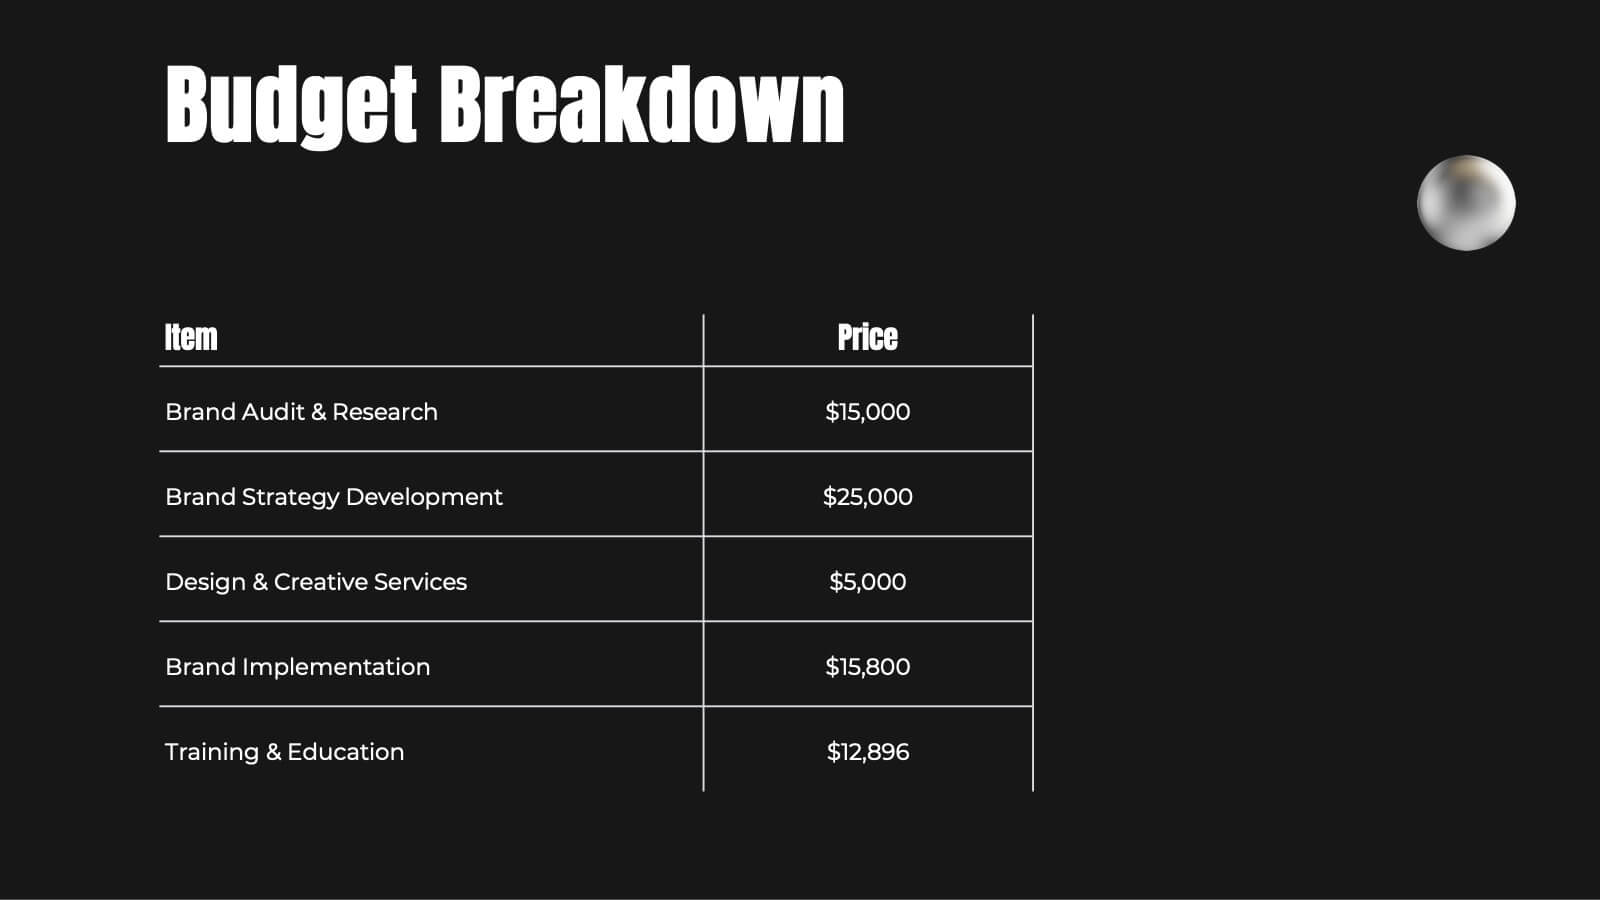
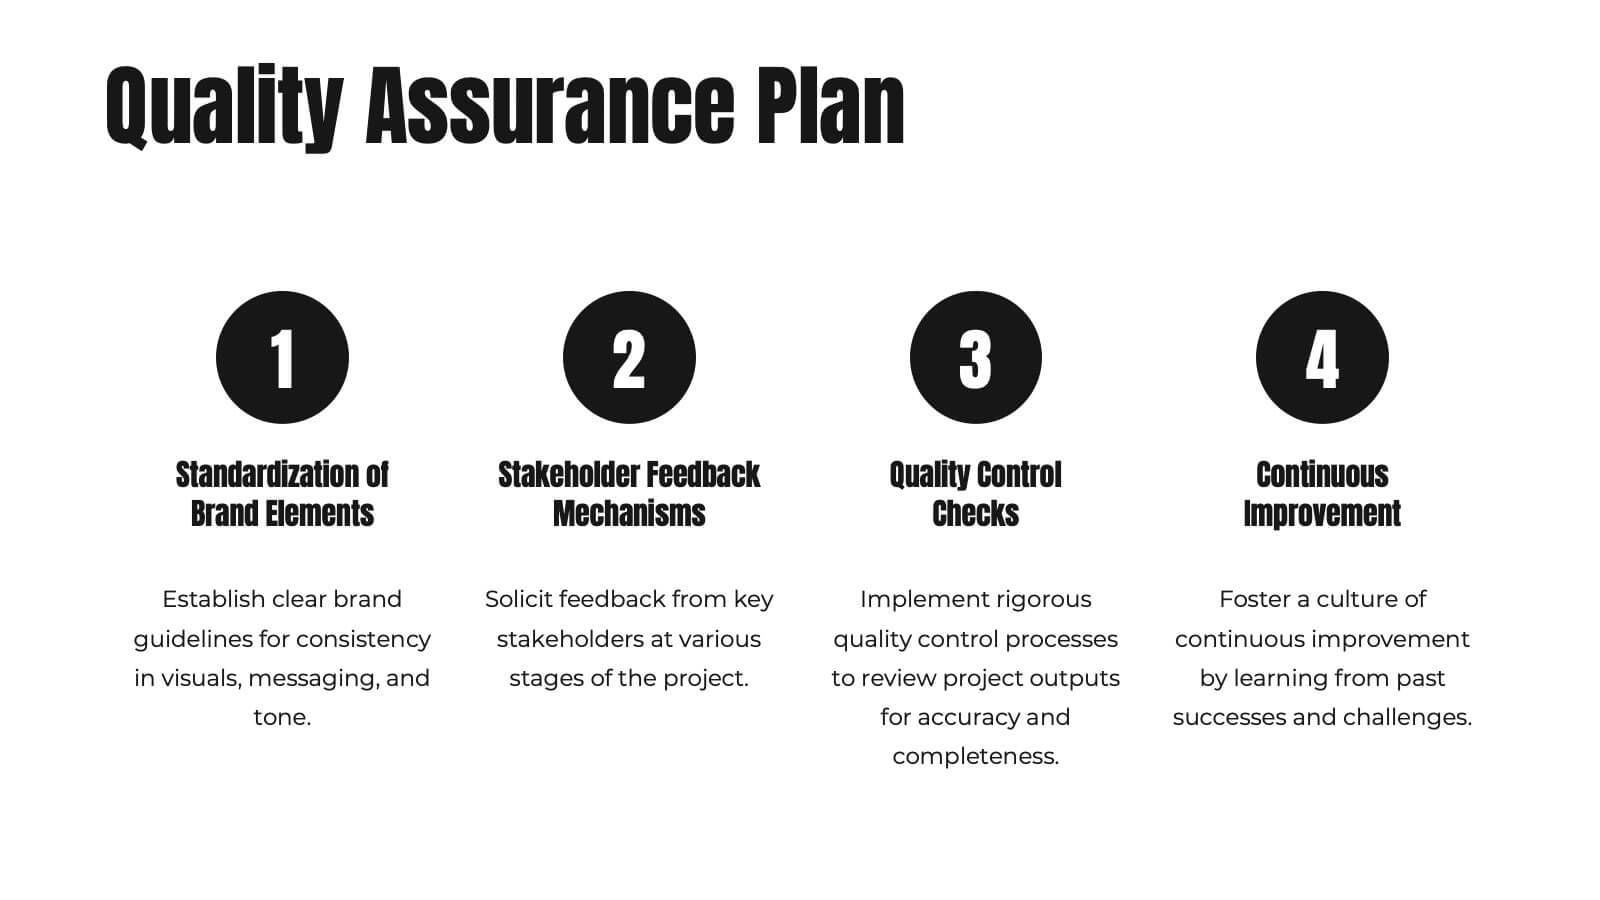
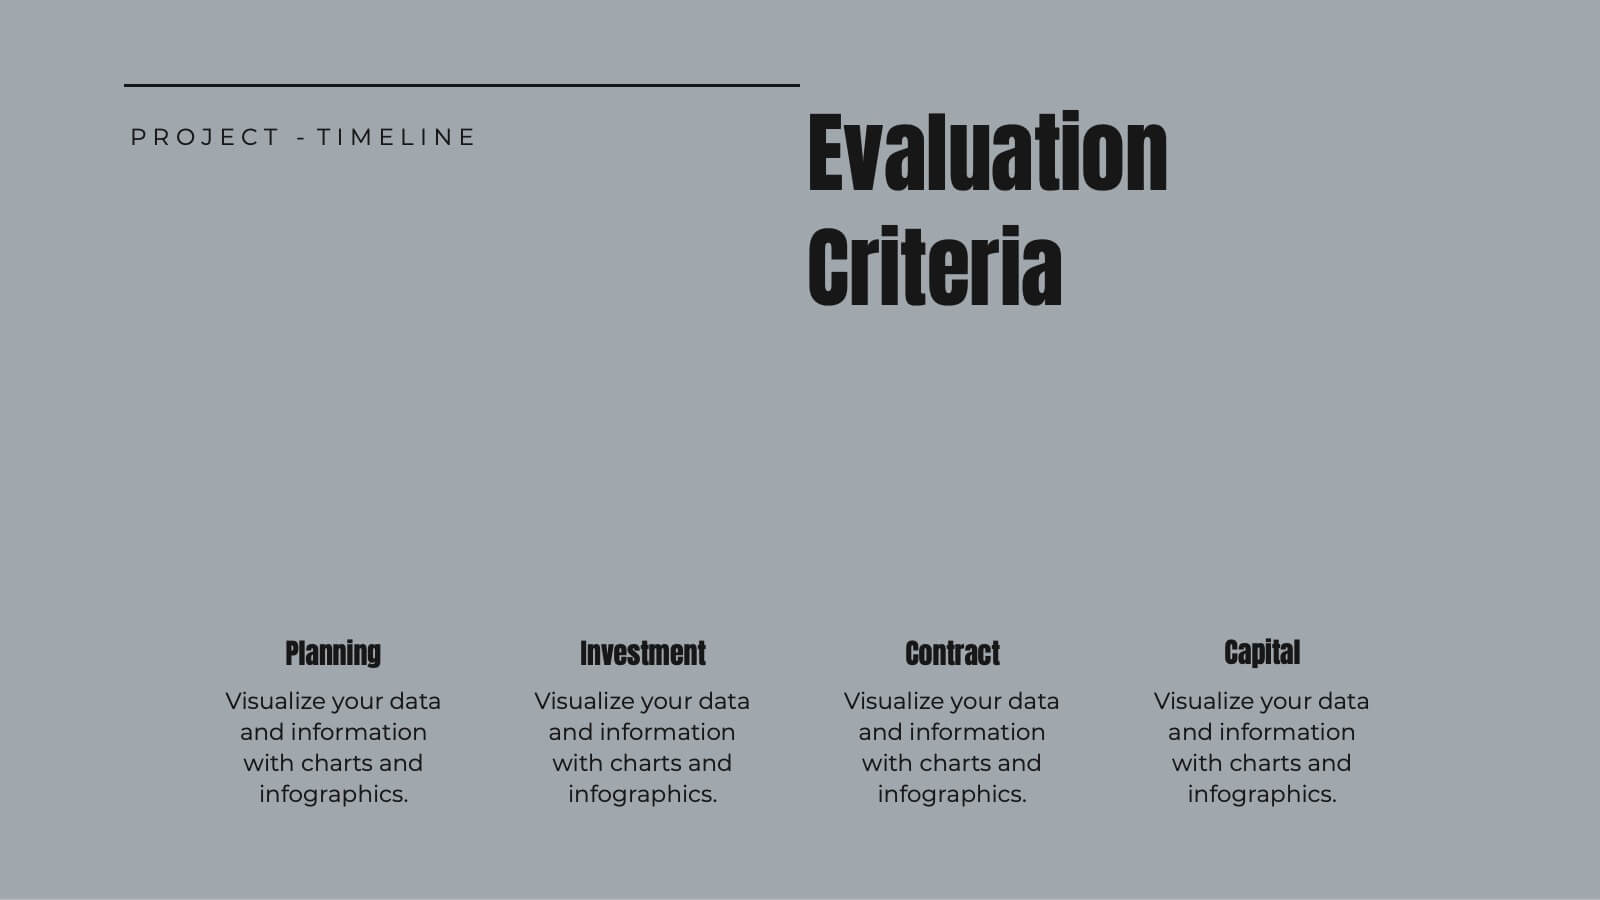
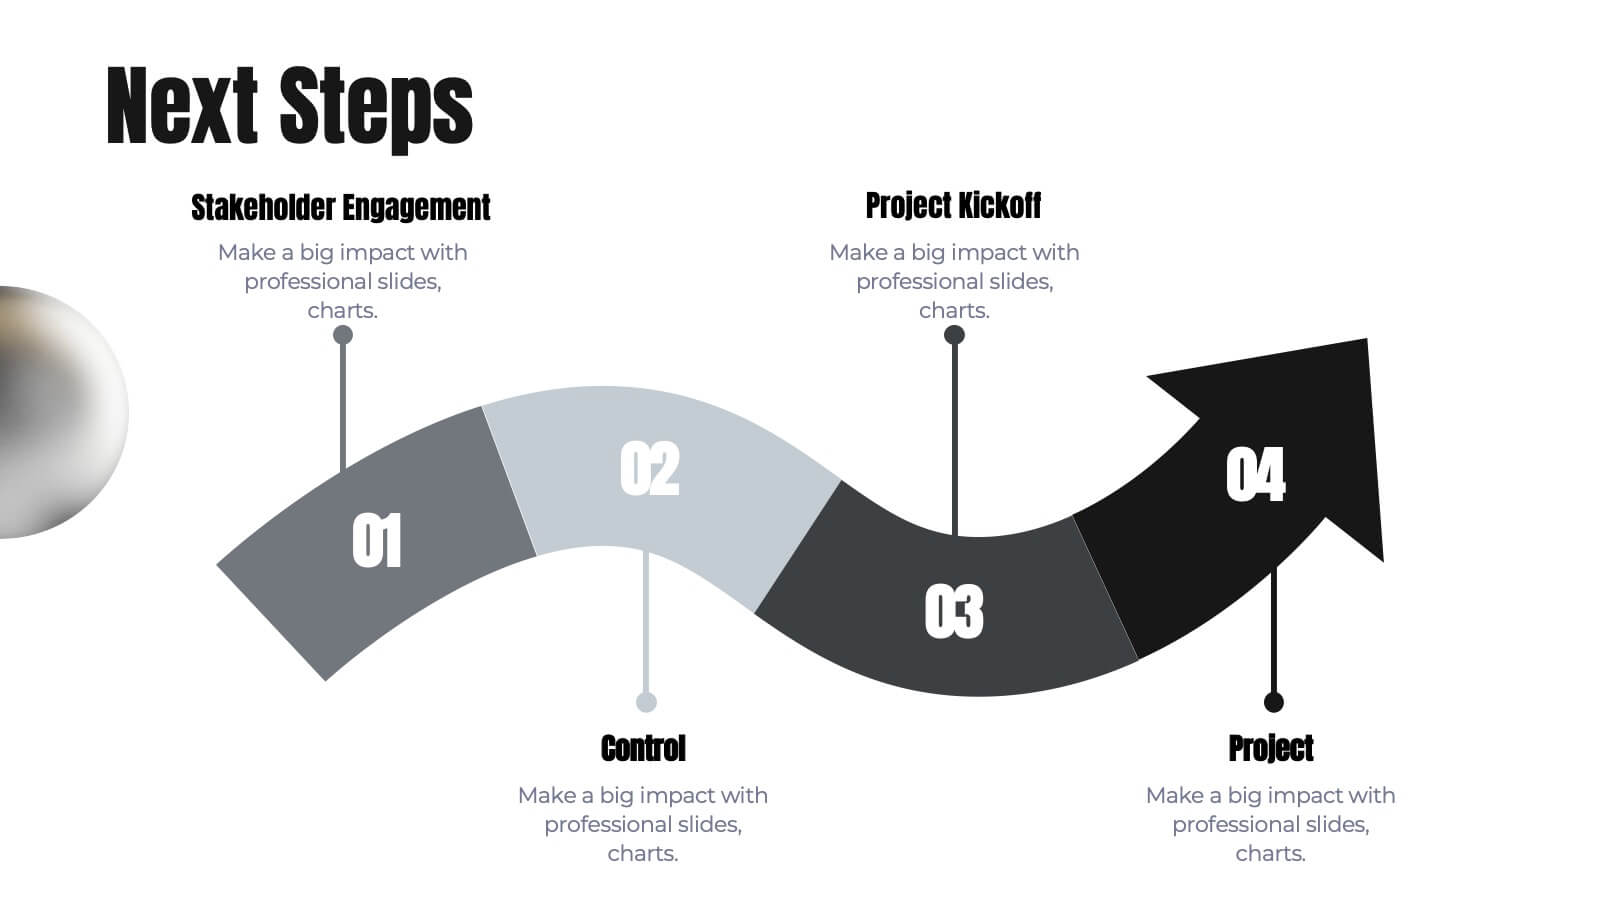
Ignite Rebranding Project Plan Presentation
Ignite your brand with this vibrant project plan template! Perfect for defining brand identity, vision, and strategy. Ideal for marketers and brand managers aiming to create a cohesive and compelling brand presence. Compatible with PowerPoint, Keynote, and Google Slides, this template ensures your branding is impactful and professional. Make your brand unforgettable!


12 slides
5 Steps Timeline Template
Visualize your project's progress with our vibrant "5 Steps Timeline Template." This infographic template guides you through the years 2030 to 2070, with colorful, distinct markers for each milestone. Ideal for long-term planning, each slide offers a clear path forward, ensuring your goals are both visual and attainable. Compatible with PowerPoint, Keynote, and Google Slides, this template is perfect for professionals eager to showcase their strategic vision in a memorable way.


34 slides
Pitch Deck Startup
Introducing our Pitch Deck Startup! Whether you are pitching to investors, partners, or customers, this template will help you create a persuasive presentation that showcases your company, growth plans, and financial projections. Customize the template to suit your needs and deliver a successful pitch that highlights the unique value of your startup and attracts potential investors or customers. This template includes sections for introducing your startup, explaining your business idea and market opportunity, showcasing your products or services, highlighting your financial projections, and outlining your growth plans.


6 slides
E-learning Tools for Modern Classrooms Presentation
Present digital learning strategies with this engaging, education-themed template. Ideal for teachers, trainers, or tech coordinators introducing e-learning tools. Includes labeled sections for highlighting key features and software benefits. Fully customizable and compatible with PowerPoint, Keynote, and Google Slides—perfect for virtual classrooms, workshops, or academic tech presentations.


26 slides
Construction Engineering Dark Presentation
Elevate your project narratives with our construction engineering dark presentation template, tailored specifically for industry professionals who desire clarity and precision. This template, steeped in dark shades complemented by stark orange and green accents, offers a sophisticated canvas for your plans. It's an essential asset for construction engineers and contractors seeking to outline project scopes, or innovative engineering solutions. Compatible with Powerpoint, Keynote, and Google Slides. Included are purposeful graphics and technical icons, all arranged to underscore your presentation's professionalism and comprehensive nature.