


Features
- 6 Unique slides
- Fully editable and easy to edit in Microsoft Powerpoint, Keynote and Google Slides
- 16:9 widescreen layout
- Clean and professional designs
- Export to JPG, PDF or send by email


Do you have any questions?
Recommend


22 slides
Athena Creative Design Report Presentation
Showcase your creative projects with this vibrant design report template! Highlight objectives, concept development, prototypes, and design iterations with sleek visuals. Perfect for designers and creative teams. Compatible with PowerPoint, Keynote, and Google Slides.


7 slides
Dashboard Infographic Presentation Template
A Dashboard Infographic is a visual representation of important data or information that is organized in a way that is easy to understand. This template is perfect for getting your important information across in a way that's easy to comprehend. This template is designed to present your data in a concise and clear way and it can be used to track and monitor different metrics. This dashboard template has the ability to tell a story with a set of graphs and charts that can be customized in several different ways. You can use the graphs and charts and customize them according to your needs.


6 slides
Project Cycle Infographics
The "Project Cycle" infographic template is a meticulously designed resource, ideal for project managers, team leaders, and business analysts. This template facilitates a clear and comprehensive presentation of the various stages involved in a project, from initiation to completion. This template encompasses essential elements of the project cycle, including project initiation, planning, execution, monitoring, and closure. The structured design ensures each phase is distinctly represented, allowing for detailed exploration of timelines, resource allocation, and milestone achievements. This makes it an excellent tool for project planning meetings, stakeholder briefings, and team workshops. The design is professional and methodical, featuring a color scheme that is both engaging and indicative of progression and clarity. This not only enhances the visual appeal of the presentation but also aids in effectively communicating the sequential and cyclical nature of project management. Whether it's used in corporate boardrooms or educational settings, this template guarantees that your project cycle is presented in a detailed, visually compelling, and easily understandable manner.


5 slides
The Problem of Food Waste Infographics
Food Waste refers to any food that is discarded or lost along the food supply chain, from production to consumption. These vertical infographics are designed to cover the problem of food waste and can be designed to highlight statistics and facts about the issue. This infographic can be used to show how much food is wasted annually and the negative impact that this waste has on the environment. In the text boxes provide tips for reducing food waste, such as buying only what you need, storing food properly, and using leftovers creatively. Included are engaging visuals, such as icons and illustrations, and a clear layout.


6 slides
Strategic Blocks in Business Canvas
Visualize and communicate your business model effectively with the Strategic Blocks in Business Canvas Presentation. This slide breaks down all critical segments—Partners, Activities, Resources, Value Propositions, Channels, Revenue Streams, and more—into a clean and colorful layout for strategic planning and stakeholder alignment. Fully editable in PowerPoint, Keynote, and Google Slides.


5 slides
Business Strategy Infographic
A Business Strategy Infographic is a visual representation of a company's plan for achieving its long-term objectives. This infographic template includes charts, graphs, icons, illustrations, and texts that can help people understand and grasp the key points of a business strategy presentation. The colors, fonts, and layout are fully customizable making it easy to stay consistent with your company branding and style guidelines. Use this to provide an overview of your organization's mission, goals, competitive advantage, target market, products or services, and the tactics used to achieve success.


8 slides
Effective Leadership Strategy
Visualize leadership pillars with this bold hexagonal layout designed to showcase four key components of effective leadership. Each colored segment allows you to present core strategies like vision, communication, decision-making, and team empowerment. Perfect for business training, organizational development, or executive briefings. Fully customizable in PowerPoint, Keynote, and Google Slides.


10 slides
Business Data Charts Presentation
Visualize insights with precision using this Business Data Charts Presentation Template. Featuring clean, colorful doughnut charts and clearly labeled segments, it’s ideal for showcasing survey results, KPI breakdowns, or performance metrics. Designed for professionals who want sleek data visuals, and fully customizable in PowerPoint, Keynote, and Google Slides.


5 slides
Step-by-Step Flow Diagram Presentation
Bring clarity to every stage of your process with a clean, easy-to-follow visual path that guides your audience step by step. This presentation helps simplify workflows, instructions, and project milestones in a structured, approachable layout. Fully compatible with PowerPoint, Keynote, and Google Slides.


4 slides
Customer Market Segmentation Analysis Presentation
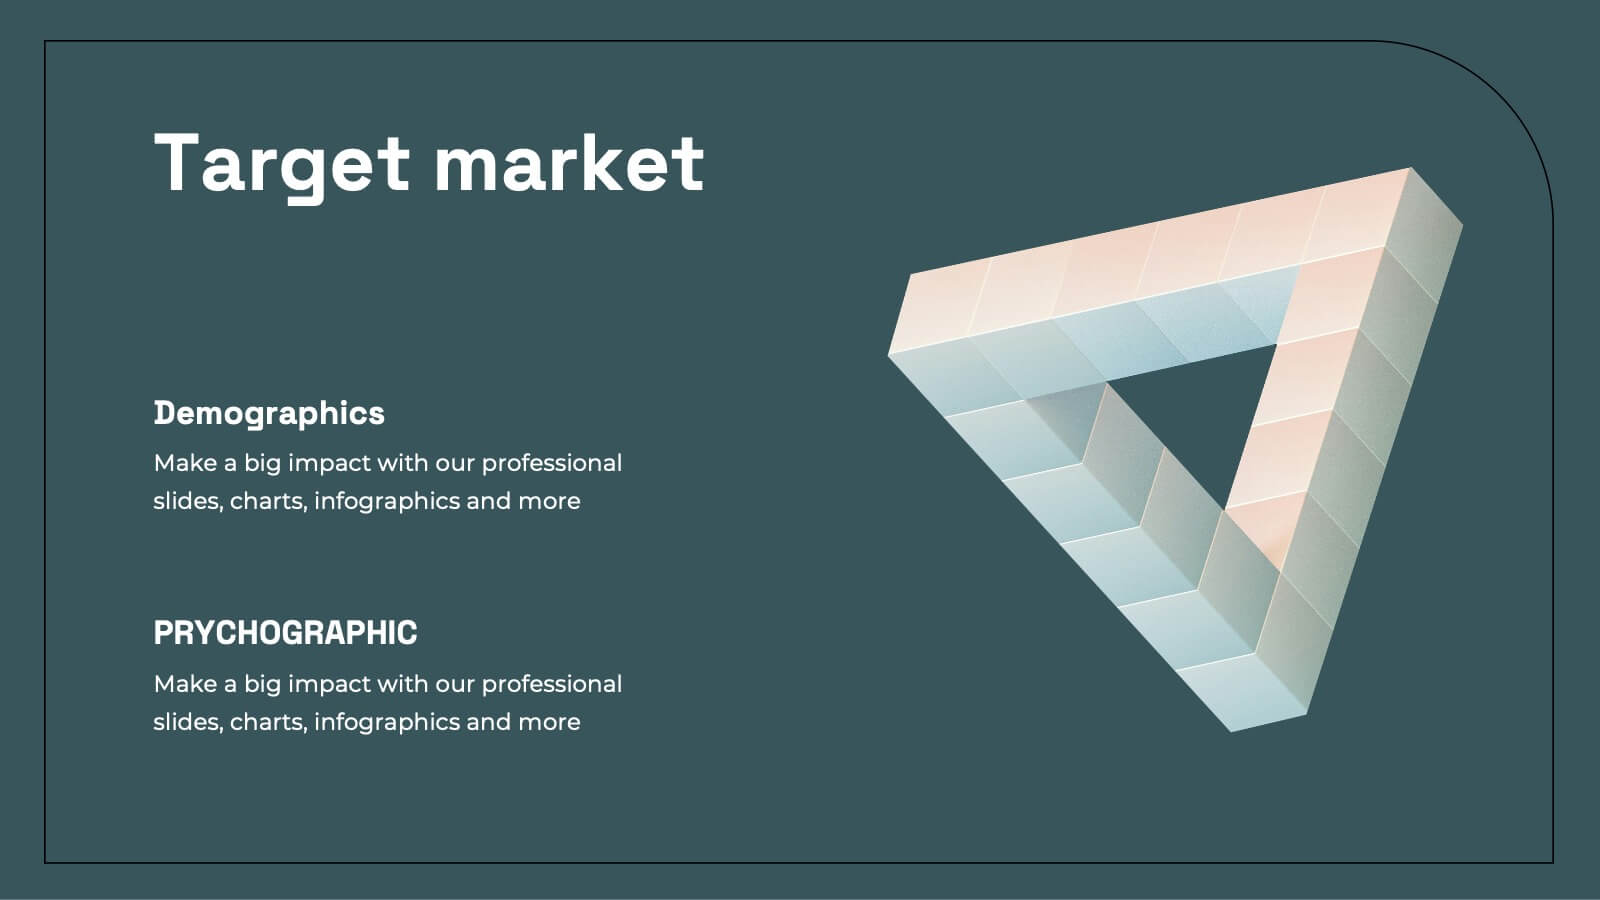
Understand your audience with clear and effective segmentation analysis. This Customer Market Segmentation Analysis template provides a professional visual representation of audience groups, helping businesses target the right demographics. Ideal for marketers, business strategists, and sales teams. Fully editable and compatible with PowerPoint, Keynote, and Google Slides for seamless customization.


6 slides
Oceania Language Map Infographic
Oceania encompasses the entirety of the Pacific Ocean and its islands. Embark on an enlightening journey through the linguistic tapestry of Oceania with our captivating Oceania Language Map Infographic. This template is your guide to understanding the rich array of languages spoken across this diverse and cultural region. Compatible with Powerpoint, Keynote, and Google Slides. This allows you to incorporate a vibrant and culturally symbolic color palette reflecting the diversity of Oceania. Utilize icons representing different languages for a visually appealing representation.


7 slides
Medical Infographic Presentation Template
A Medical Infographic is a visual representation of complex medical information or data, designed to simplify and clarify the information for the reader. The purpose of our medical infographic template is to educate and inform people about various health and medical topics through visual aids such as charts, graphs, diagrams, and illustrations. With this template, you'll have everything you need to create a professional and engaging presentation. The template includes a variety of visual elements that can be used to present data and statistics in an easy-to-understand manner.


4 slides
Business Growth Strategy Presentation
Visualize strategic priorities with this Business Growth Strategy Presentation. Designed as a 2x2 matrix, this slide showcases market and product positioning across four quadrants: present vs. future and market fit vs. innovation. Each section is color-coded and icon-supported, making it easy to highlight initiatives and growth paths. Fully editable in PowerPoint, Keynote, and Google Slides.


20 slides
Fusion Product Roadmap Presentation
Elevate your product roadmap presentations with this sleek and modern template! Perfect for detailing product features, target market, and competitive analysis. Ideal for product managers and teams aiming to align strategy and execution. Compatible with PowerPoint, Keynote, and Google Slides, it’s an essential tool for showcasing your product journey effectively.


4 slides
Hidden Elements Iceberg Strategy Presentation
Reveal what lies beneath the surface with this Hidden Elements Iceberg Strategy presentation. Perfect for exploring visible vs. underlying factors in strategy, risk, or behavior. Visually break down your content using layered iceberg graphics. Fully editable in Canva, PowerPoint, and Google Slides to fit your narrative and branding.


22 slides
Sublimix Business Operations Plan Presentation
Streamline your company’s workflow with this bold and modern business operations plan presentation. Covering key areas like performance metrics, resource allocation, process improvements, and collaboration opportunities, this template helps you optimize efficiency and strategy. Fully customizable and compatible with PowerPoint, Keynote, and Google Slides for a seamless, professional presentation experience.


19 slides
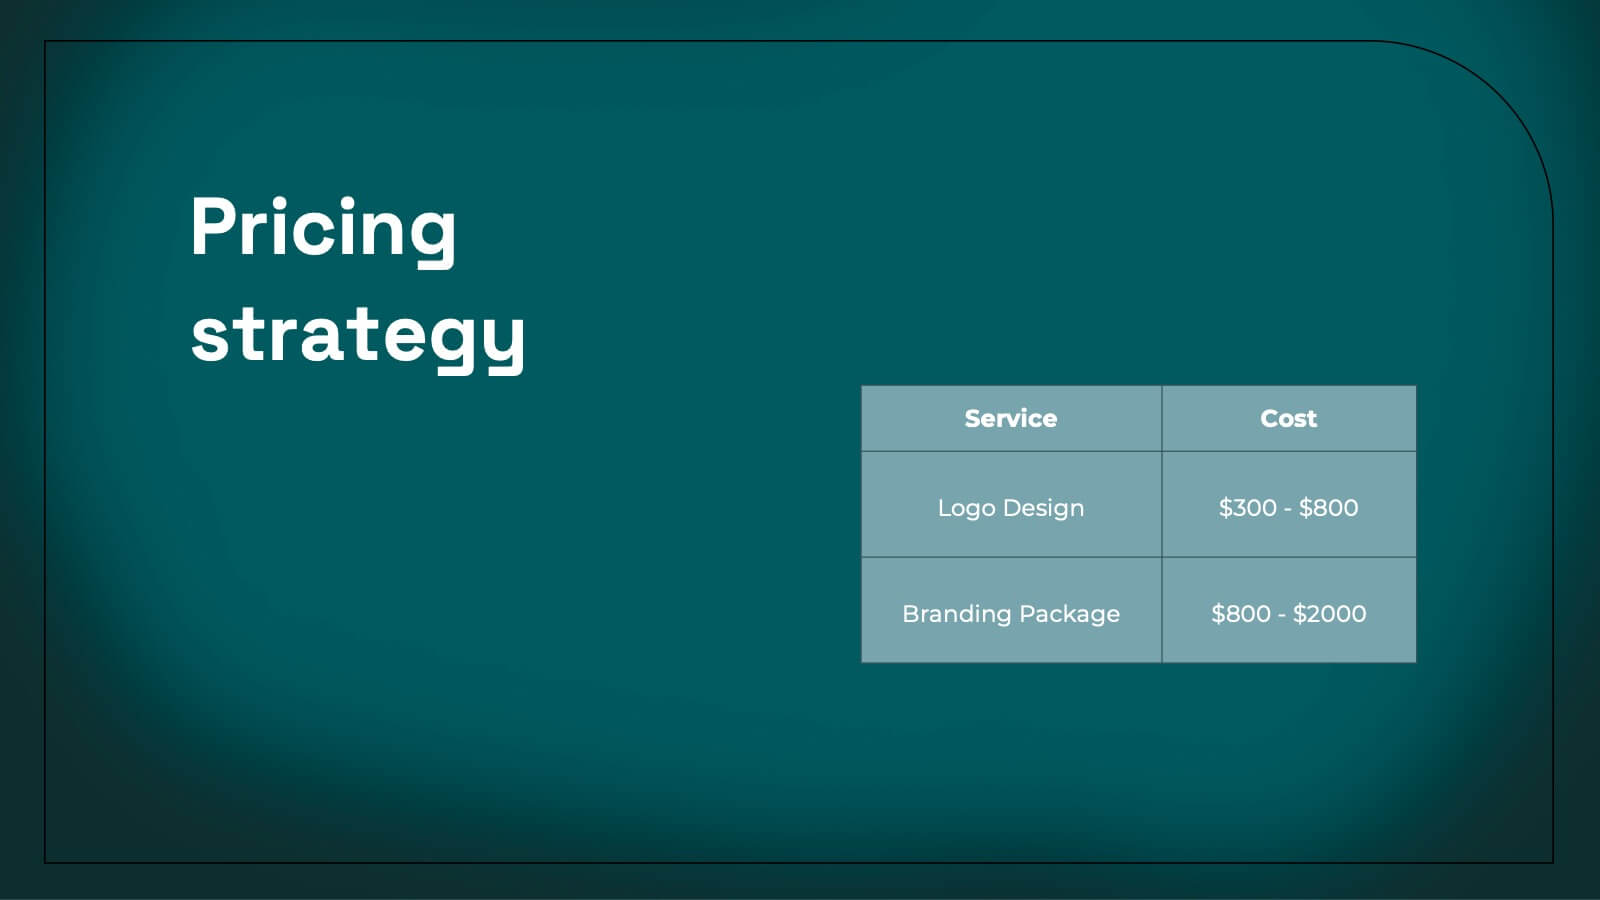
Kale Product Strategy Report Presentation
Unleash the power of your product with this bold and dynamic product strategy report template! Elevate your presentation with eye-catching designs that showcase product features, competitive analysis, and pricing strategies like never before. Captivate your audience from start to finish and leave a lasting impression. Fully compatible with PowerPoint, Keynote, and Google Slides!