


Features
- 8 Unique slides
- Fully editable and easy to edit in Microsoft Powerpoint, Keynote and Google Slides
- 16:9 widescreen layout
- Clean and professional designs
- Export to JPG, PDF or send by email


Do you have any questions?
Recommend


8 slides
Team Roles & Skills Chart Presentation
Bring your team’s strengths to life with this clean, engaging slide designed to highlight individual roles, skill levels, and key capabilities. It helps teams clearly visualize expertise, compare competencies, and communicate responsibilities with ease. Fully editable and compatible with PowerPoint, Keynote, and Google Slides.


26 slides
Dante Presentation Template
Featuring our new Dante Sportswear template this is a great way to present your products and ideas in an attractive, easy-to-read and easily understanding presentation. It includes all the elements you need to create a marketing presentation with style that will stand out. This template has plenty of space for displaying statistics and other data with images that complement your product/service information. You can use this template for valuable sportswear content or information to educate or entertain your audience. This template is fully and easily editable in powerpoint as well!


21 slides
Vulcan New Product Proposal Presentation
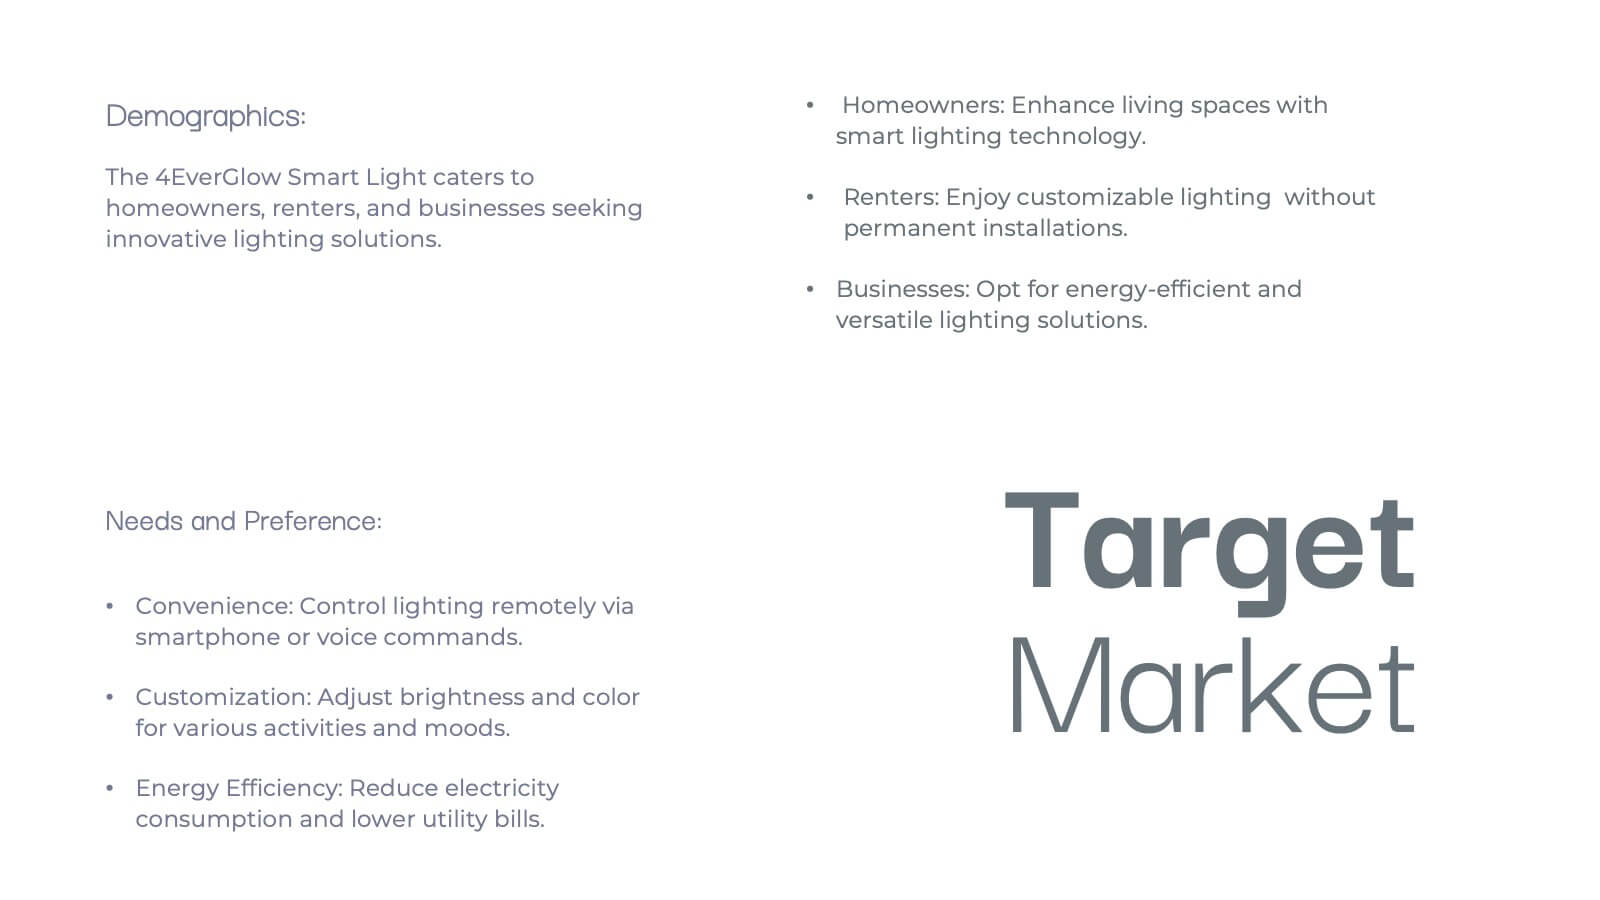
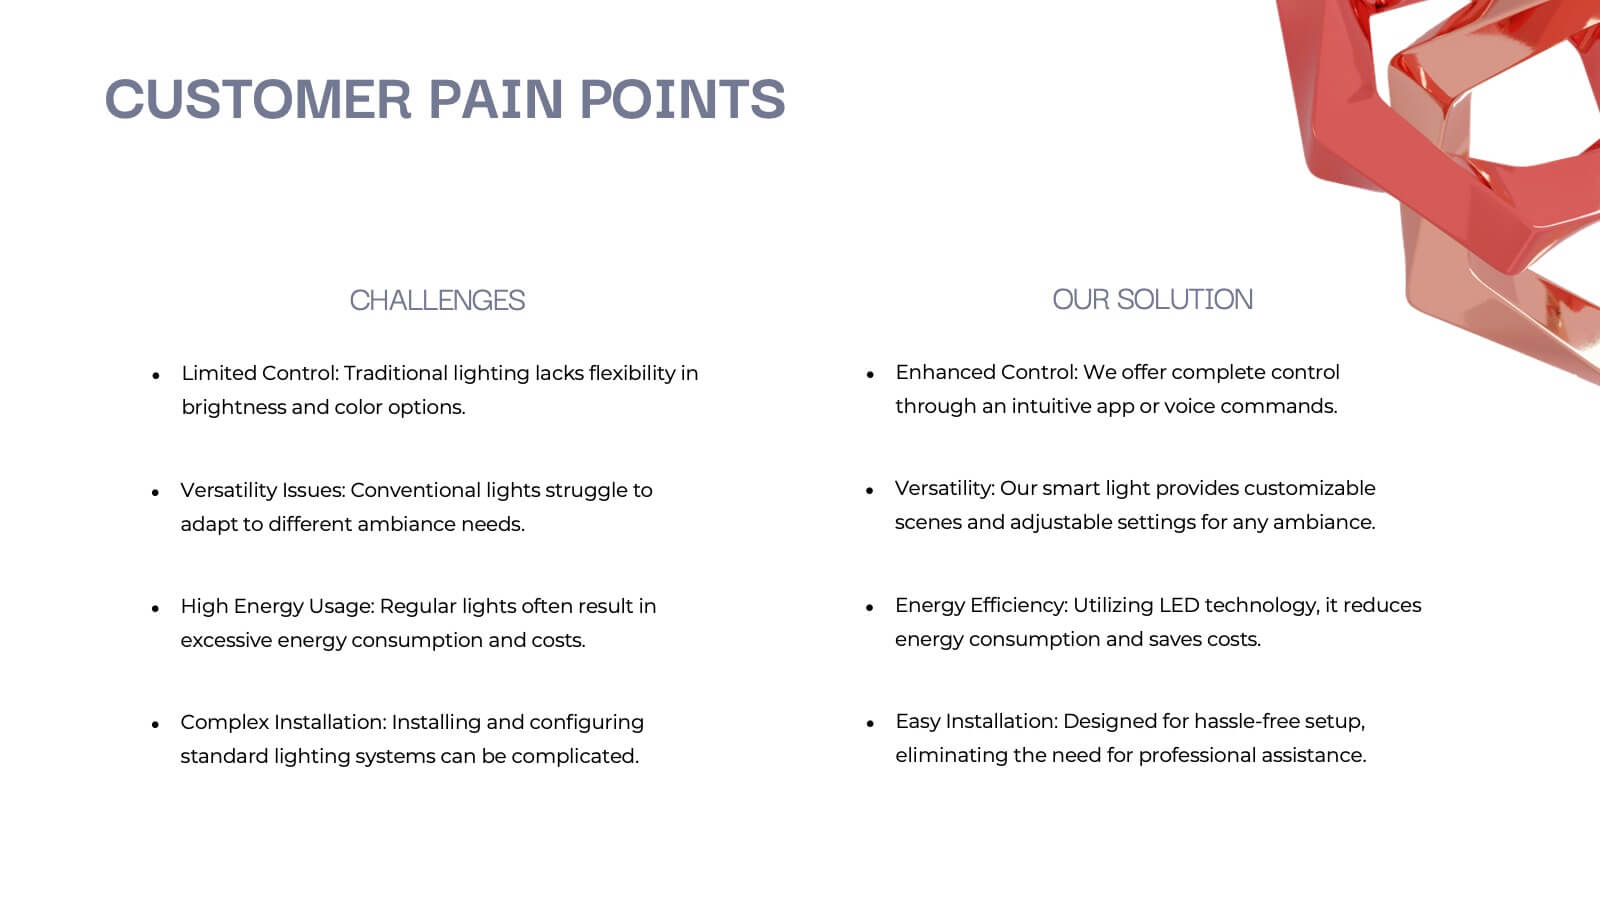
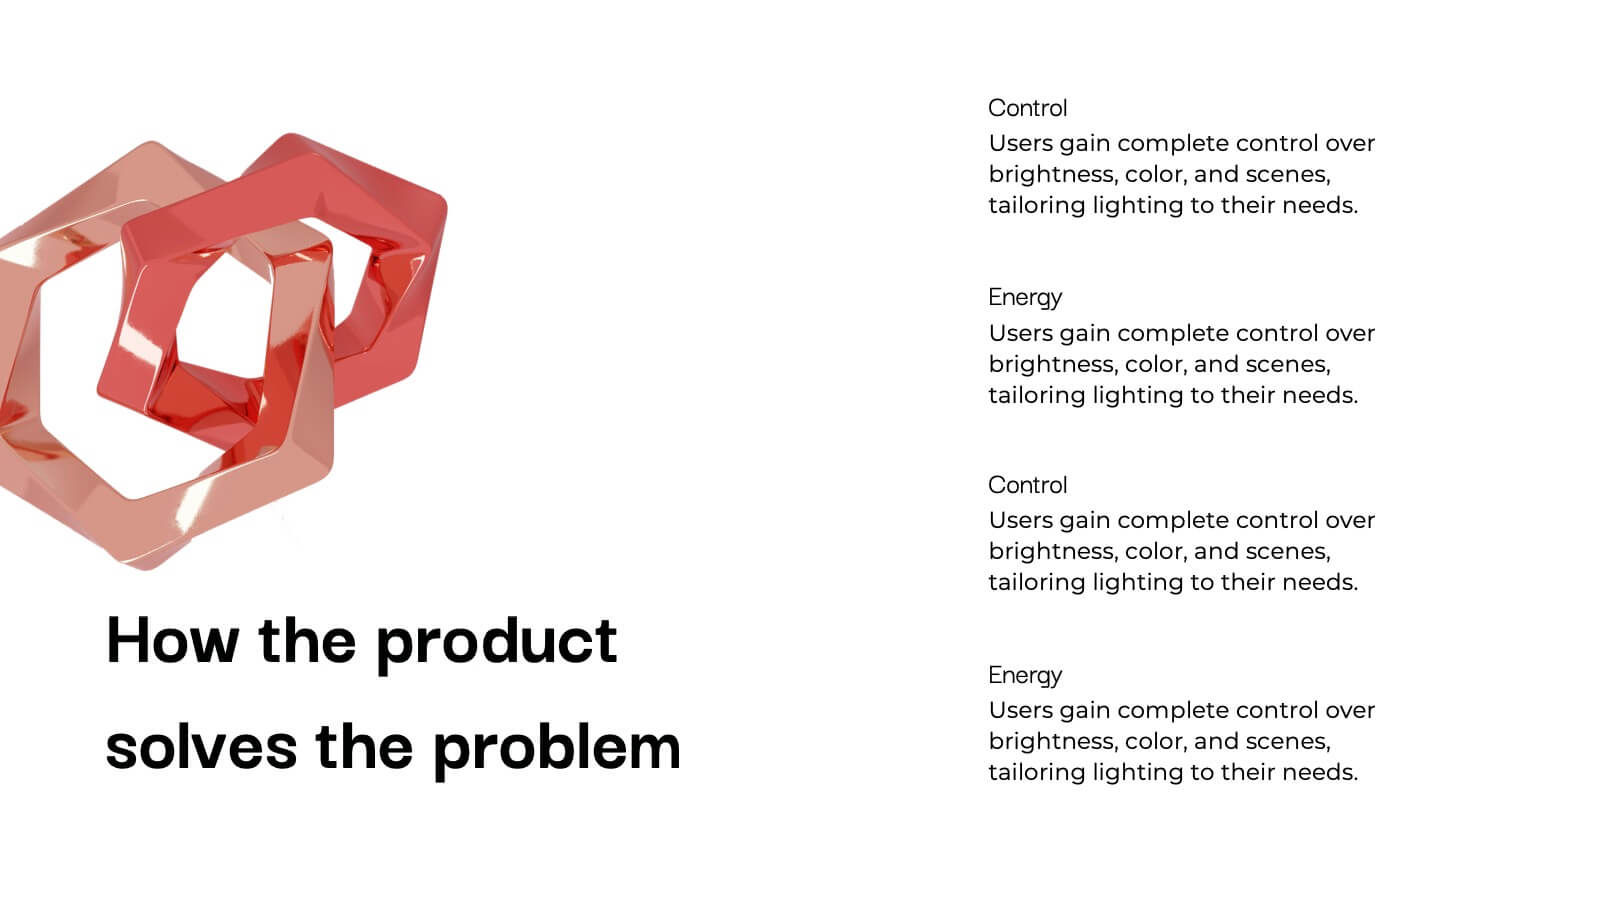
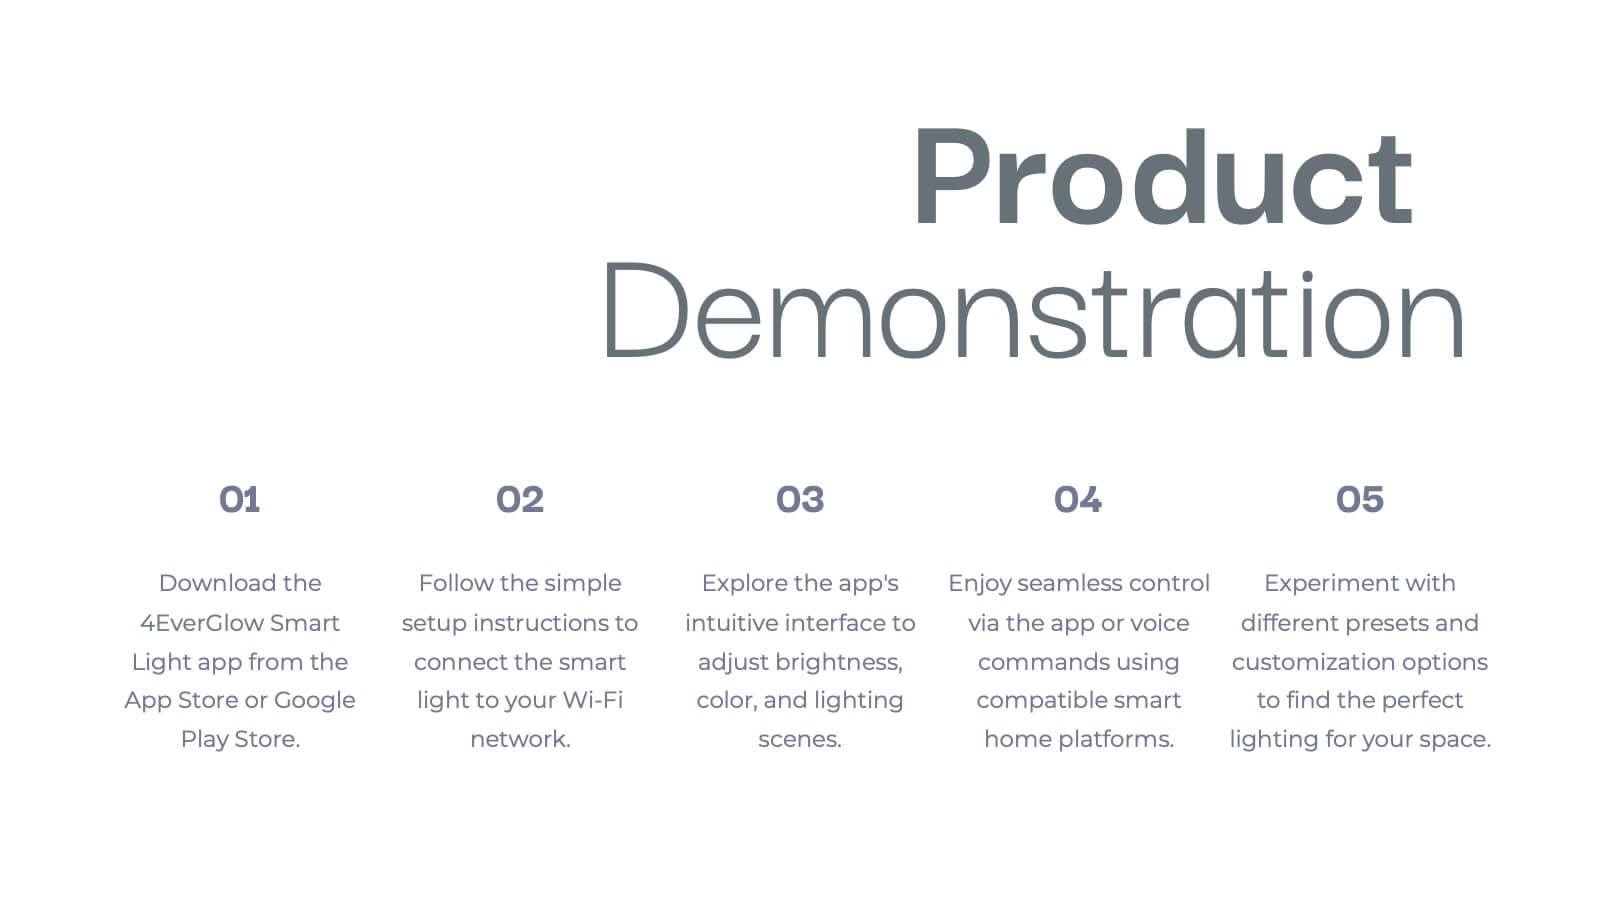
Launch your next product with confidence using this comprehensive presentation template! Covering everything from product features and target market to pricing strategy and customer pain points, this template ensures a smooth and engaging flow for your audience. It’s ideal for product proposals, demonstrations, and marketing strategies. Compatible with PowerPoint, Keynote, and Google Slides for seamless presentations.


8 slides
Business Framework Strategy
Simplify your strategy breakdown with this layered, step-by-step infographic. Ideal for presenting three core pillars or stages of a business model, this layout highlights each section with a bold letter identifier (A, B, C), vivid icons, and space for supporting content. Fully editable in PowerPoint, Keynote, and Google Slides.


22 slides
Sky Drop Full-Service Agency Project Plan Presentation
Step into the world of strategic creativity with the Sky Drop Agency Project Plan template! Designed for modern agencies looking to impress clients and stakeholders, this template offers a sleek and professional design that highlights your agency's strengths, processes, and successes. With dedicated sections for mission and vision, team introduction, services, and client testimonials, this template provides a comprehensive overview of your agency's capabilities. It's perfect for showcasing case studies, market analysis, and future outlooks, helping you to build trust and establish credibility. Whether you're presenting a new project plan or updating clients on progress, this template ensures your information is communicated clearly and effectively. Fully customizable and compatible with PowerPoint, Keynote, and Google Slides, the Sky Drop template is your go-to for creating presentations that leave a lasting impact. Impress your audience and elevate your agency's brand with this powerful presentation tool!


5 slides
Poaching Effects Infographics
Navigate the critical issue of wildlife endangerment with our poaching effects infographics. Crafted in earthy tones of brown and tan, this informative and creatively styled vertical template sheds light on the harsh realities of illegal wildlife hunting. Whether you're an environmental activist, an educator, or part of an ecological research team, this infographic is structured to resonate with your audience, offering compelling visuals and thematic icons that starkly represent the consequences of poaching. It's more than a presentation; it's a call to global action, crucial for anyone advocating for wildlife preservation and aiming to inspire change through storytelling.


7 slides
Finance Dashboard Infographic
A finance dashboard is a visual representation of financial data and key performance indicators (KPIs) that provides an overview of an organization's financial health and performance. This infographic template is a tool that allows users to monitor and analyze financial data in a clear and concise manner. This offers a comprehensive overview of financial performance, budgeting, and forecasting for individuals or businesses. The template features a clean and modern design with a professional color scheme, easy-to-read fonts, and intuitive layout. The visuals are thoughtfully organized to convey financial information effectively and engage the audience.


7 slides
Operational Risk Management Infographic
Dive into the methodical domain of risk management with our sleek risk management infographic. Cloaked in varying blue tones, our template embodies the serenity and stability that effective risk management brings to operations. Enhanced with precise infographics, clear icons, and relevant image placeholders, it transforms complex risk analysis into easily comprehensible visual insights. Flawlessly crafted for Powerpoint, Keynote, or Google Slides. A pivotal tool for business strategists, operations managers, financial analysts, or any organization aiming to fortify its operational resilience. Strategize with clarity; let every slide be a shield against potential pitfalls.


6 slides
Tree Diagrams Stats Infographics
Our Tree Diagram Stats infographic is a highly effective tool for Powerpoint, Keynote, and Google Slides presentations, designed to aid educators, data analysts, and project managers. This infographic is structured to visually represent hierarchical information, statistical data, and decision trees in a clear and logical format. The Tree Diagram Stats infographic is ideal for illustrating the breakdown of components in a system, the steps in a process, or the choices available in a decision-making scenario. Its organized design helps viewers trace the paths from a single starting point down through multiple branches, displaying the relationship between different levels of information. Using this infographic in your slides will greatly enhance the audience's understanding of complex data sets and decision-making processes. Whether you're detailing organizational structures, process flows, or probability outcomes, this infographic provides a professional and easy-to-understand approach to presenting detailed information. It's an essential addition to any presentation requiring a clear visual mapping of data or processes.


6 slides
Modern Agriculture Industry Trends
Highlight key data and insights with this visually engaging agriculture-themed slide. Designed with circular data visuals and crop illustrations, it's perfect for showcasing percentages, trends, or growth stats in modern farming, agri-tech, and sustainability initiatives. Fully editable in PowerPoint, Keynote, and Google Slides.


22 slides
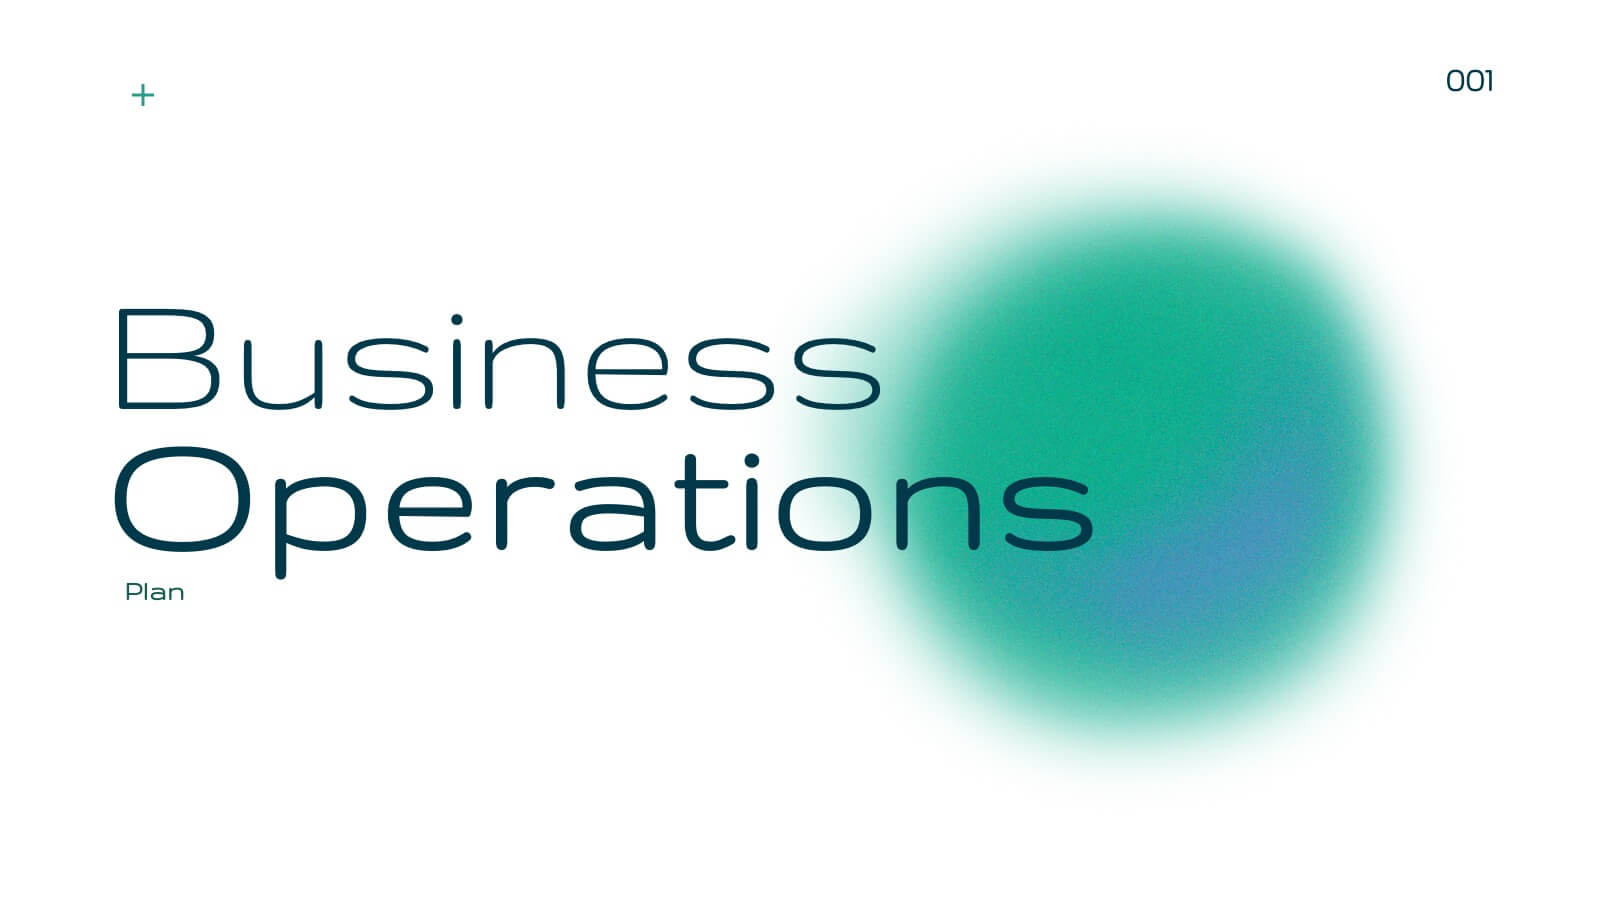
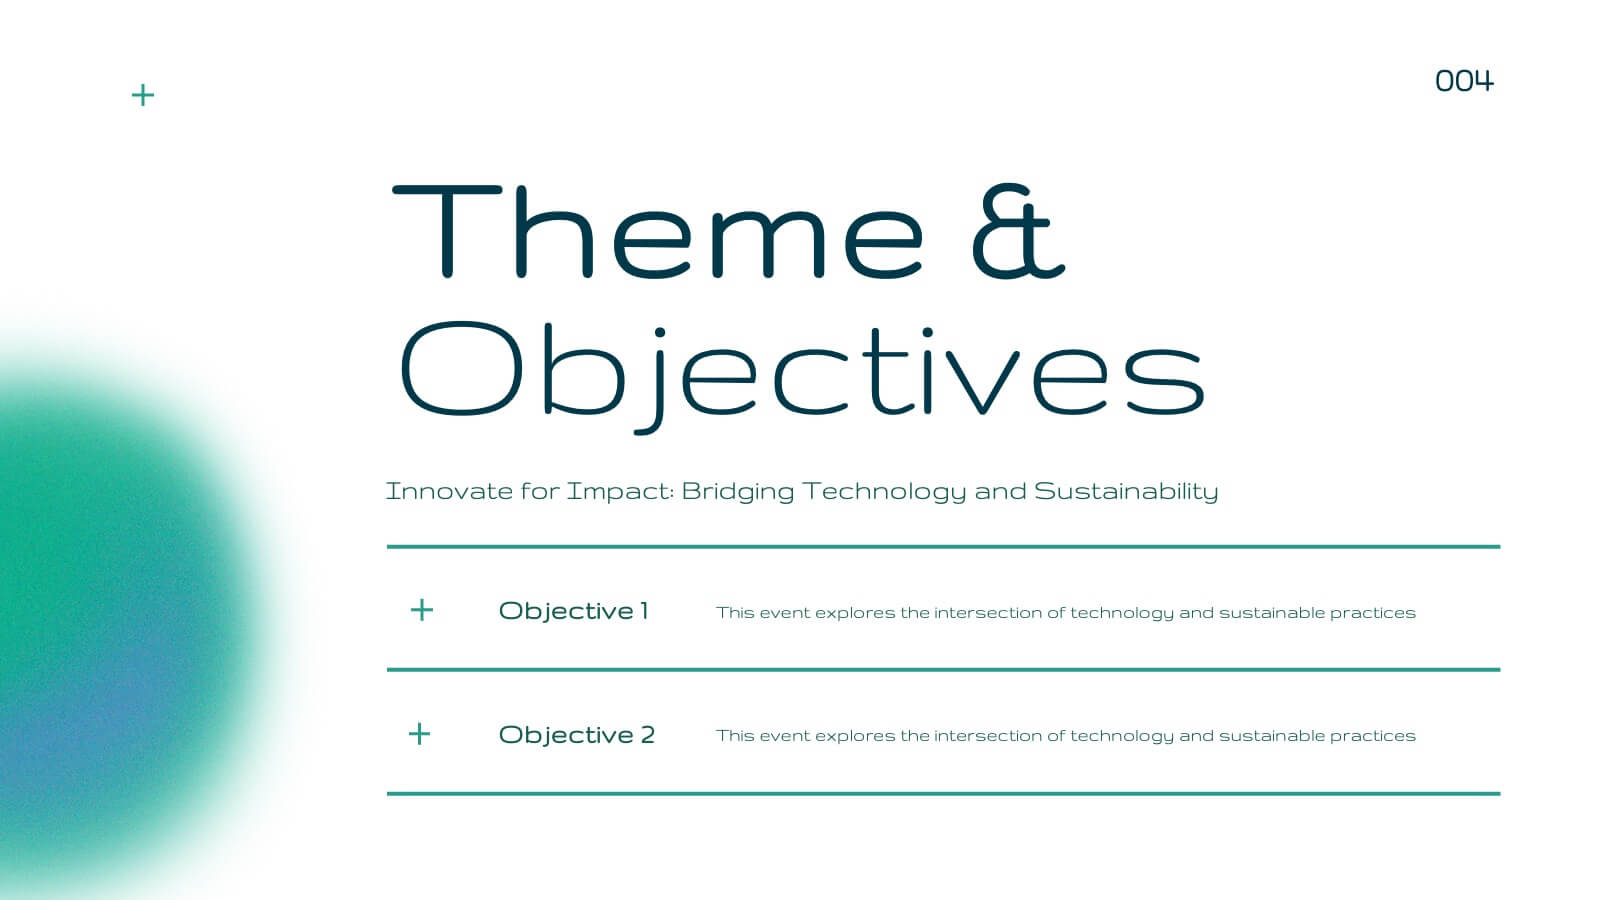
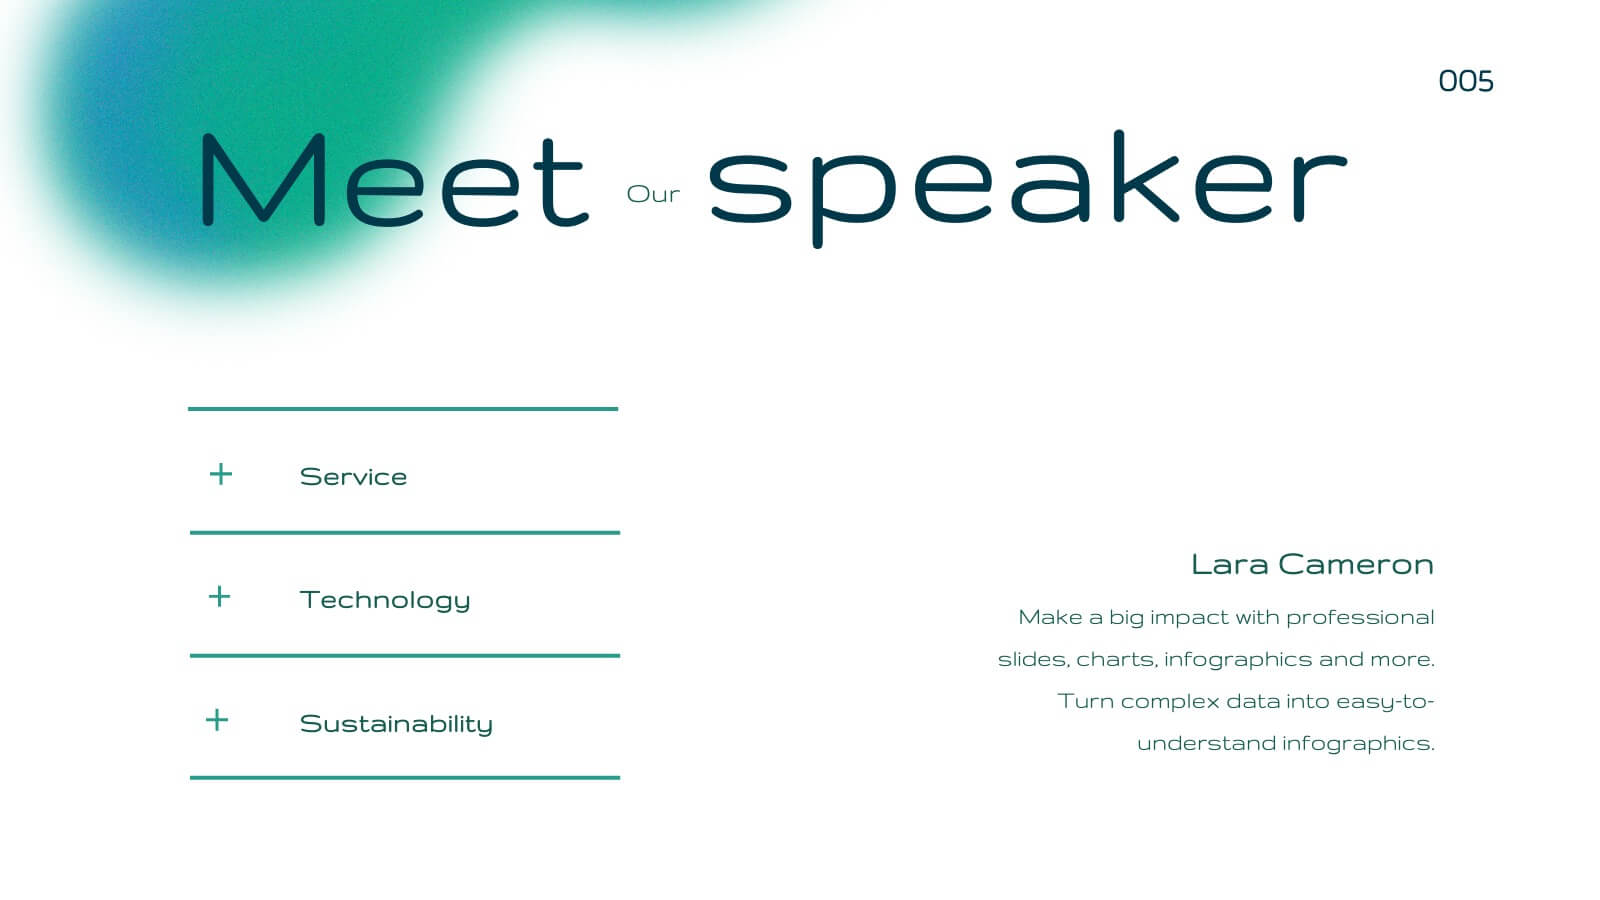
Blaze Business Operations Plan Presentation
Elevate your business presentations with this elegant, modern template designed for comprehensive business operations. Perfect for covering themes, objectives, workshops, and panel discussions, it ensures a professional and engaging delivery. The clean design and structured layout enhance clarity and impact. Compatible with PowerPoint, Keynote, and Google Slides, it’s versatile for any platform.


7 slides
3D Modeling Infographic
3D modeling is the process of creating three-dimensional representations of objects or scenes using specialized computer software. This infographic template is crafted to demystify the world of 3D modeling, providing a comprehensive understanding of the techniques, applications, and the creative process that brings ideas to life in the third dimension. Compatible with Powerpoint, Keynote, and Google Slides. This infographic is an invitation to the captivating universe of 3D artistry and innovation. Use this template to step into the realm where imagination meets the third dimension.


21 slides
Zephyrkin Product Roadmap Presentation
Outline your product’s journey with this roadmap template, covering essential elements like target market, customer pain points, competitive analysis, and marketing strategy. Showcase your product's features, unique value proposition, and development process. Ideal for PowerPoint, Keynote, and Google Slides, this template supports professional product presentations.


5 slides
Performance Metrics and KPI Review Presentation
Visualize performance at a glance with the Performance Metrics and KPI Review presentation template. Featuring sleek gauge charts in various color schemes, this layout makes it easy to display progress, thresholds, and KPIs across categories. Customize each dial and label to reflect your own business metrics. Compatible with PowerPoint, Keynote, and Google Slides.


6 slides
Eco-Friendly Operations and Compliance
Promote sustainable practices with the Eco-Friendly Operations and Compliance Presentation. This sleek, leaf-themed diagram is perfect for showcasing environmentally responsible workflows, green policies, or ESG initiatives. Designed to visually align with eco-branding, it's easy to customize in PowerPoint, Keynote, or Google Slides. Ideal for internal teams or client presentations.


7 slides
Agenda and Sections TOC Presentation
Bring your audience in with a dynamic, story-driven overview that makes each section feel intentional and easy to follow. This presentation highlights key agenda points in a clean, structured layout, helping you introduce topics with clarity and flow. Fully compatible with PowerPoint, Keynote, and Google Slides.


8 slides
Root Cause Visual via Ishikawa Method
Clarify root causes and drive actionable solutions with the Root Cause Visual via Ishikawa Method Presentation. This fishbone-style infographic layout uses six categorized nodes mapped directly to a streamlined fish silhouette, ideal for visualizing complex problems. Easily editable in PowerPoint, Keynote, and Google Slides.