


Features
- 5 Unique slides
- Fully editable and easy to edit in Microsoft Powerpoint, Keynote and Google Slides
- 16:9 widescreen layout
- Clean and professional designs
- Export to JPG, PDF or send by email


Do you have any questions?
Recommend


20 slides
Kirin Artist Portfolio Template Presentation
Showcase your creative work with style and flair using this sleek portfolio presentation! It covers key sections like featured projects, creative process, collaborations, and client testimonials, ensuring your expertise is communicated effectively. Ideal for freelancers, designers, or agencies, this template is fully compatible with PowerPoint, Keynote, and Google Slides.


5 slides
Water Industry Infographics
The Water Industry encompasses the management, treatment, distribution, and conservation of water resources. It plays a vital role in ensuring access to clean and safe water for various purposes. These infographic templates can serve as an effective educational tool for organizations, educational institutions, and environmental groups. This aims to inspire individuals and communities to make a positive impact by adopting sustainable water practices and contributing to the preservation of this vital resource. They are designed to inform about the importance of water conservation, sustainability, and efficient water management.


8 slides
2x2 Matrix Chart Presentation
Bring clarity to complex decisions with this clean, visually engaging layout designed for comparing four key factors at a glance. This presentation makes it easy to highlight priorities, map insights, and explain strategic choices with confidence. Fully customizable and compatible with PowerPoint, Keynote, and Google Slides.


7 slides
Gap Analysis Process Infographic Presentation
A Gap Analysis is a process that helps identify the differences or gaps between where an organization or individual is currently and where they want to be in the future. This Template is a fun way to provide visual data and make your presentation more engaging. This template is designed for strategic planning, you can make a compelling case to your project teams. This template includes helpful illustrations and allows you to add tips compatible with Powerpoint, keynote and google slides. Guide your audience through the results with ease and impress them with cultivating infographics.


21 slides
Flamelore Agile Project Plan Presentation
Organize and deliver your Agile Project Plan seamlessly with this dynamic presentation template. Designed to align with Agile principles, it features a comprehensive structure covering objectives, scope of work, and key deliverables. The template helps you outline a detailed project timeline and budget breakdown to keep stakeholders informed. Illustrate complex information with visual aids such as pyramids, charts, and process diagrams, making data interpretation effortless. Highlight team members, their roles, and responsibilities to foster transparency and accountability. With slides dedicated to risk assessment and evaluation criteria, you can confidently navigate potential challenges. This fully editable template works across PowerPoint, Google Slides, and Keynote, providing flexibility and a polished design for project managers, teams, and business professionals. Whether you're pitching to stakeholders or aligning your team, this Agile framework ensures clear communication and actionable steps.


6 slides
Porter's Five Forces Management Infographic
Porter's Five Forces is a framework, that helps businesses understand the attractiveness and profitability of an industry by examining five key forces that shape its competitive landscape. These infographic templates provide a visually appealing and concise overview of Porter's Five Forces framework. They are designed to help businesses and professionals analyze the competitive dynamics of an industry and make informed strategic decisions. By using this to help your audience understand the forces that shape industry competitiveness, they can identify potential threats and opportunities to make informed decisions, and gain a competitive edge.


7 slides
Governance Structure Infographic
Governance structure refers to the framework, system, and processes that define how an organization's operations, strategies, and objectives are directed, controlled, and regulated. This infographic template serves as a clear roadmap, guiding you through the key pillars that establish a strong foundation for successful governance. Compatible with Powerpoint, keynote, and Google Slides. The checkpoints illustrate the importance of compliance and effective risk management at various stages of your governance journey. This illuminating template empowers you to communicate the principles that steer an organization toward its objectives.


6 slides
Startup Goals and MVP Rollout Plan Presentation
Launch with clarity using the Startup Goals and MVP Rollout Plan Presentation. This dynamic circular layout features a rocket icon and segmented design to represent phased growth and product milestones. Ideal for showcasing early-stage priorities, MVP deliverables, and go-to-market strategies. Compatible with PowerPoint, Keynote, Google Slides, and Canva for full customization.


28 slides
Ignite Rebranding Project Plan Presentation
Ignite your brand with this vibrant project plan template! Perfect for defining brand identity, vision, and strategy. Ideal for marketers and brand managers aiming to create a cohesive and compelling brand presence. Compatible with PowerPoint, Keynote, and Google Slides, this template ensures your branding is impactful and professional. Make your brand unforgettable!


21 slides
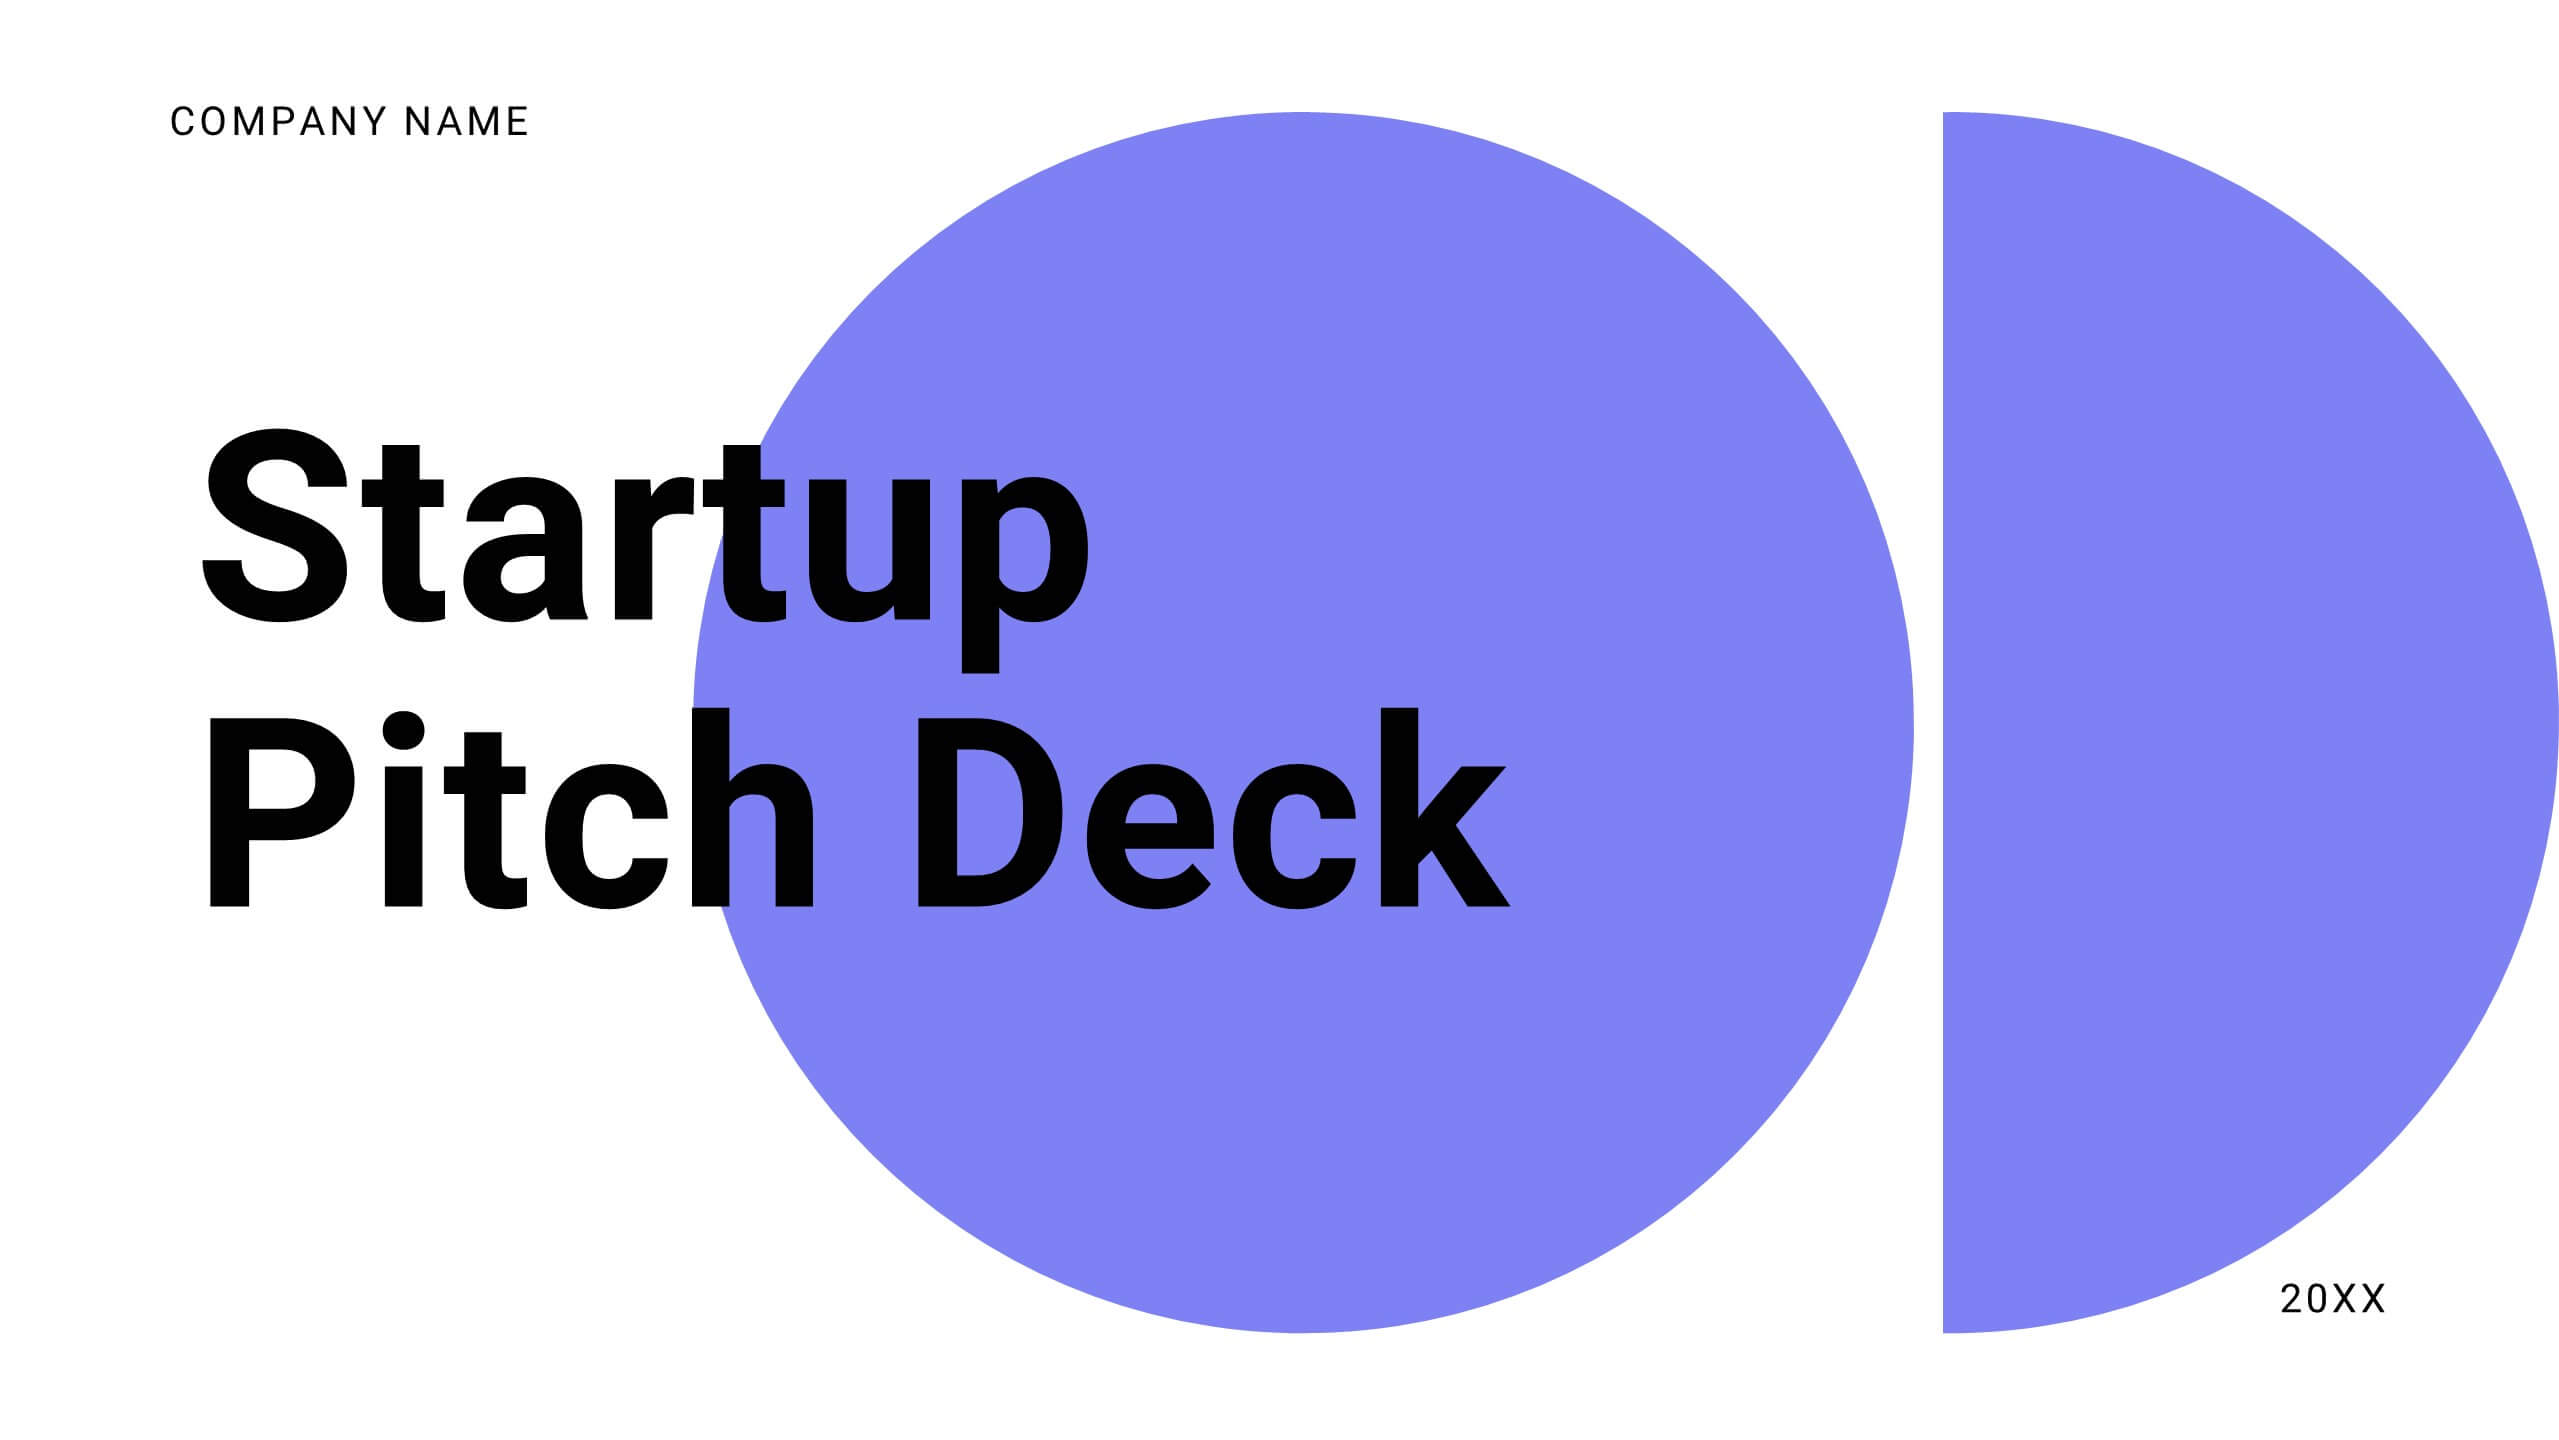
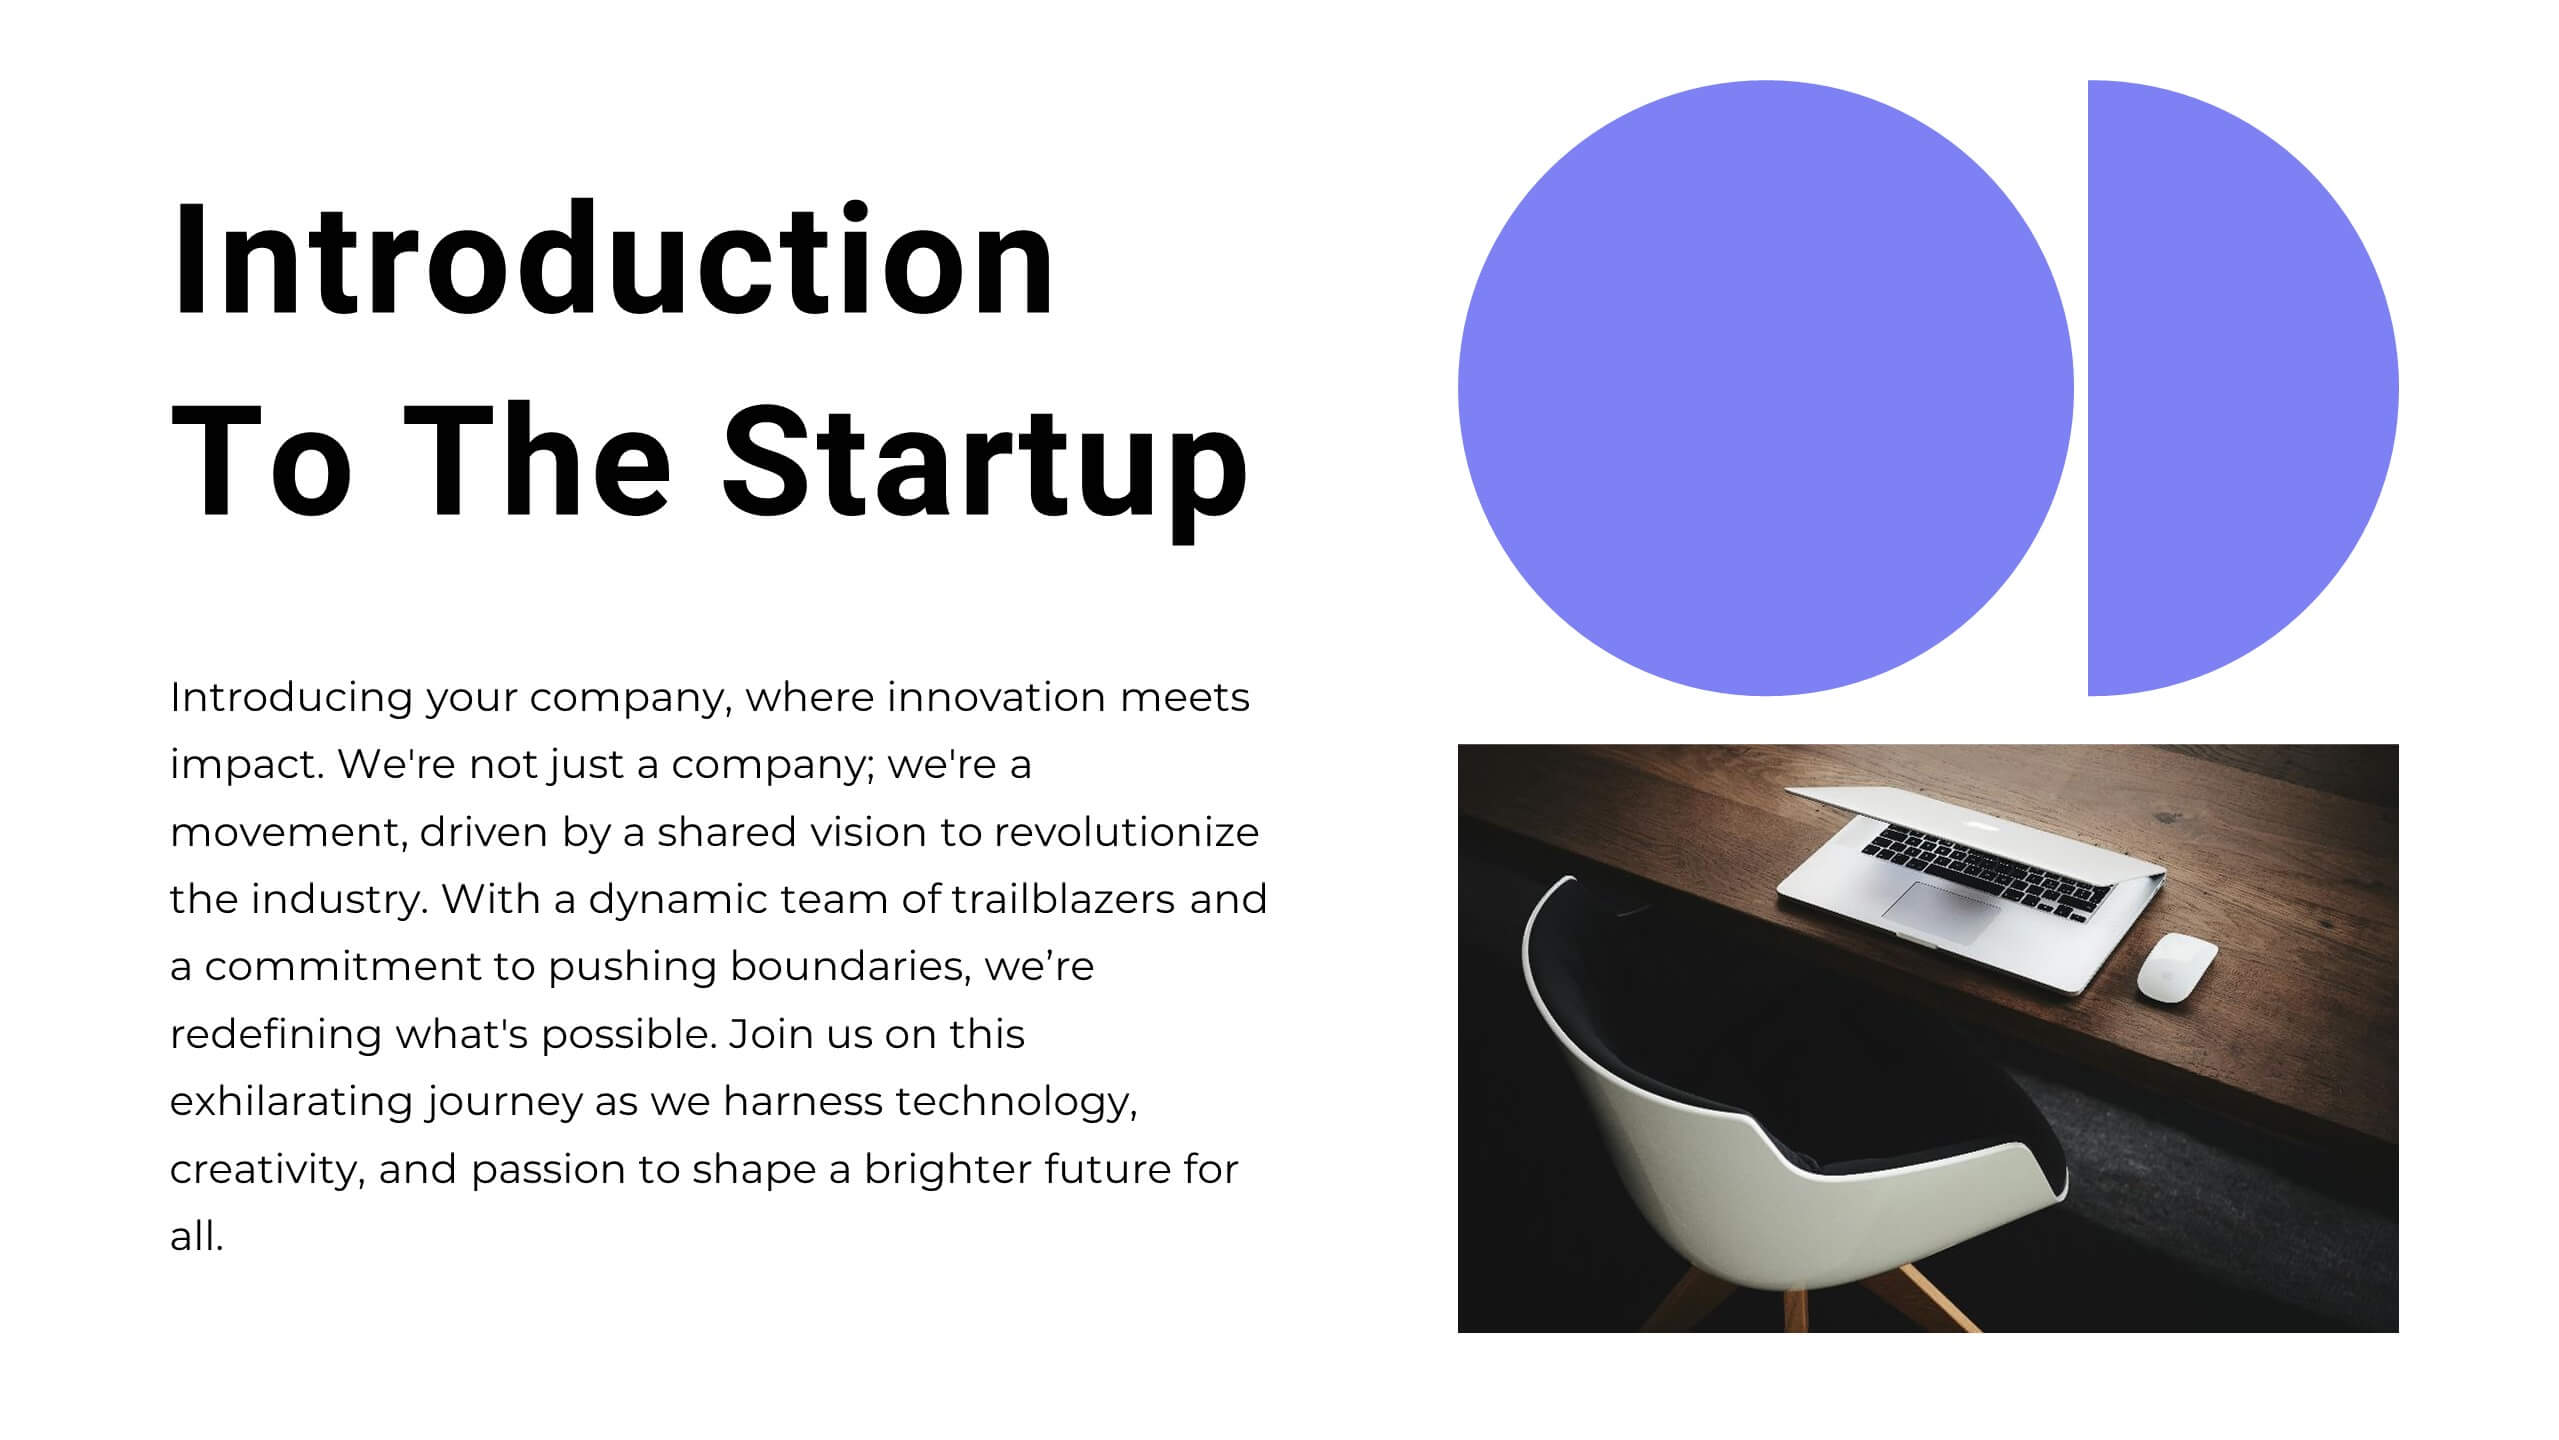
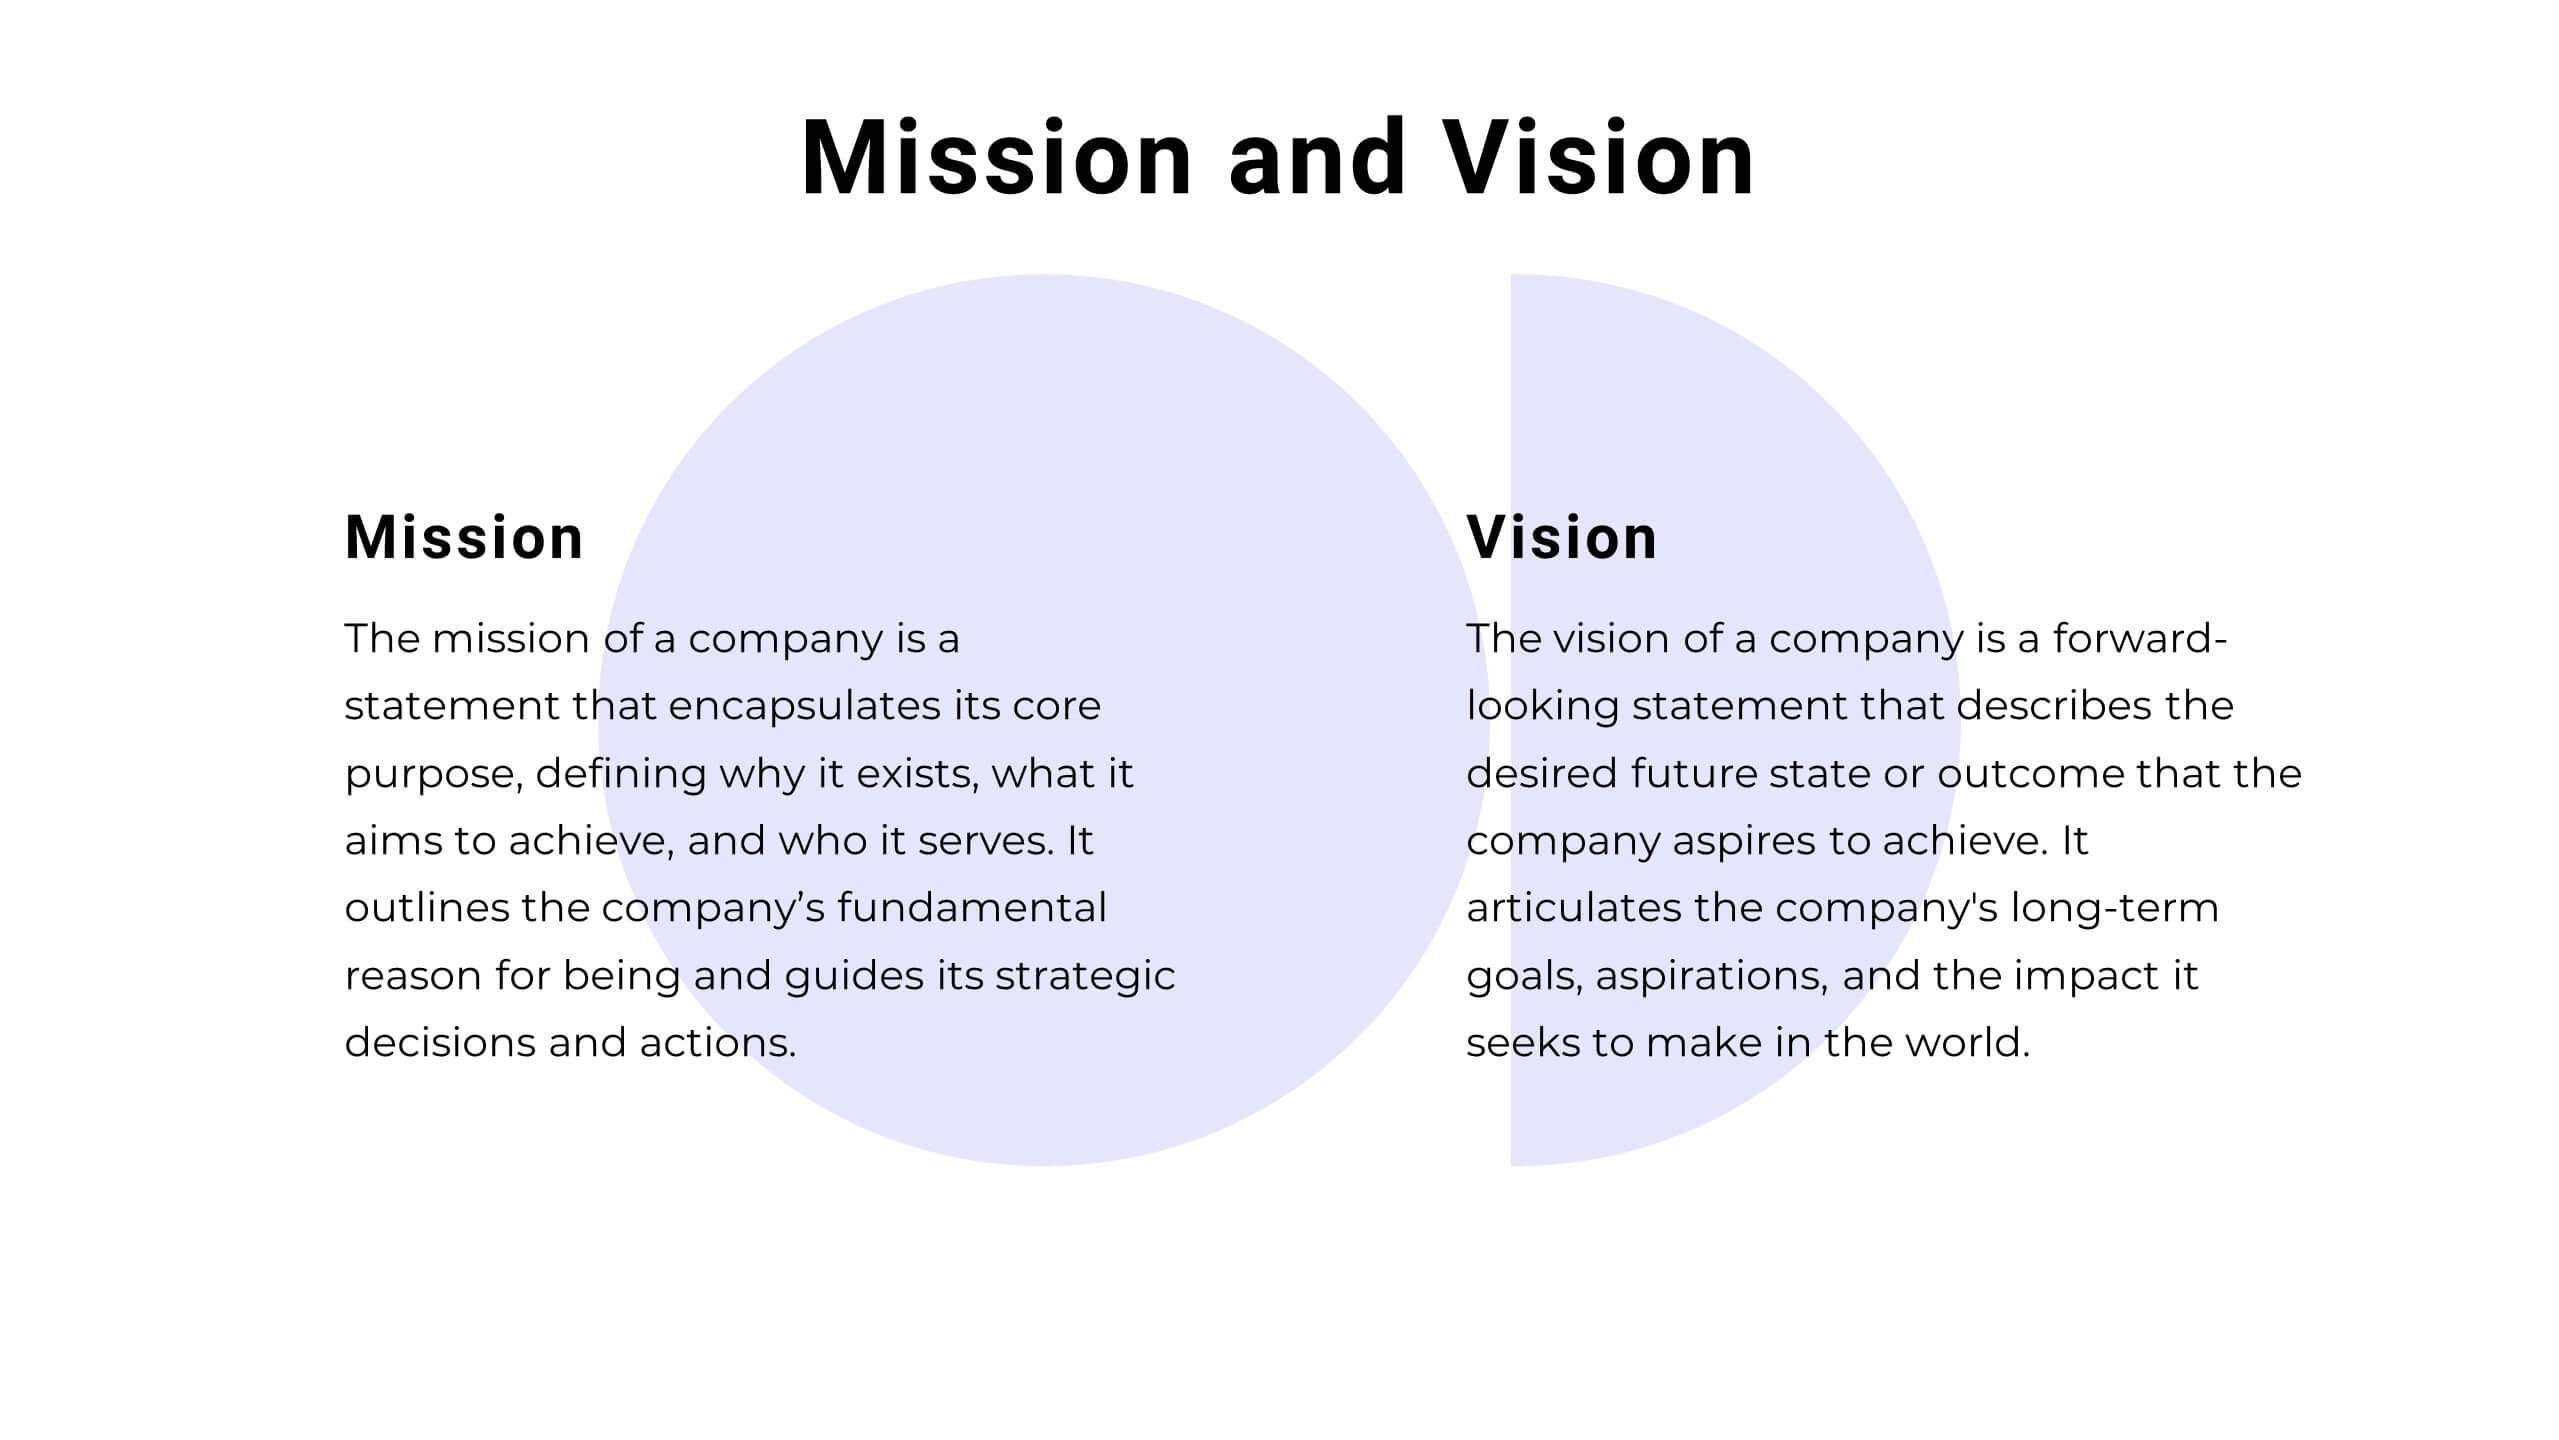
Vibrant Startup Pitch Deck Presentation
This dynamic and modern Startup Pitch Deck template is perfect for showcasing your startup's vision, strategy, and growth potential. Featuring a sleek design with bold visuals, this template guides you through key sections such as mission and vision, product/service overview, target market, and financial projections. It’s tailored to help you tell a compelling story that resonates with investors and stakeholders. The template is fully customizable in PowerPoint, Keynote, or Google Slides, ensuring you can adapt it to your specific needs and create a memorable presentation that leaves a lasting impression.


21 slides
Phantomwood Product Roadmap Presentation
A comprehensive presentation template designed to outline product strategies and roadmaps. Covers key aspects like target market, competitive analysis, pricing, and technical specifications. Highlight marketing approaches, production processes, and support information effectively. Fully editable, this template is compatible with PowerPoint, Keynote, and Google Slides for seamless collaboration and professional delivery.


5 slides
5-Level Risk Management Plan Presentation
Turn complex strategies into clear, visual steps with this sleek layered layout designed for analyzing and mitigating potential risks. Each level helps you outline priorities, assess impact, and communicate safety measures effectively. Fully compatible with PowerPoint, Keynote, and Google Slides, making customization fast, professional, and presentation-ready.


6 slides
Statistical Data Analysis Presentation
Delve into the details with the "Statistical Data Analysis" presentation templates, designed to simplify complex information into digestible insights. These templates feature interconnected gears symbolizing the intricate processes of data analysis, ideal for statisticians and analysts looking to present their findings effectively. Fully compatible with PowerPoint, Keynote, and Google Slides, they are a must-have for anyone presenting statistical data.


7 slides
Buyer Journey Infographic
Embark on a visual adventure with our Buyer Journey Infographic Template, designed to map out the critical stages of the consumer experience with flair and precision. This template captures each phase of the buyer's journey, from initial awareness to the final purchase decision, using a combination of bold graphics and streamlined information. Ideal for marketing professionals and business strategists, this template breaks down complex consumer behavior into clear, actionable insights. Utilize this engaging tool to showcase how customers interact with your brand at every touchpoint, highlighting opportunities for engagement and conversion enhancement. Fully customizable, this template allows you to adjust the visuals and text to align with your company’s branding and the specific nuances of your customer base. It’s an essential tool for presentations, training, and marketing materials, providing a foundation for strategies that resonate deeply with audiences and drive successful outcomes.


6 slides
Customer Empathy Map Infographics
Enhance your understanding of your customers' needs with our Customer Empathy Map infographic template. This template is fully compatible with popular presentation software like PowerPoint, Keynote, and Google Slides, allowing you to easily customize it to empathetically connect with your target audience. The Customer Empathy Map infographic template offers a visually engaging platform to explore and document your customers' thoughts, feelings, pains, and gains. Whether you're a marketer, product manager, or business owner, this template provides a user-friendly canvas to create customer profiles that drive better decision-making and customer-centric strategies. Elevate your customer relations with this SEO-optimized Customer Empathy Map infographic template, thoughtfully designed for clarity and ease of use. Customize it to gain insights into your customers' experiences, challenges, and aspirations, enabling you to tailor your products and services to their specific needs. Start crafting your personalized empathy map today to build stronger, more empathetic customer relationships.


24 slides
Petricor UX Strategy Plan Presentation
This UX Strategy Presentation offers a structured approach to user experience design, covering key aspects such as user research, wireframing, prototyping, and usability guidelines. With sections on branding, responsive design, and accessibility, this template is ideal for UX professionals. Fully editable and compatible with PowerPoint, Keynote, and Google Slides.


4 slides
Lean Agile Implementation Roadmap Presentation
Present your Lean Agile journey with this upward roadmap diagram. Designed for project managers and Agile teams, this layout visualizes four progressive stages using icons and curved arrows. Ideal for showcasing phased adoption, sprint milestones, or transformation goals. Fully customizable in PowerPoint, Keynote, and Google Slides for easy adaptation.