


Features
- 14 Unique slides
- Fully editable and easy to edit in Microsoft Powerpoint, Keynote and Google Slides
- 16:9 widescreen layout
- Clean and professional designs
- Export to JPG, PDF or send by email


Do you have any questions?
Recommend


4 slides
Buyer Persona and Market Segmentation Presentation
Visualize ideal customer types with this engaging buyer persona template. Showcase personality traits, goals, brand affinities, and bios in a stylish format with tropical-inspired accents. Ideal for market segmentation, branding, and campaign alignment. Fully editable in PowerPoint, Keynote, and Google Slides to match your marketing strategy and presentation tone.


6 slides
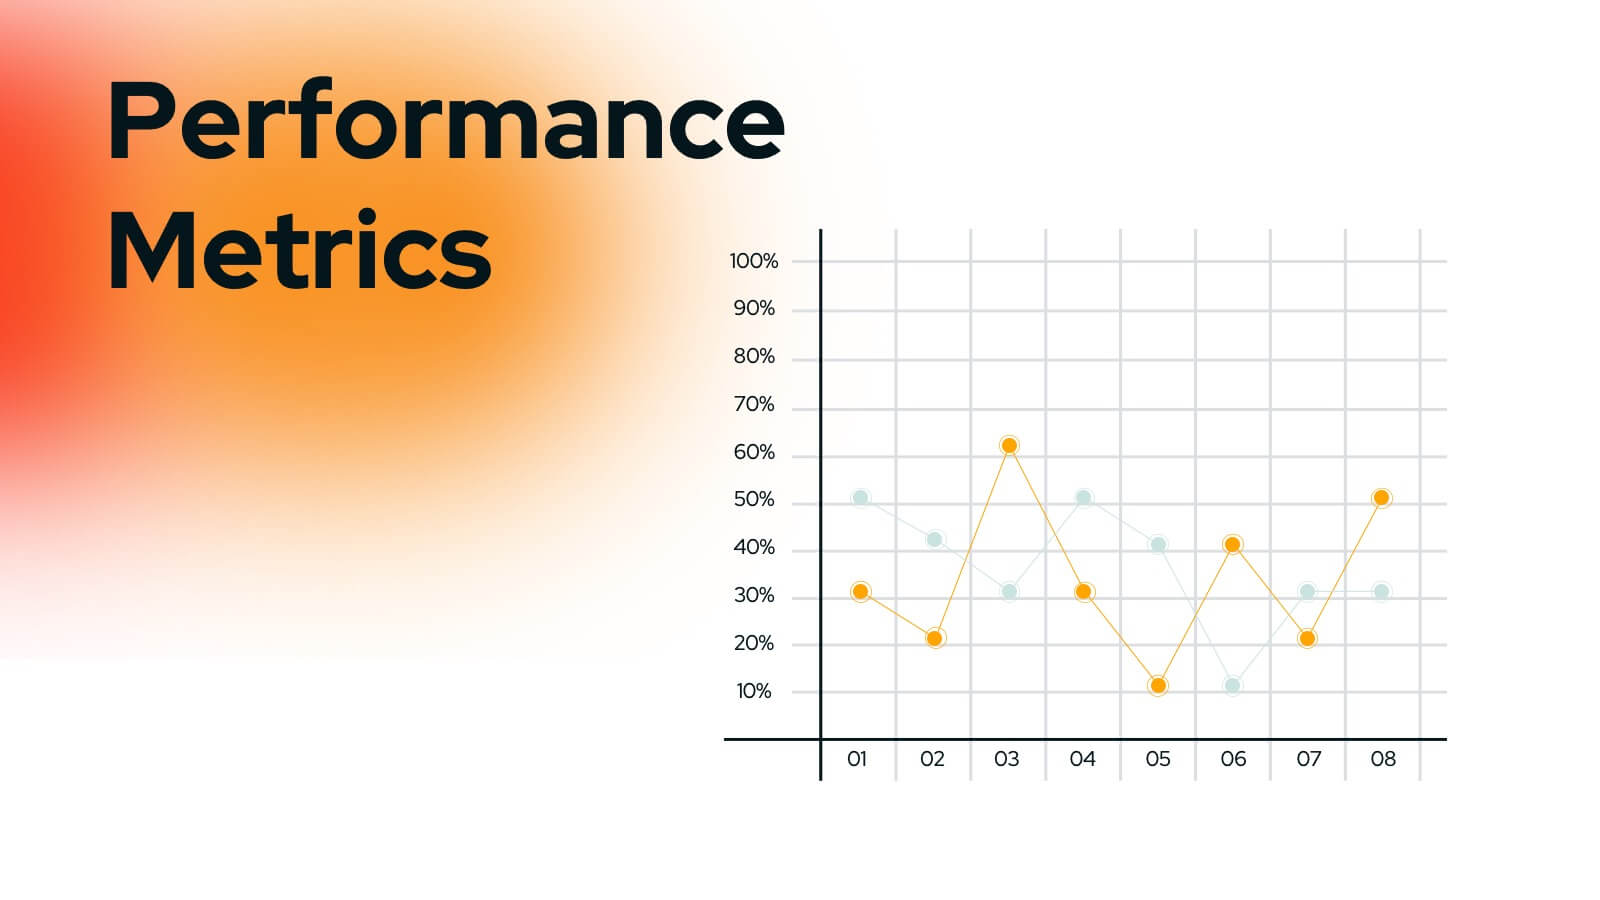
Business Advancement Metrics Presentation
Get ready to visualize your wins! This presentation template brings clarity to your metrics, helping you showcase business growth and performance benchmarks with sleek, stacked visuals. Perfect for tracking KPIs, performance analysis, or advancement trends. Fully compatible with PowerPoint, Keynote, and Google Slides for easy editing and seamless presentation delivery.


23 slides
Bracken Small Business Pitch Deck Presentation
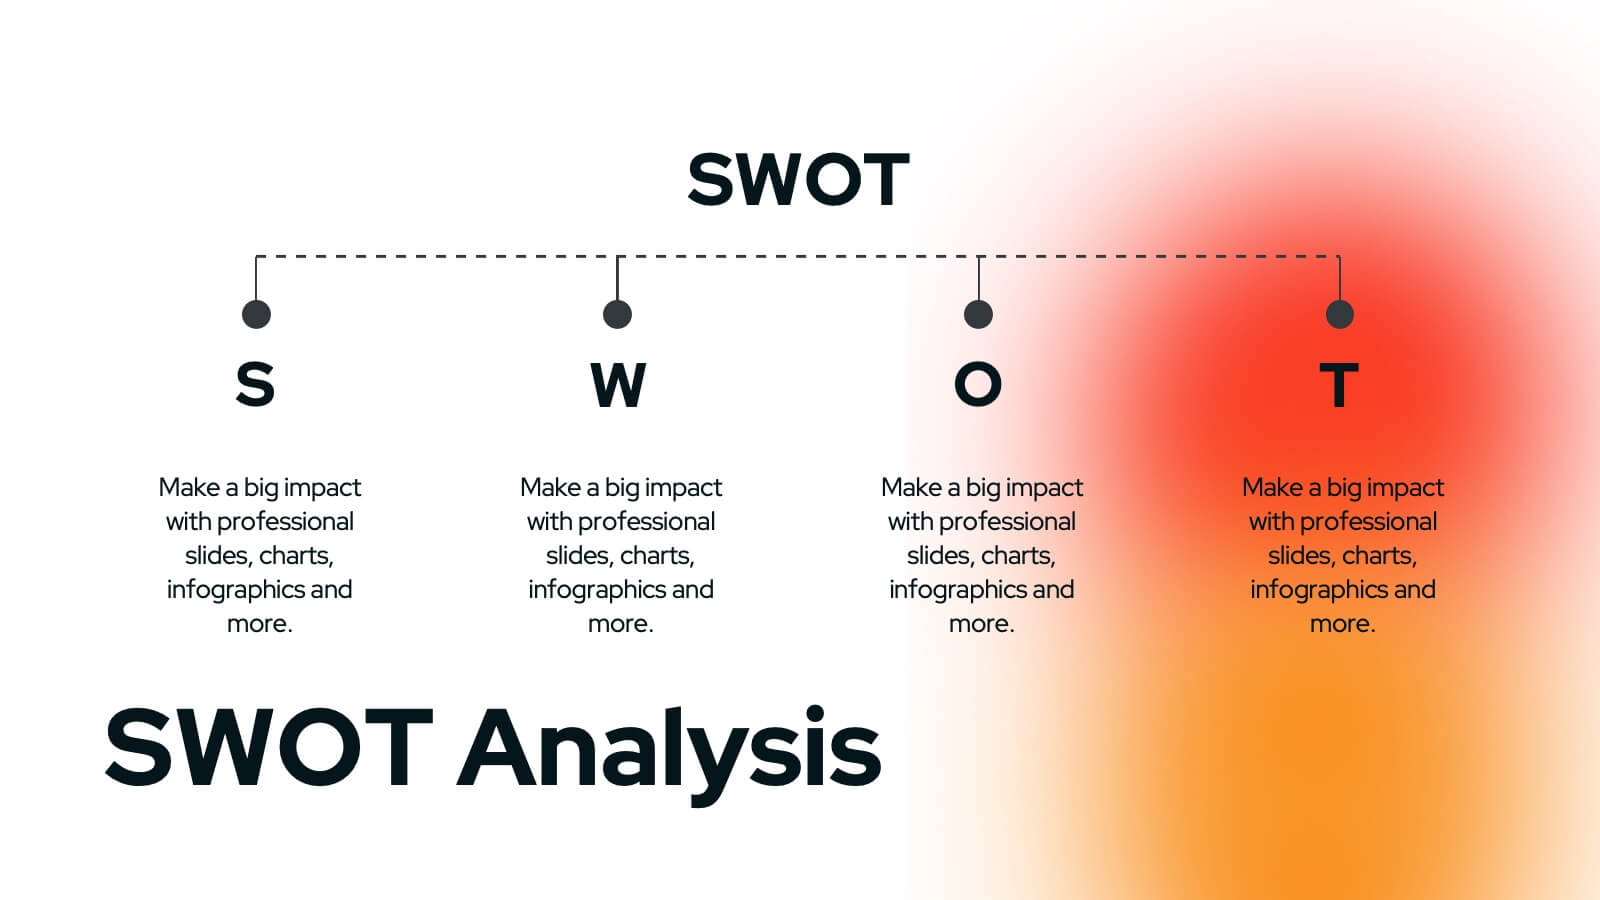
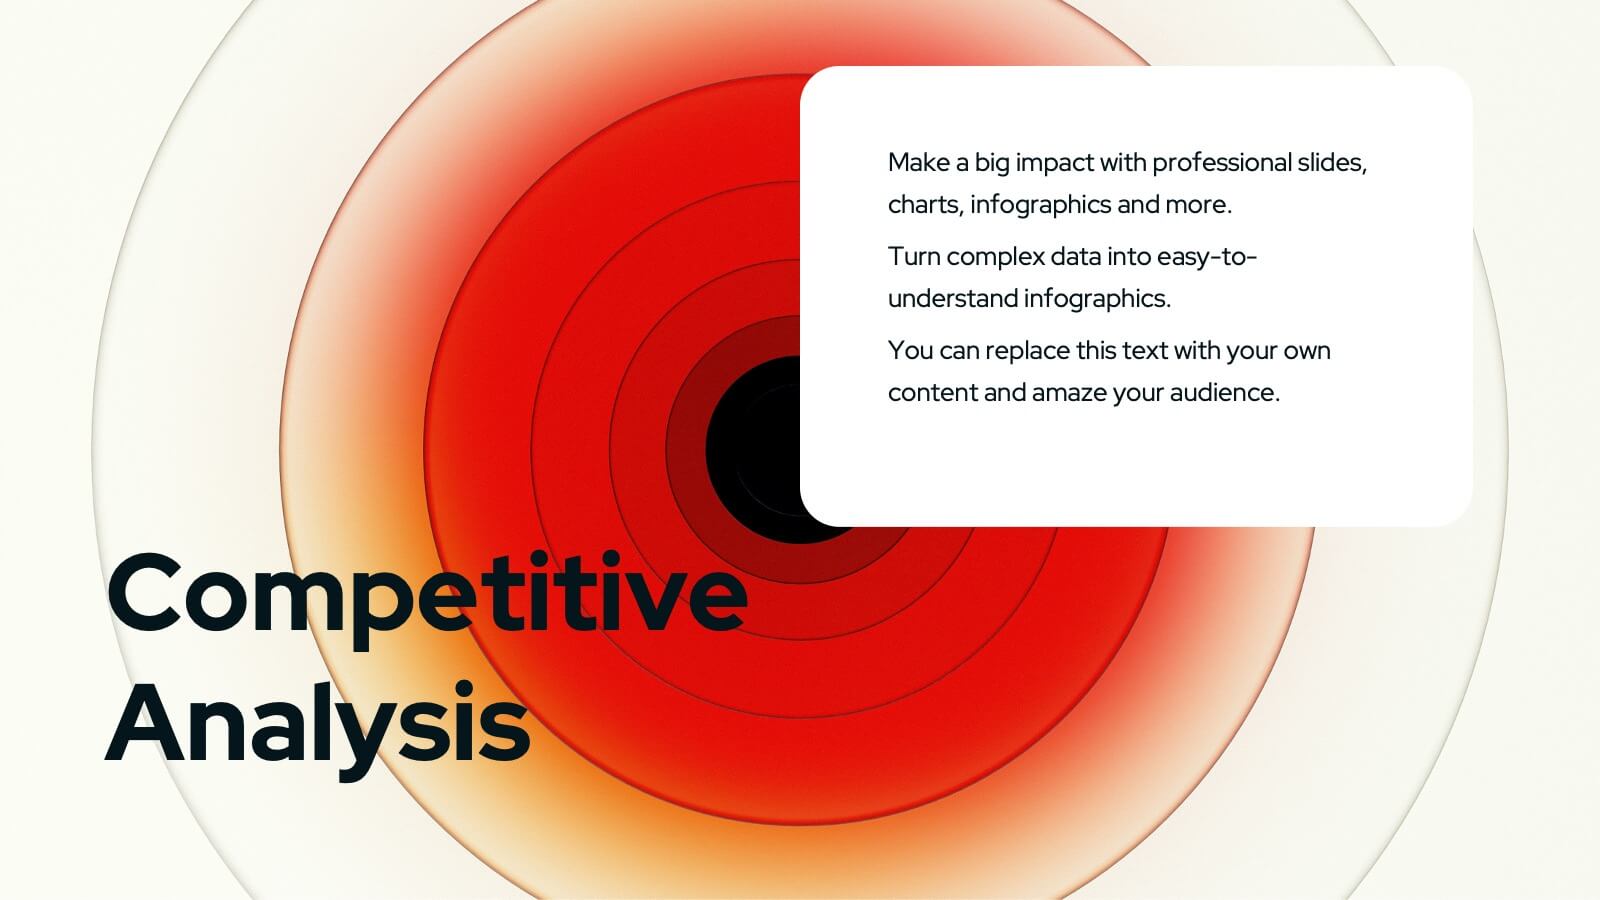
This clean and professional presentation template is perfect for showcasing your business ideas, market opportunities, and growth strategies. It includes essential sections such as company background, SWOT analysis, financial performance, marketing plan, and revenue models. Key highlights like competitive advantages, investment opportunities, and milestones ensure a comprehensive and organized pitch to captivate investors and stakeholders. Fully customizable and compatible with PowerPoint, Keynote, and Google Slides.


6 slides
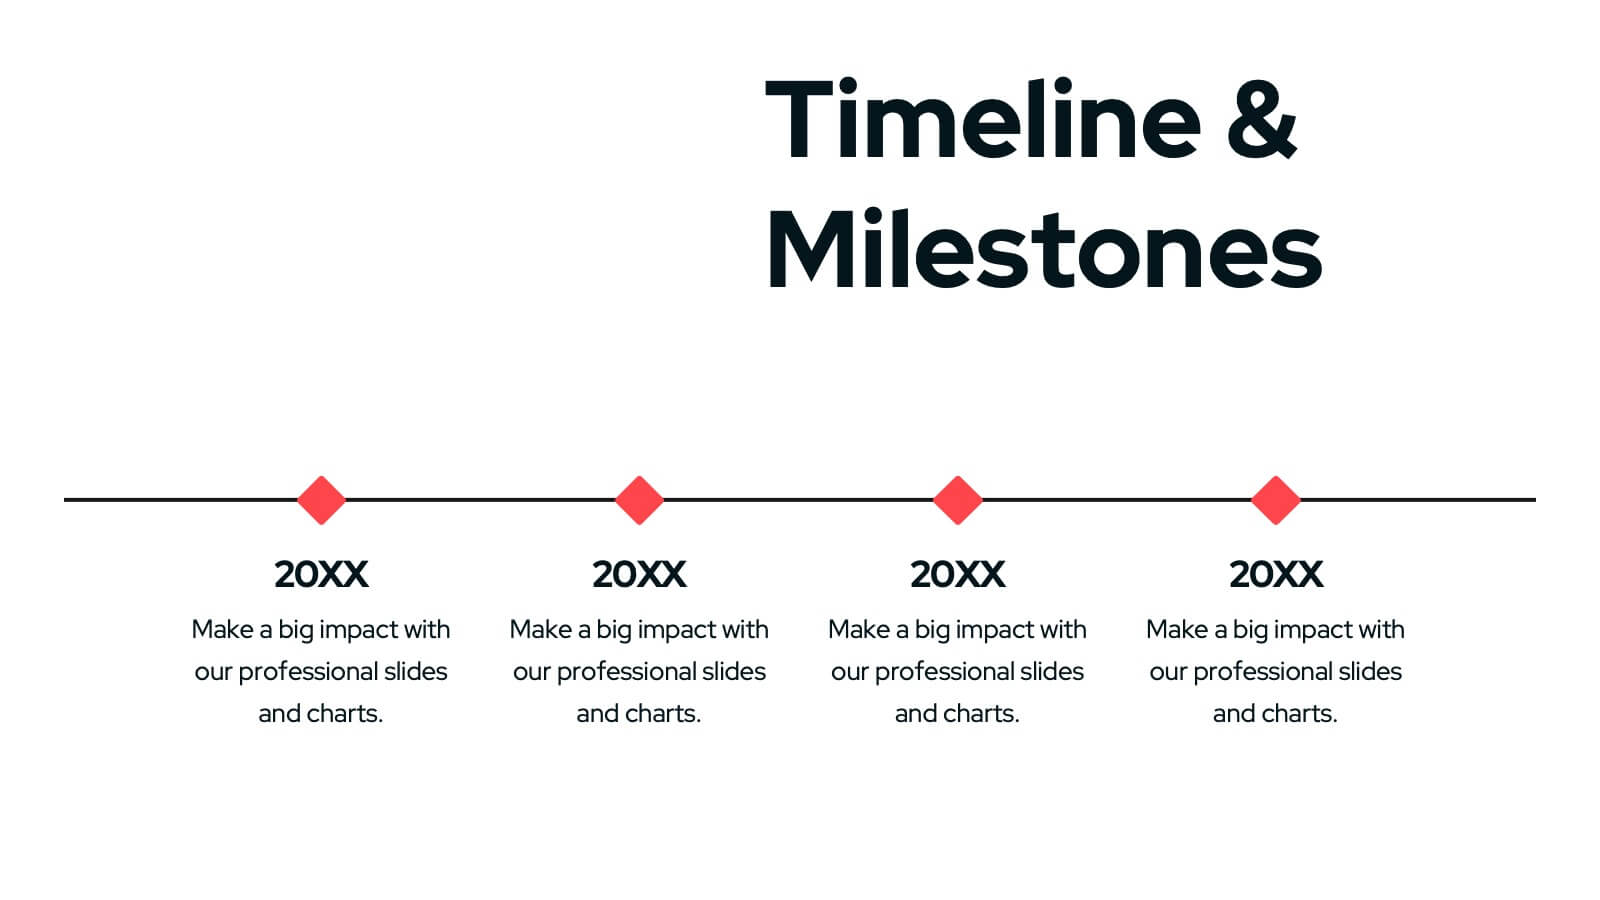
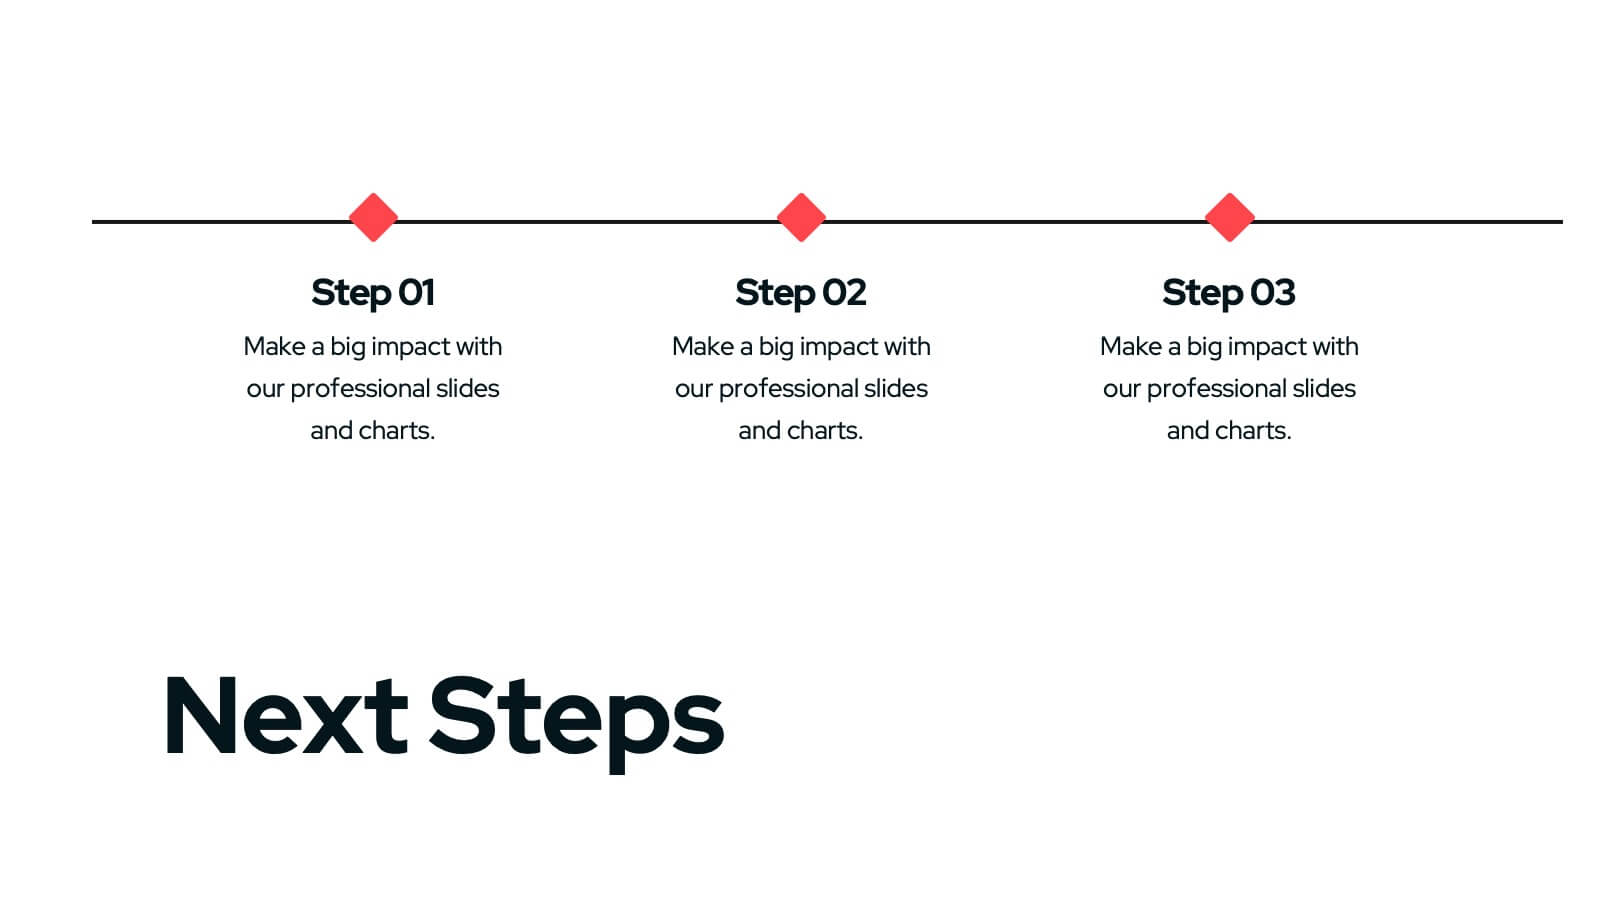
Next Steps Outline for Project Teams Presentation
Keep your team aligned and motivated with a clear visual roadmap that outlines every upcoming milestone. Perfect for presenting project phases, workflow updates, or strategic goals, this slide ensures everyone knows what’s next. Fully compatible with PowerPoint, Keynote, and Google Slides for seamless editing and presentation versatility.


20 slides
Chordstream Professional Portfolio Showcase Presentation
The Portfolio Presentation Template offers a modern and creative design, perfect for showcasing your projects, philosophy, and services. With 20 customizable slides, it includes sections for project highlights, pricing, client testimonials, and contact information. Compatible with PowerPoint, Keynote, and Google Slides, this template ensures professional impact for creatives.


4 slides
Feature Comparison Using Harvey Balls Presentation
Easily visualize performance levels with the Feature Comparison Using Harvey Balls Presentation. This slide is perfect for showing side-by-side comparisons across multiple categories, using universally understood Harvey Ball icons to represent completeness or satisfaction. Ideal for product evaluations, vendor selections, or strategic reviews. Fully editable in PowerPoint, Keynote, and Google Slides.


6 slides
Concept Web with Spider Diagram Layout Presentation
Map out complex ideas with clarity using the Concept Web with Spider Diagram Layout Presentation. This dynamic radial format is perfect for showing interrelated components, skills analysis, or performance metrics at a glance. Ideal for brainstorming, strategy, or education—fully editable in Canva, PowerPoint, Keynote, and Google Slides.


4 slides
IT Operations Management Presentation
Enhance your IT strategy with the IT Operations Management Presentation template. This clean, modern slide layout helps illustrate key operational processes, performance metrics, and strategic improvements with an easy-to-follow, upward trajectory design. Ideal for IT managers and business leaders looking to showcase efficiency, scalability, and innovation. Fully editable in PowerPoint, Keynote, and Google Slides for seamless customization.


6 slides
Real Estate Investment Portfolio Presentation
Bring your presentation to life with a clean, engaging layout that makes complex property portfolios easy to understand. This slide helps you break down key investments, showcase performance, and highlight essential insights with clarity and flow. Perfect for real estate reports or pitch decks, and fully compatible with PowerPoint, Keynote, and Google Slides.


6 slides
Multiple Business Solutions Options Slide Presentation
Explore diverse strategies with the Multiple Business Solutions Options Slide Presentation. Featuring a vertical stack of labeled briefcases (A–F), this slide is designed to compare and communicate multiple business ideas, solutions, or pathways in a clear, structured layout. Ideal for pitching product variations, workflow choices, or market entry tactics. Each option is paired with customizable text fields for added clarity. Compatible with PowerPoint, Keynote, and Google Slides for easy editing and integration into your existing decks.


5 slides
Clean Water Access and Sustainability Goals Presentation
Visually track progress with the Clean Water Access and Sustainability Goals Presentation. This intuitive slide design uses water-filled glasses to represent four stages of development, making it perfect for sustainability metrics, public health initiatives, or project benchmarks. Fully customizable and compatible with PowerPoint, Keynote, Google Slides, and Canva.


6 slides
5-Step SEO Marketing Funnel Presentation
Ignite your marketing story with a bold, flowing visual that makes every step feel purposeful and easy to follow. This presentation breaks down each stage of the SEO funnel, helping you explain strategy, performance, and conversion paths with clarity. Fully compatible with PowerPoint, Keynote, and Google Slides.

21 slides
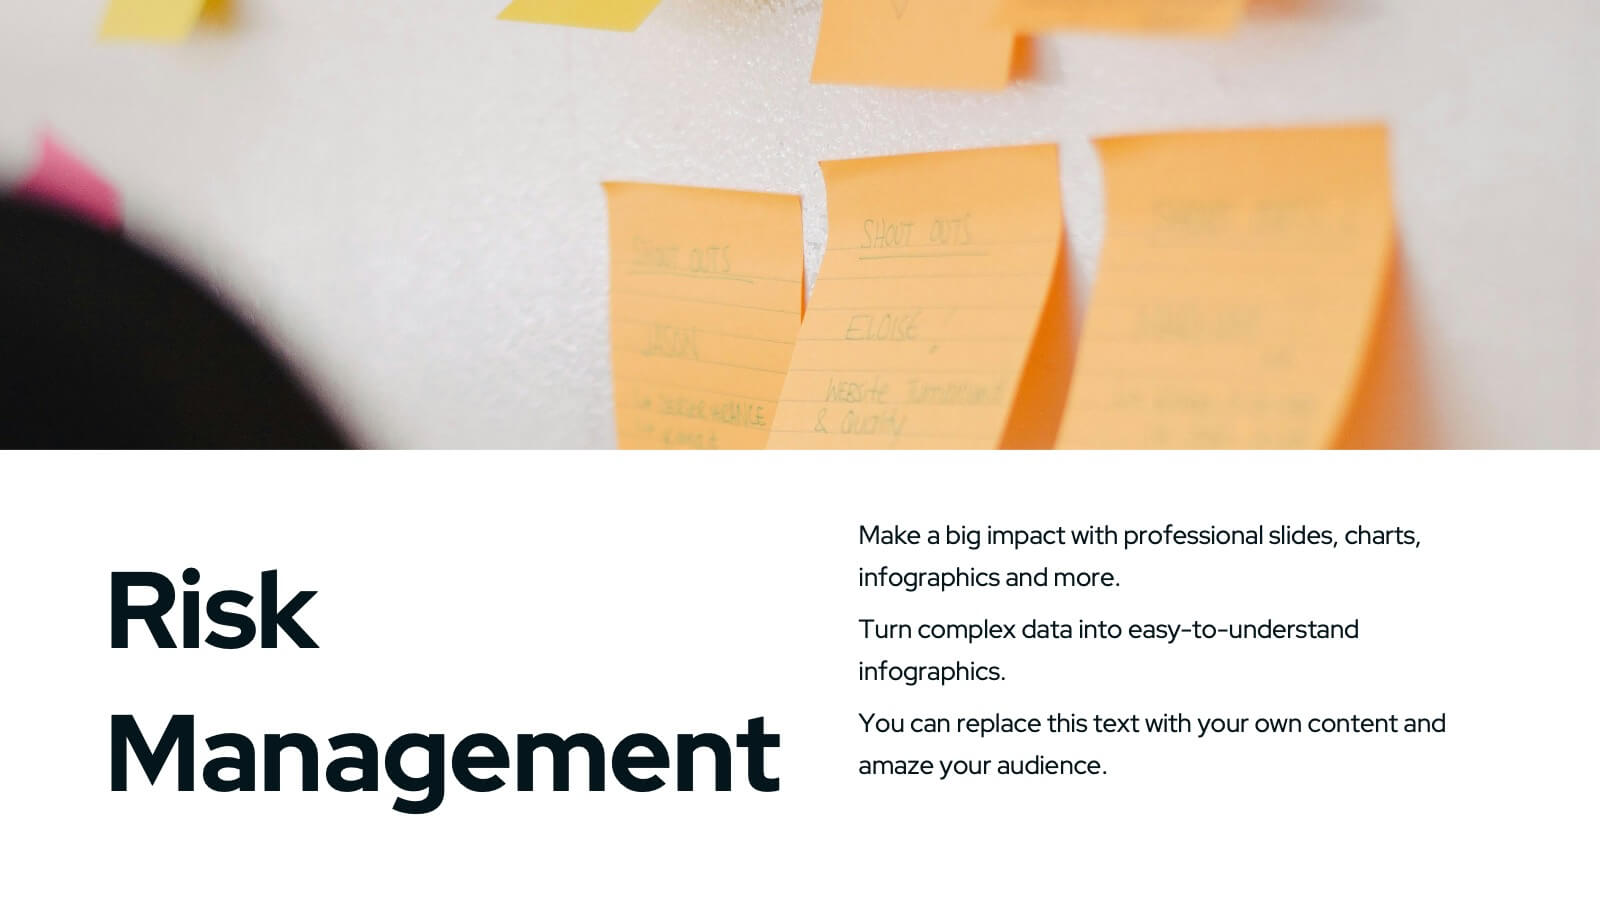
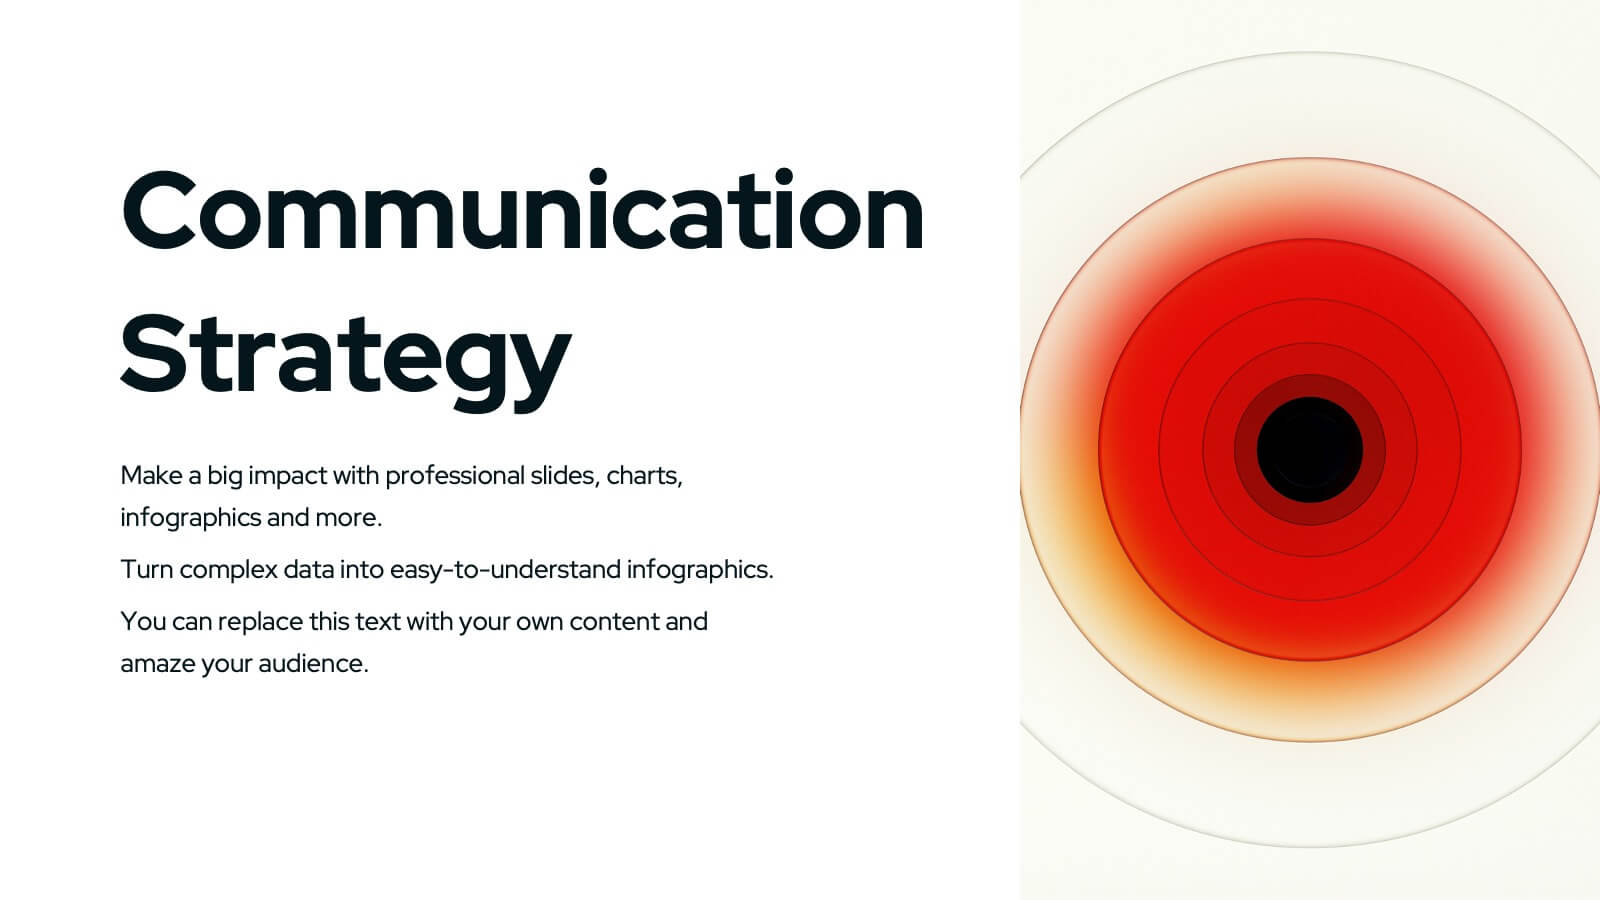
Wyrm Marketing Strategy Plan Presentation
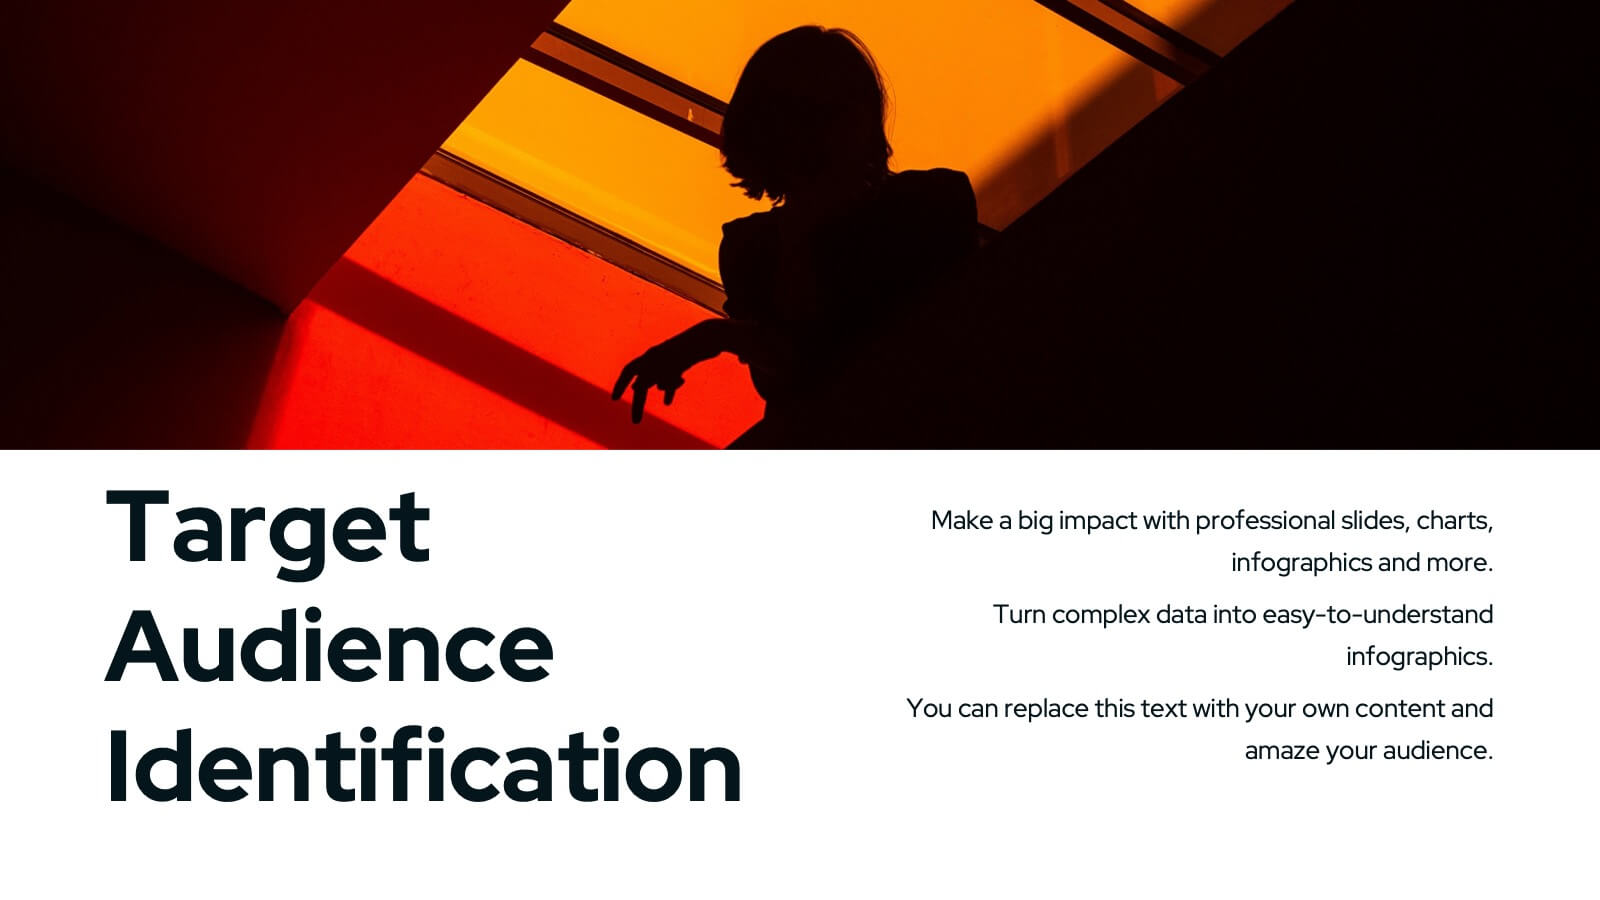
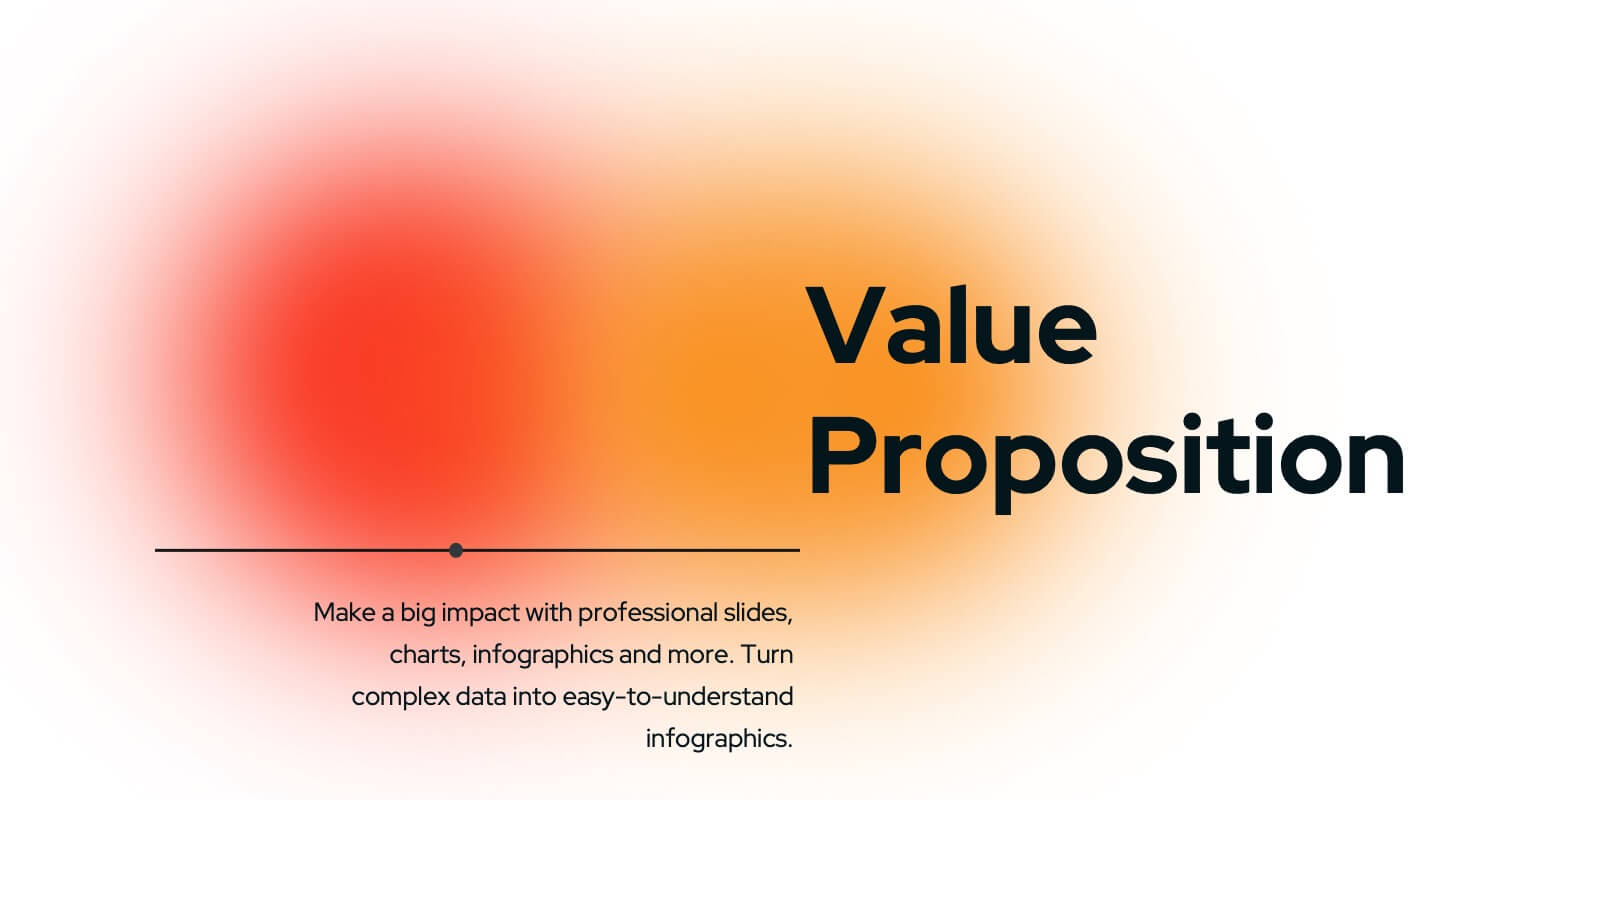
Unleash the power of your marketing strategy with this bold and dynamic presentation template! Perfect for covering everything from landscape analysis and target audience identification to performance metrics and risk management. This template helps guide your audience through key challenges, SWOT analysis, and strategic initiatives with clarity and impact. Compatible with PowerPoint, Keynote, and Google Slides for effortless and engaging presentations.


12 slides
Personal Portfolio Presentation
Our Personal Portfolio Presentation template is designed for professionals looking to make a strong impression with a sleek and engaging portfolio. This comprehensive template provides an excellent framework to showcase your personal brand, professional journey, and achievements. The opening slide, with your name boldly presented, acts as your introduction. It's followed by a 'Get to know me' section that offers a glimpse into your personality and work ethic. The 'Skills' slide is a visually impactful way to present your competencies, while the 'Experience' slide chronologically outlines your professional milestones. Featuring sections for detailed case studies, showcased projects, and educational background, this template helps you tell your story in a cohesive and captivating manner. The 'Recognitions' slide allows you to highlight awards and honors, adding credibility to your profile. Ending with a compelling 'Let's work together!' call-to-action, this template is adaptable to PowerPoint, Keynote, and Google Slides, perfect for anyone looking to stand out in their field.


7 slides
Concept Development for Great Ideas Presentation
Bring your ideas to life with the Concept Development for Great Ideas Presentation. This visually engaging layout features a central lightbulb icon surrounded by six customizable segments—ideal for breaking down key phases of ideation, planning, or innovation strategy. Clean, color-coded elements help guide your audience through your thought process. Compatible with Canva, PowerPoint, Keynote, and Google Slides.


5 slides
Innovation in Digital Technologies Presentation
Highlight key advancements with this Innovation in Digital Technologies Presentation. Designed with four modern icon segments, this slide helps communicate your digital transformation journey clearly. Ideal for showcasing emerging tools, platforms, or strategies. Fully editable in Canva, PowerPoint, or Google Slides for seamless integration into any tech-focused presentation.


6 slides
Market Trends Heat Map Visualization Presentation
Analyze market trends with an intuitive heat map infographic. This visualization helps identify patterns, strengths, and risks using color-coded data blocks. Perfect for financial analysis, competitive research, and industry forecasting. Fully customizable and compatible with PowerPoint, Keynote, and Google Slides for seamless integration into your presentations.