


Features
- 4 Unique slides
- Fully editable and easy to edit in Microsoft Powerpoint, Keynote and Google Slides
- 16:9 widescreen layout
- Clean and professional designs
- Export to JPG, PDF or send by email


Do you have any questions?
Recommend


5 slides
RAPID Framework for Business Strategy
Clarify decision-making roles with confidence using this vibrant business strategy framework. This template visualizes the RAPID model—Recommend, Agree, Perform, Input, Decide—in a clear flow that simplifies collaboration and speeds up strategy execution. Ideal for leadership teams and cross-functional planning. Works seamlessly in PowerPoint, Keynote, and Google Slides.


7 slides
Alphabet Infographic Presentation Template
Our Alphabet Infographic features a well-designed set of icons, letters and numbers. This template is perfect for PowerPoint presentations and will allow you to enhance your business/school design. Make your data sets easily readable, attractive and concise with this template. This Alphabet Infographic template is perfect for making your pitch stand out, with a bold and catchy design. It features a modern look that captures viewer's attention, but also contains plenty of details for them to explore. The colors are bright and vibrant, so you know the message won't be forgotten easily.


21 slides
Project Proposal Presentation
Outline your project's scope and objectives with precision using this Project Proposal presentation template. Designed for clarity and impact, it includes slides for project overview, deliverables, timeline, budget breakdown, and risk management. Ideal for project managers and teams, this template ensures detailed communication and streamlined project planning. Compatible with PowerPoint, Keynote, and Google Slides, it's perfect for driving successful project execution.


3 slides
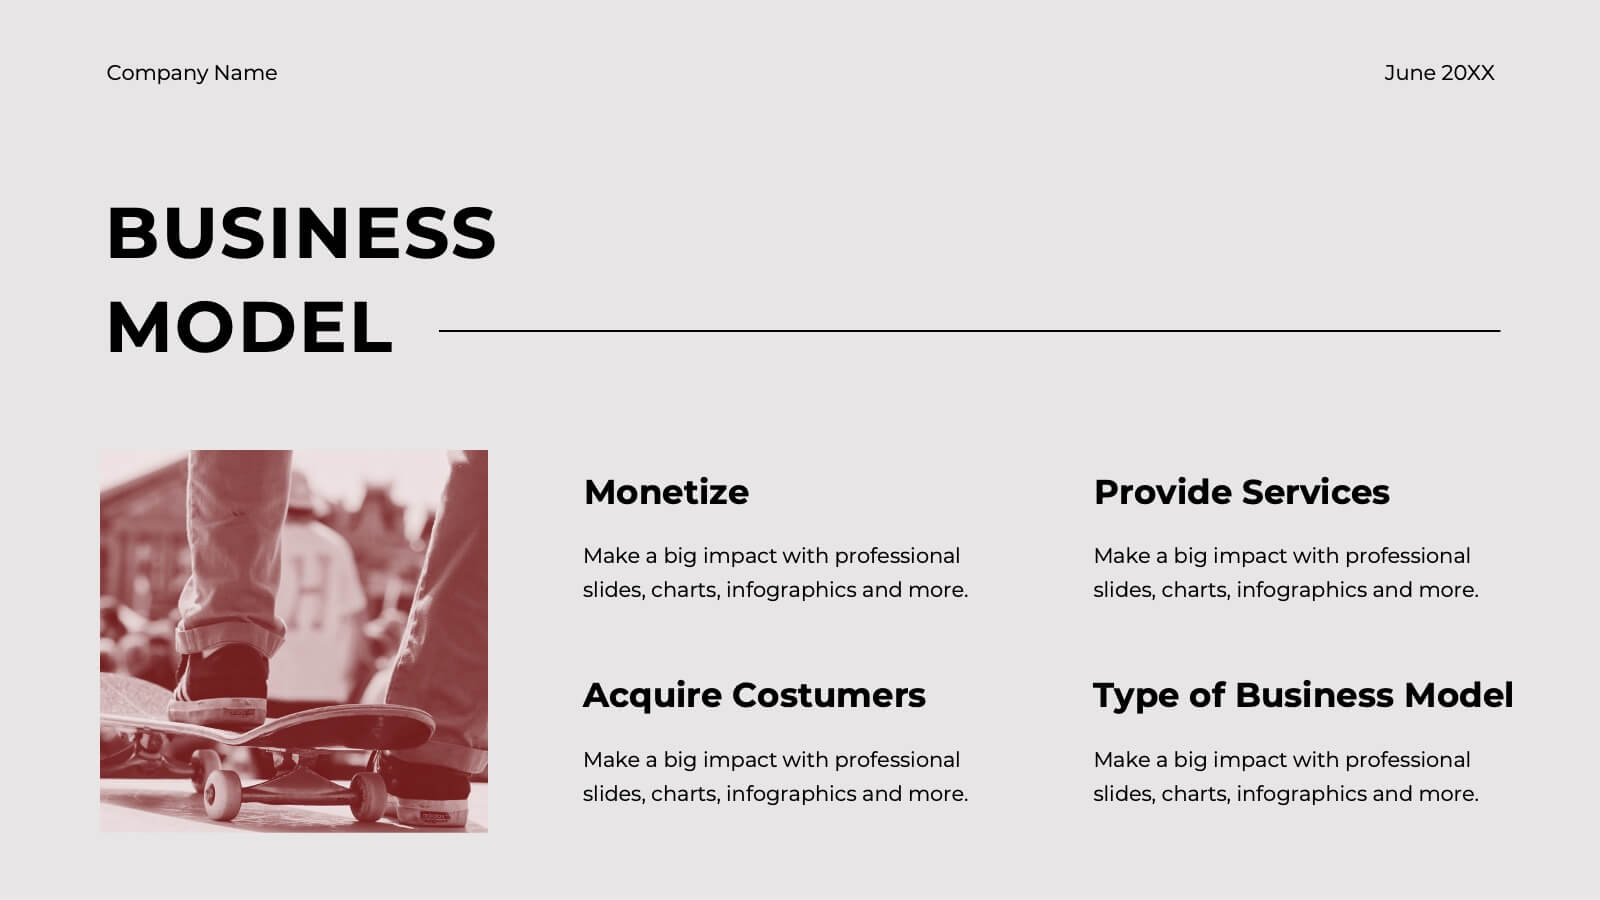
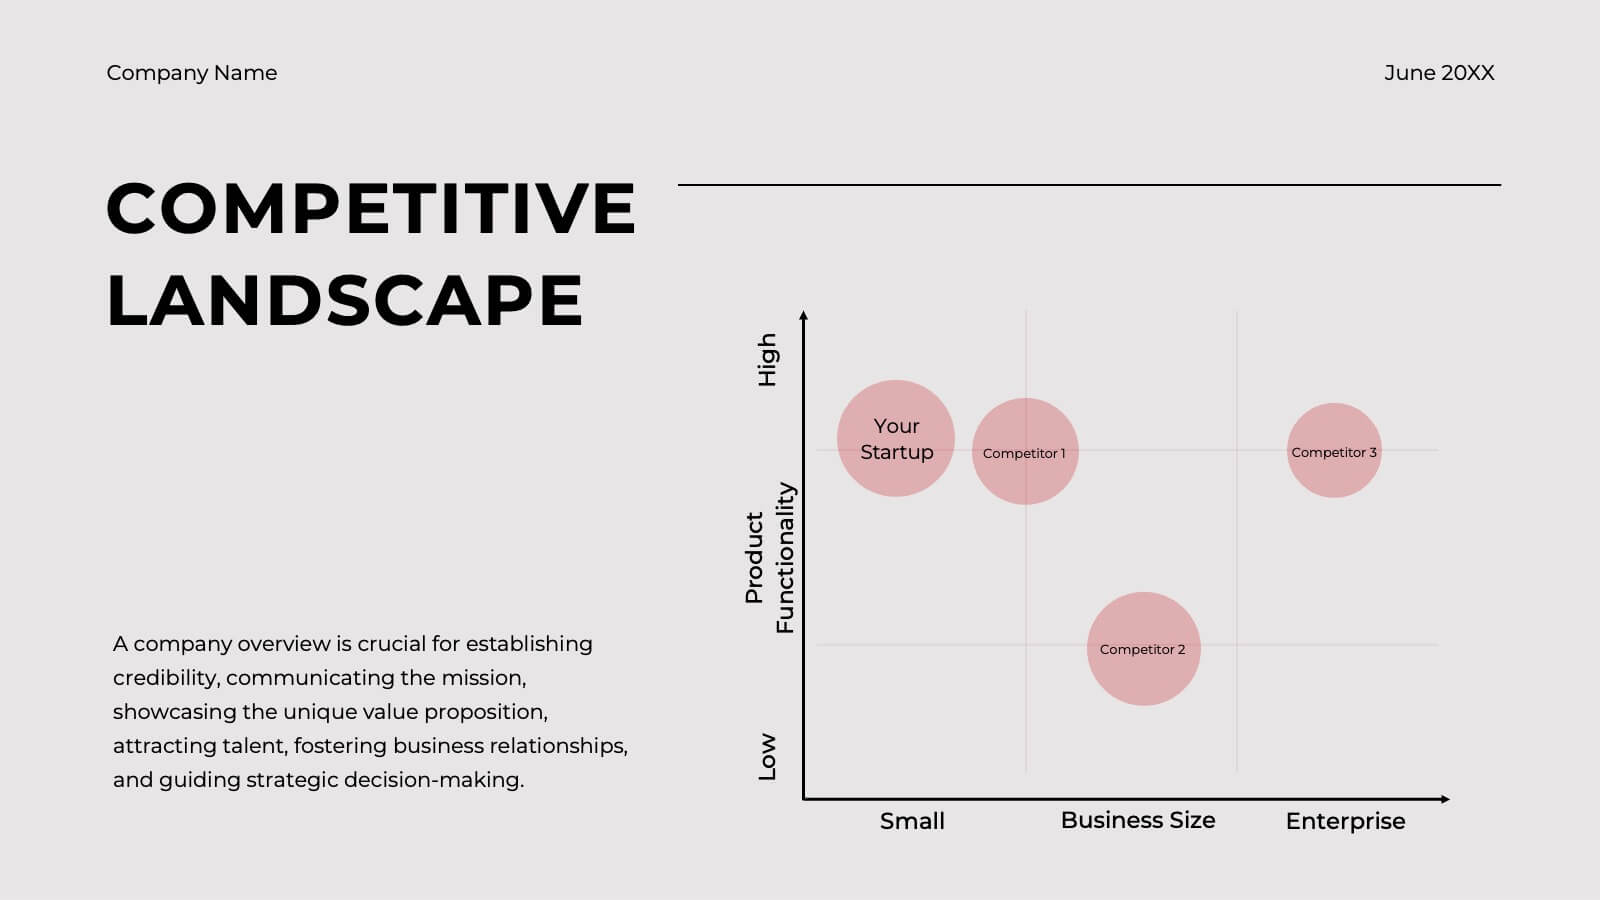
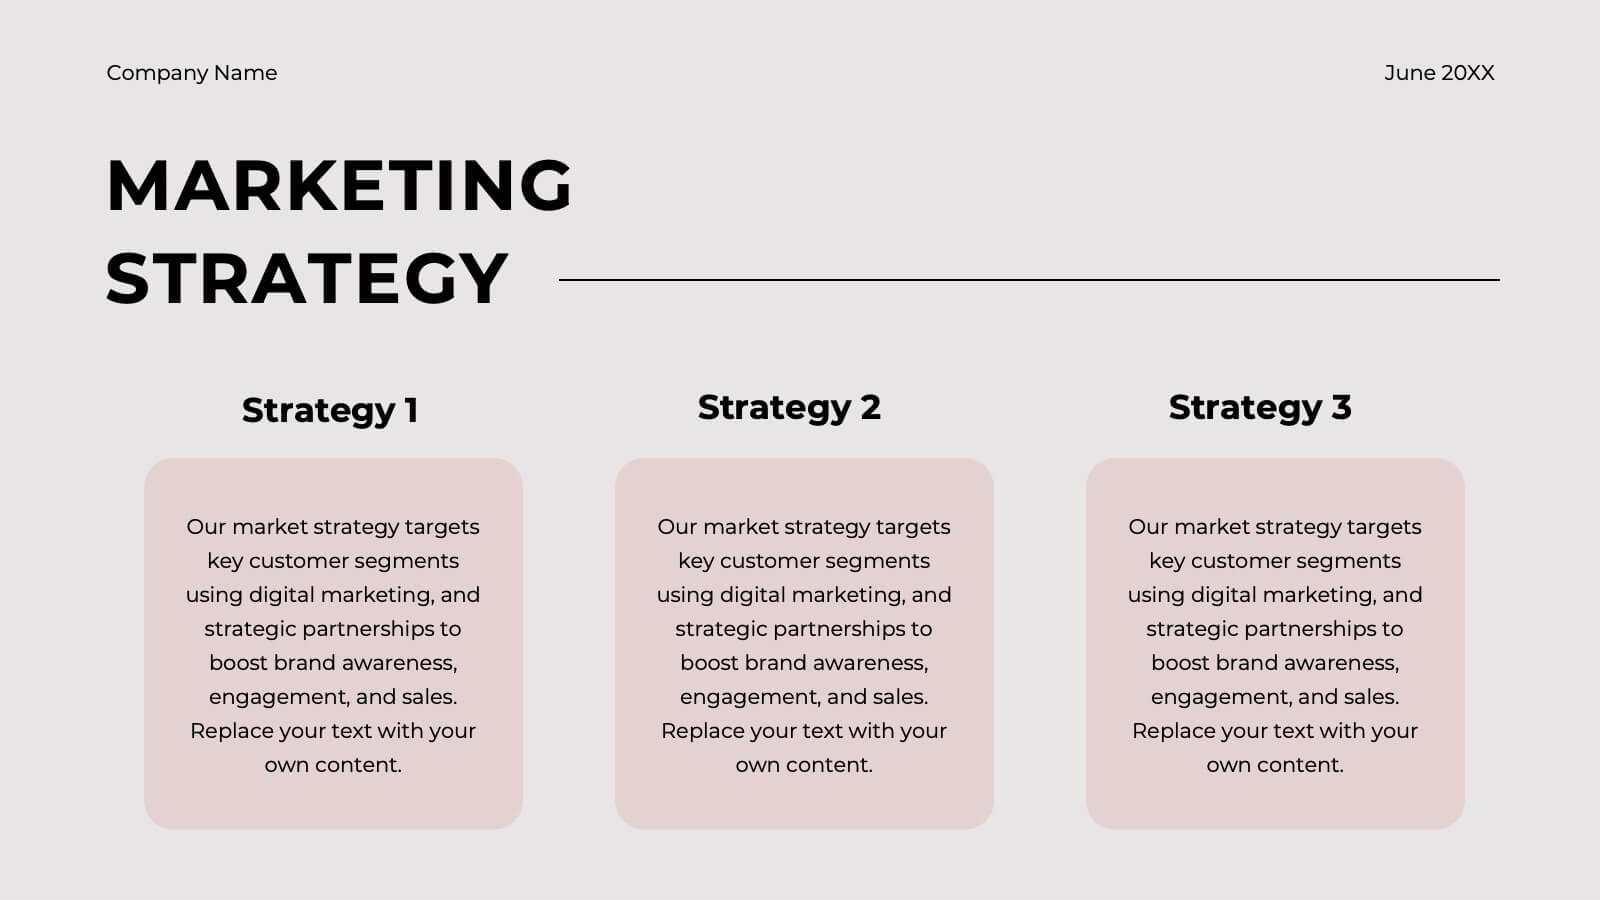
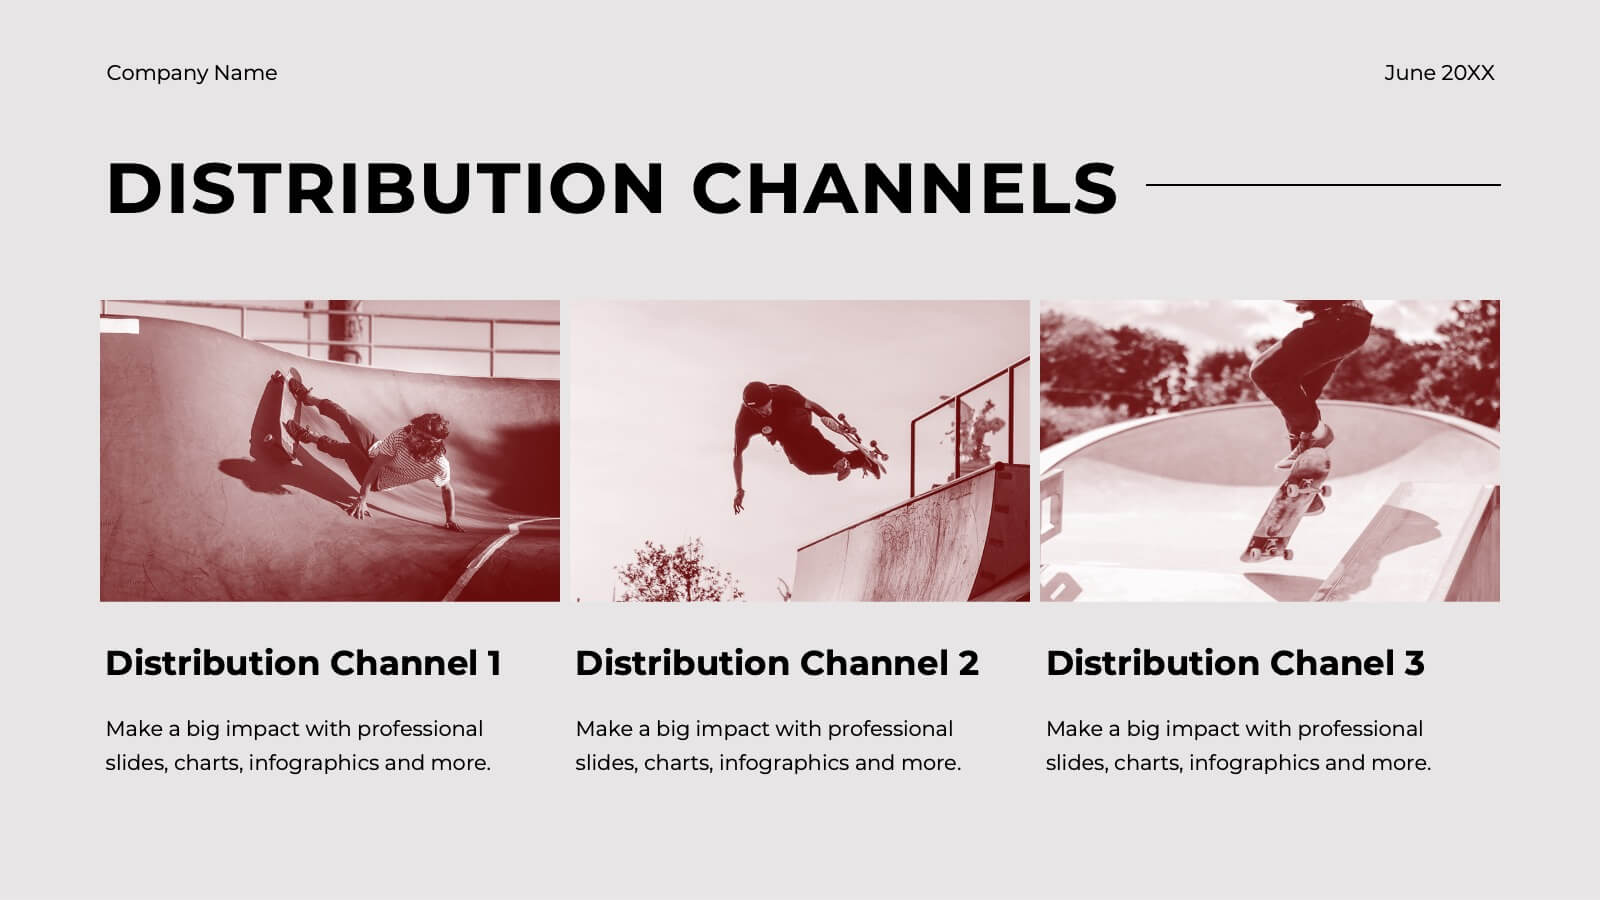
Strategic Planning and Business Model Presentation
Present your business roadmap with clarity using this Strategic Planning and Business Model slide. Featuring a modular grid layout, it allows you to break down initiatives, objectives, and action items into digestible segments. Perfect for business strategy sessions, planning workshops, or executive reports. Fully editable in PowerPoint, Canva, and Google Slides.


21 slides
Naga Project Proposal Presentation
Present your project with confidence using this comprehensive proposal presentation! It covers crucial sections such as objectives, methodology, timeline, budget breakdown, and risk mitigation strategies, ensuring every detail is addressed clearly. Ideal for client proposals or internal planning, this template works seamlessly with PowerPoint, Keynote, and Google Slides.


6 slides
Social Media Analytics Infographic
Social Media Analytics refers to the process of collecting, analyzing, and interpreting data from social media platforms to gain insights into audience behavior, content performance, and overall social media effectiveness. This template showcases key concepts and insights related to social media analytics. This template is designed to help individuals and businesses understand and leverage the power of data-driven analysis to enhance their social media strategies. This template is perfect to optimize your social media presence, improve engagement, and drive meaningful results. Compatible with Powerpoint, Keynote, and Google Slides.


7 slides
Solution Infographics Presentation Template
Featuring our solution Infographic template, We have a solution for your presentation problems. Give your next presentation the edge with this template, that allows you to present the perfect solutions to your audience. All the content is completely customizable and the built-in icons can be replaced with your own text and illustrations. Choose from the various themes available, and make it fit your needs. This template contains all the elements needed to make your infographic presentation pop! graphs, photos and a minimal style makes this design perfect for any kind of project.


8 slides
Customer Survey Results Analysis Presentation
Visualize feedback clearly and confidently with this dynamic results breakdown template. Featuring circular percentage graphics around a central report icon, this slide is ideal for presenting survey insights, NPS metrics, or user feedback summaries. Fully editable in PowerPoint, Keynote, and Google Slides.


5 slides
Innovative Strategic SWOT Layout
Visualize your strategic edge with the Innovative Strategic SWOT Layout Presentation. This clean, overlapping-circle design brings attention to the interconnection between Strengths, Weaknesses, Opportunities, and Threats while maintaining a minimal, modern look. Each element is paired with space for concise insights, making it perfect for leadership briefings, planning sessions, or team reviews. Fully editable in PowerPoint, Keynote, and Google Slides.


5 slides
Business Hierarchy Pyramid Presentation
Present your business structure or priorities with clarity using our "Business Hierarchy Pyramid Presentation" template. This infographic elegantly segments different layers or levels within your organization, project, or planning strategy, with a pyramid design that visually emphasizes the foundational to advanced stages. Each level of the pyramid is distinctly colored and labeled, allowing you to easily insert key points or data relevant to each segment. Ideal for corporate presentations, strategic meetings, and management training, this template ensures your key concepts are organized and clearly communicated. Compatible with PowerPoint, Keynote, and Google Slides, it integrates effortlessly into your professional toolkit.


4 slides
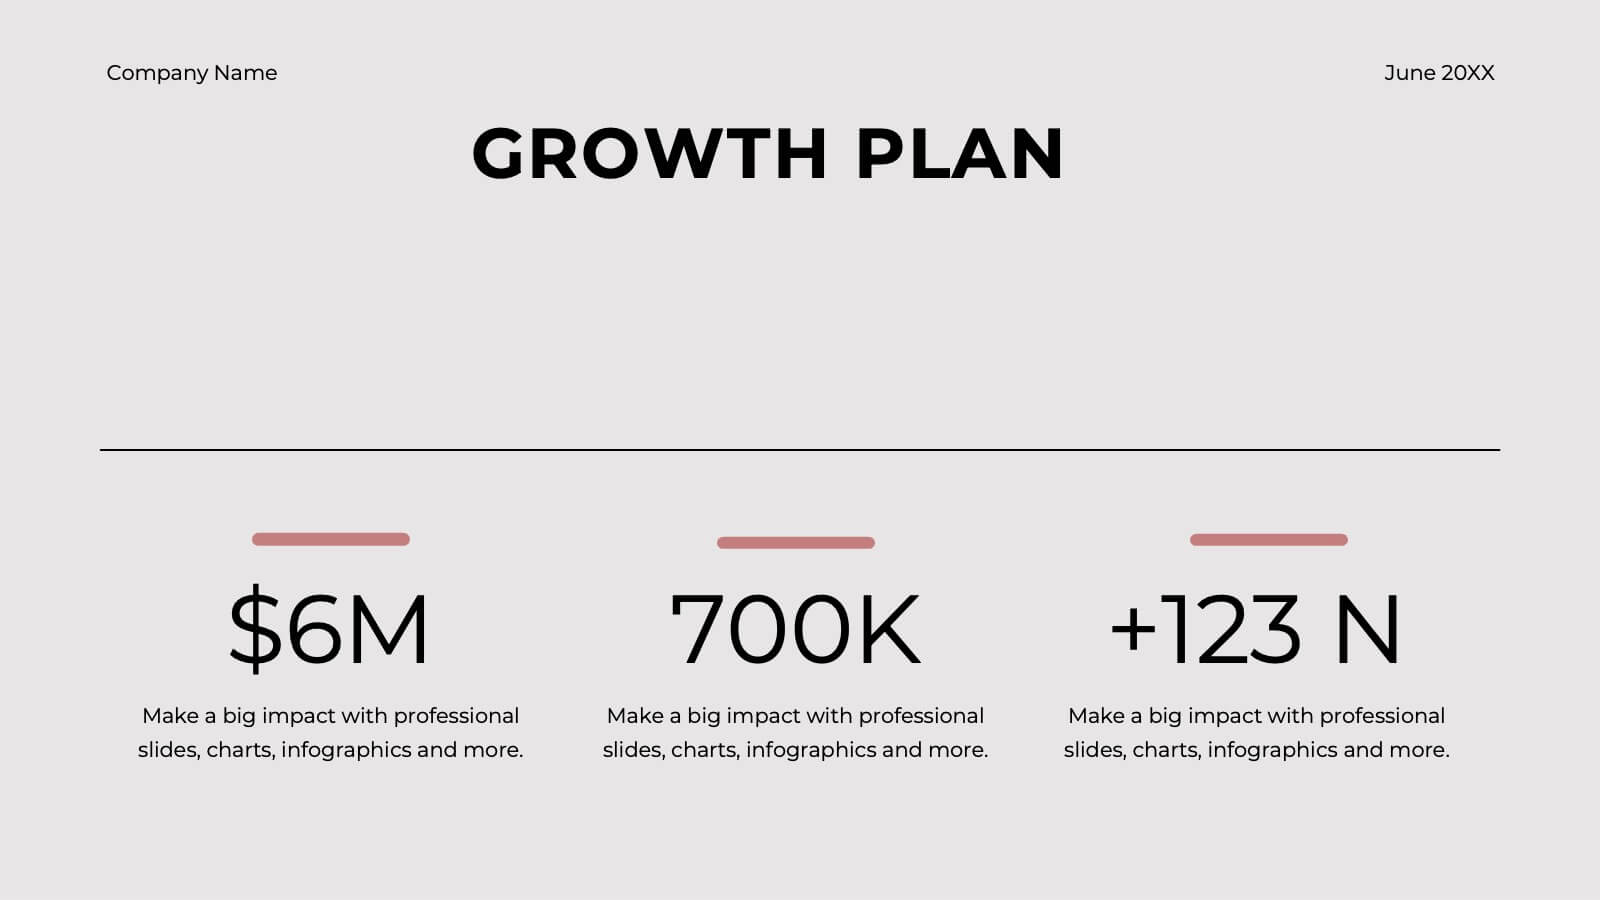
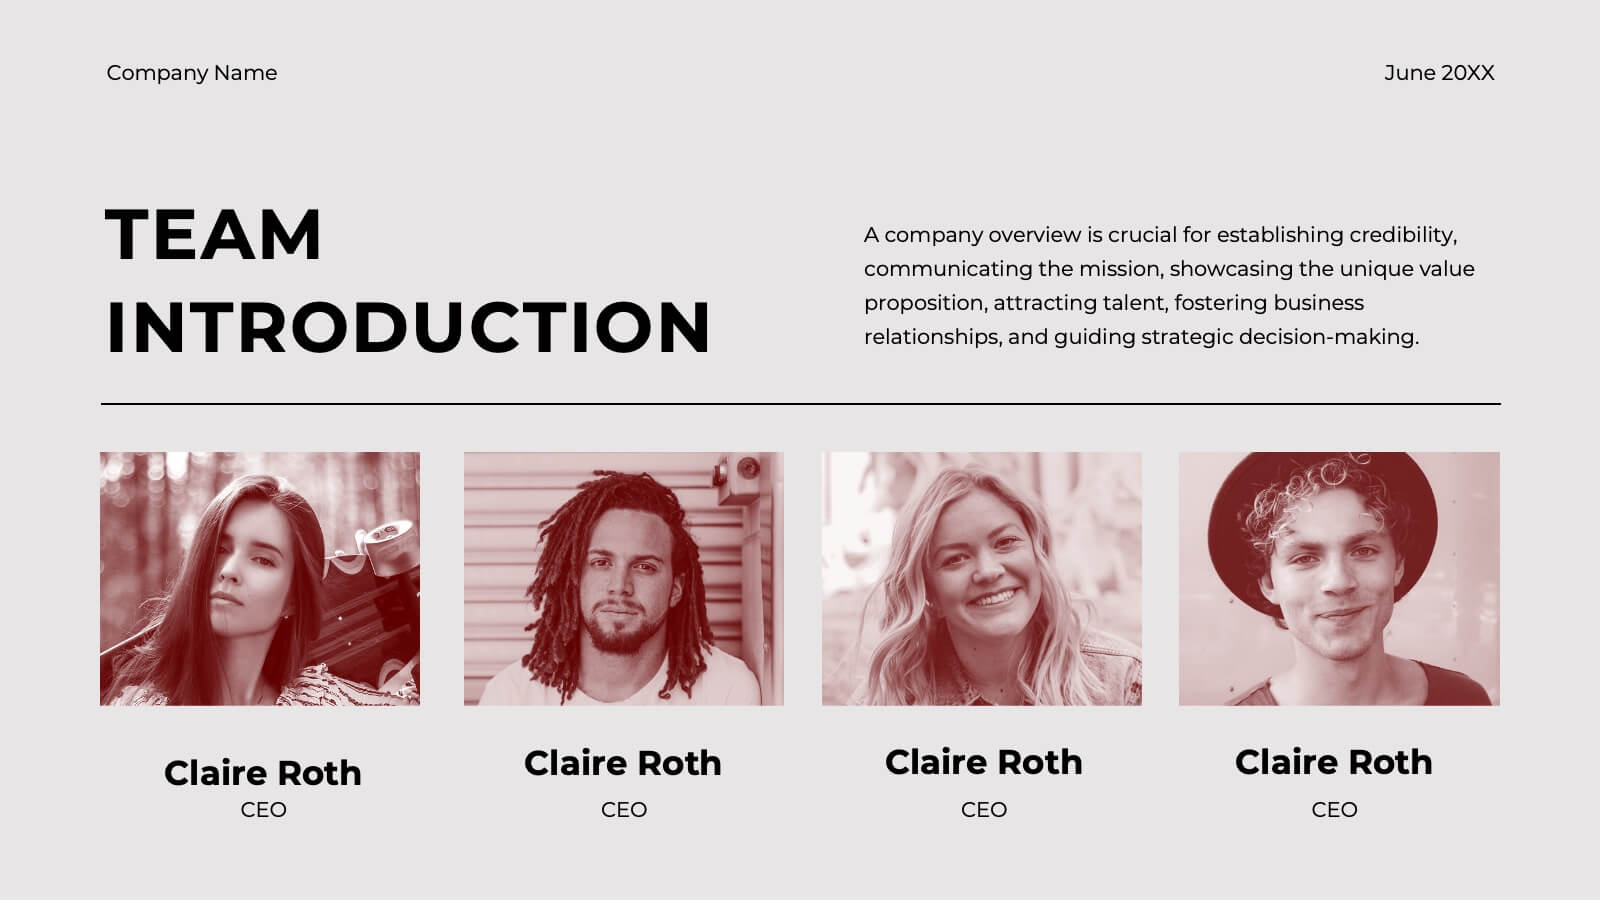
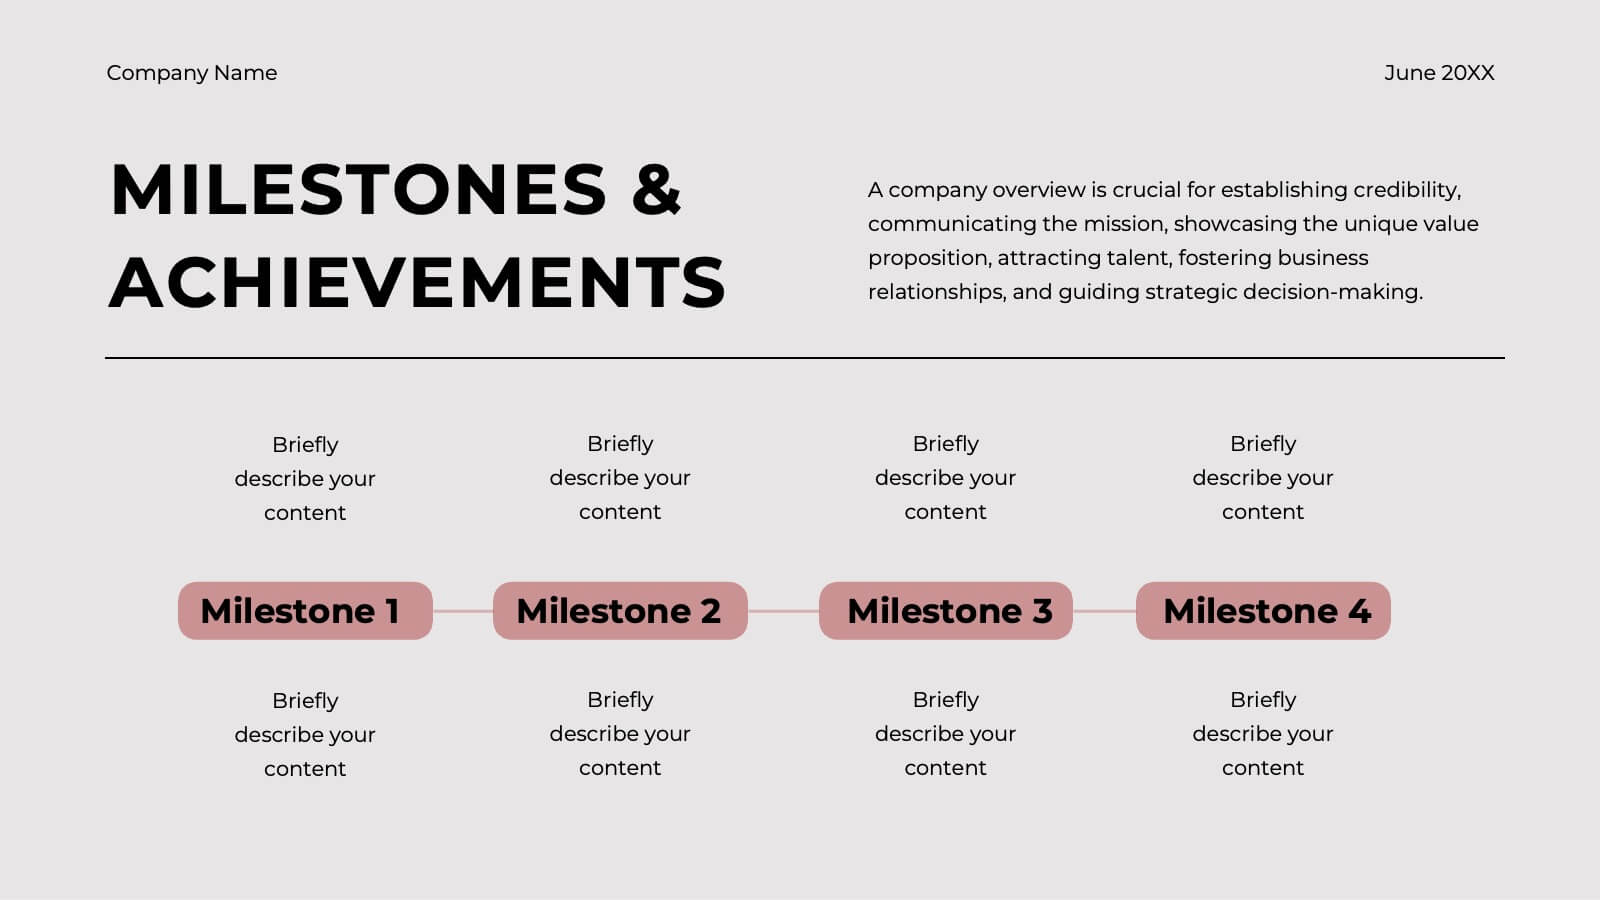
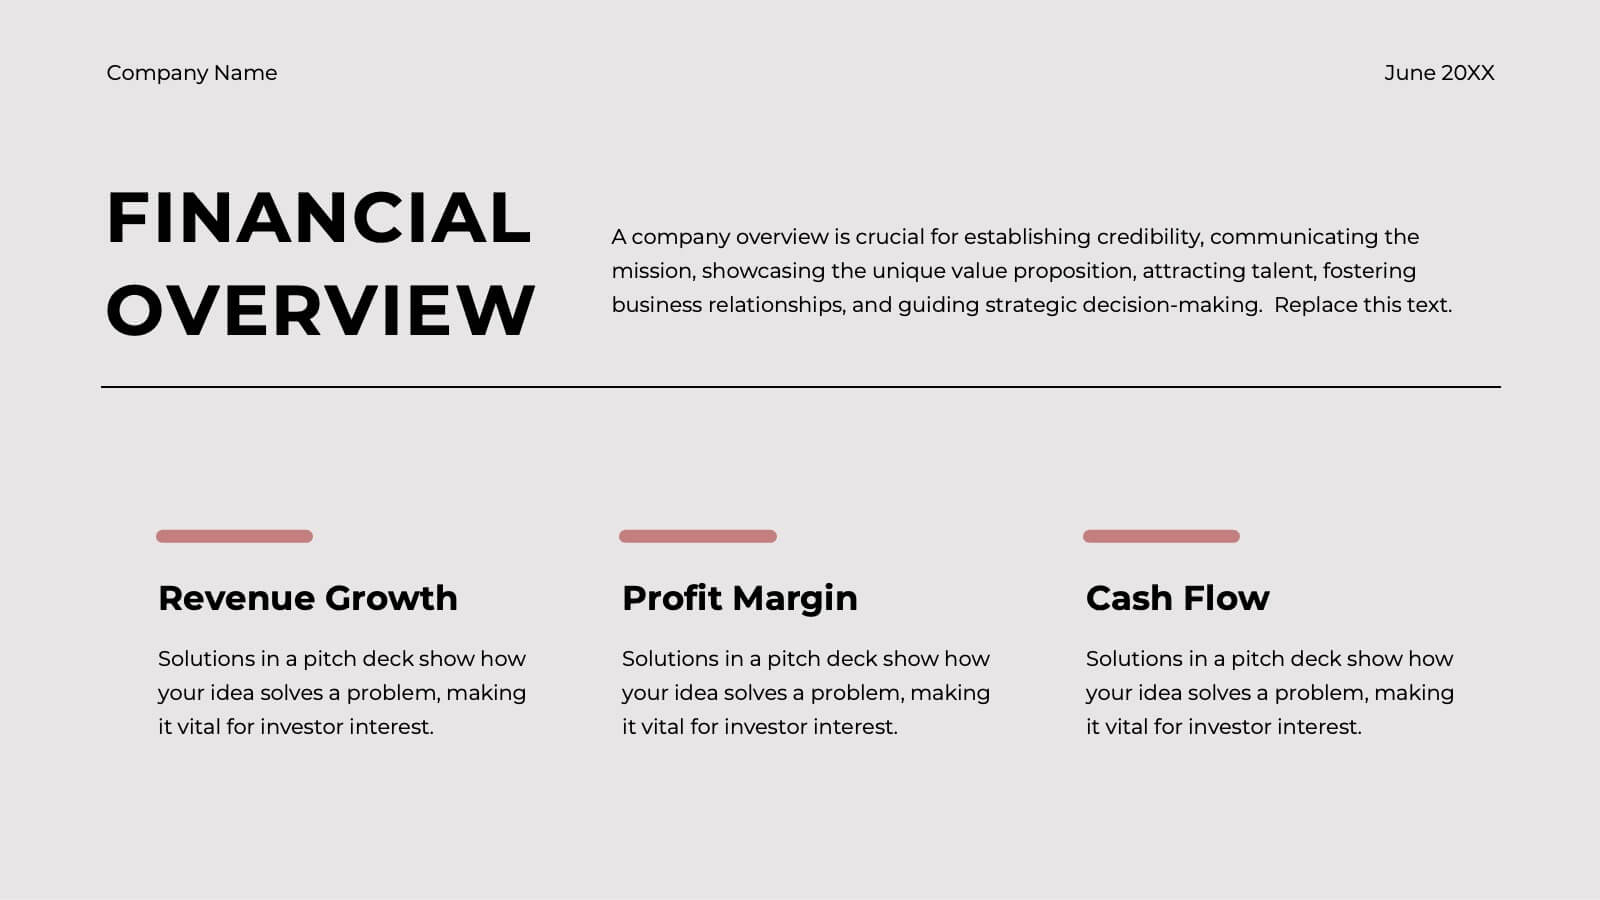
Investor Business Plan One-Pager Presentation
Present your startup vision with clarity using this Investor Business Plan One-Pager. Designed to outline key milestones, growth projections, and funding goals, it’s perfect for pitch decks and investor briefs. Visually dynamic and fully customizable, this one-slide format works seamlessly in PowerPoint, Keynote, and Google Slides—ideal for entrepreneurs and startups.


5 slides
RACI Role Assignment Matrix Overview Presentation
Clarify team responsibilities with the RACI Role Assignment Matrix Overview Presentation. This professional template helps define who is Responsible, Accountable, Consulted, and Informed across key project tasks. Perfect for streamlining communication, reducing overlap, and improving accountability. Fully editable in PowerPoint, Canva, and Google Slides.


21 slides
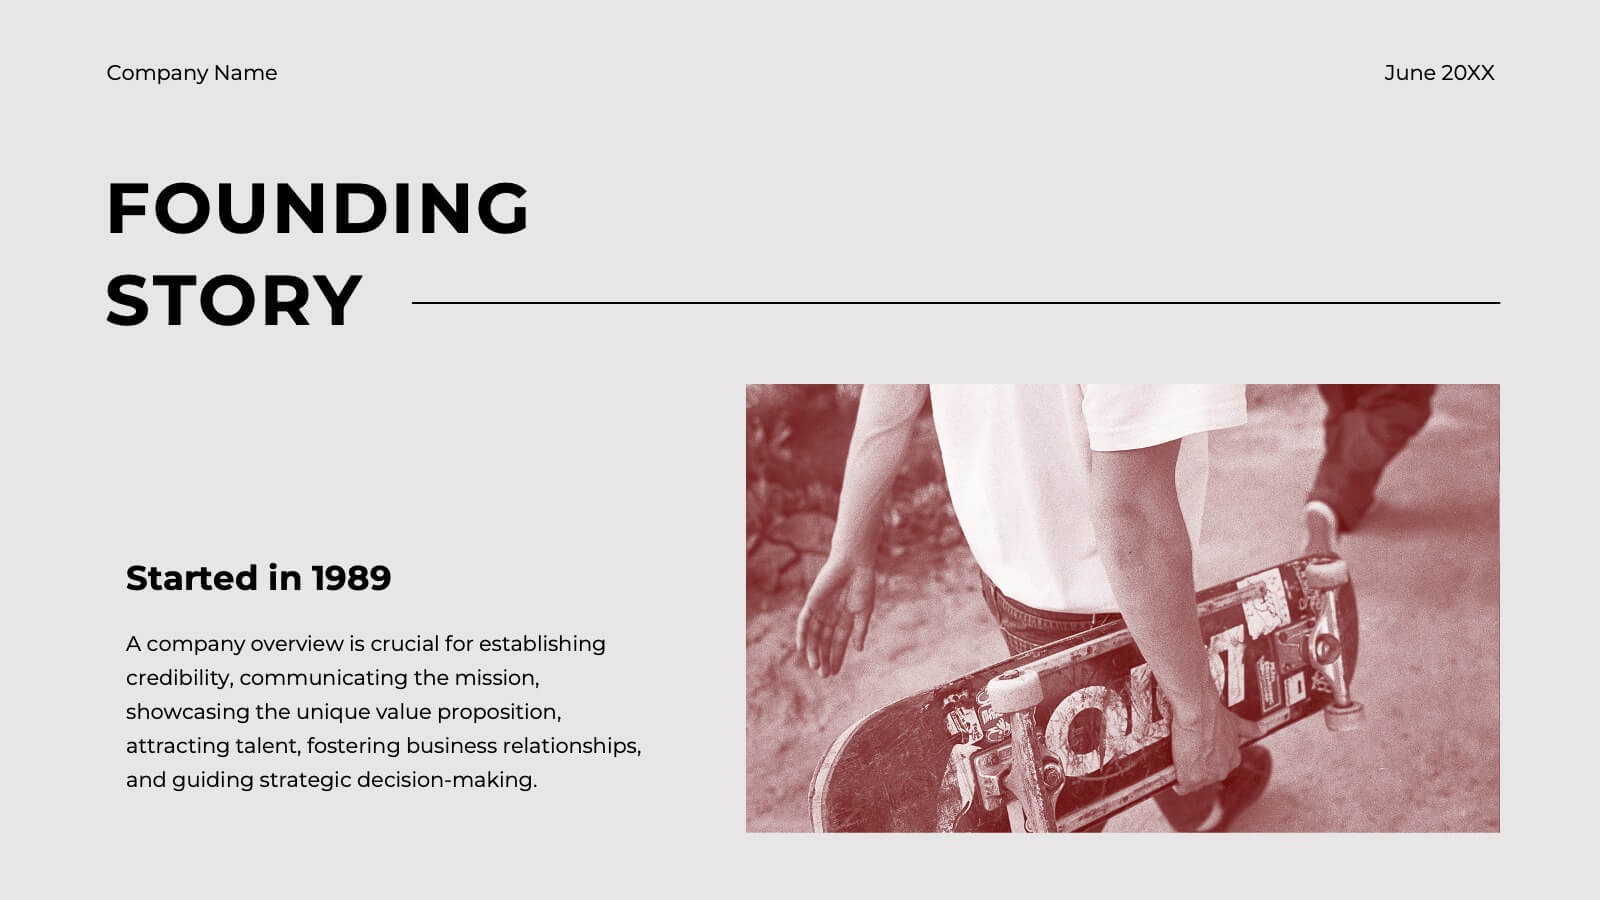
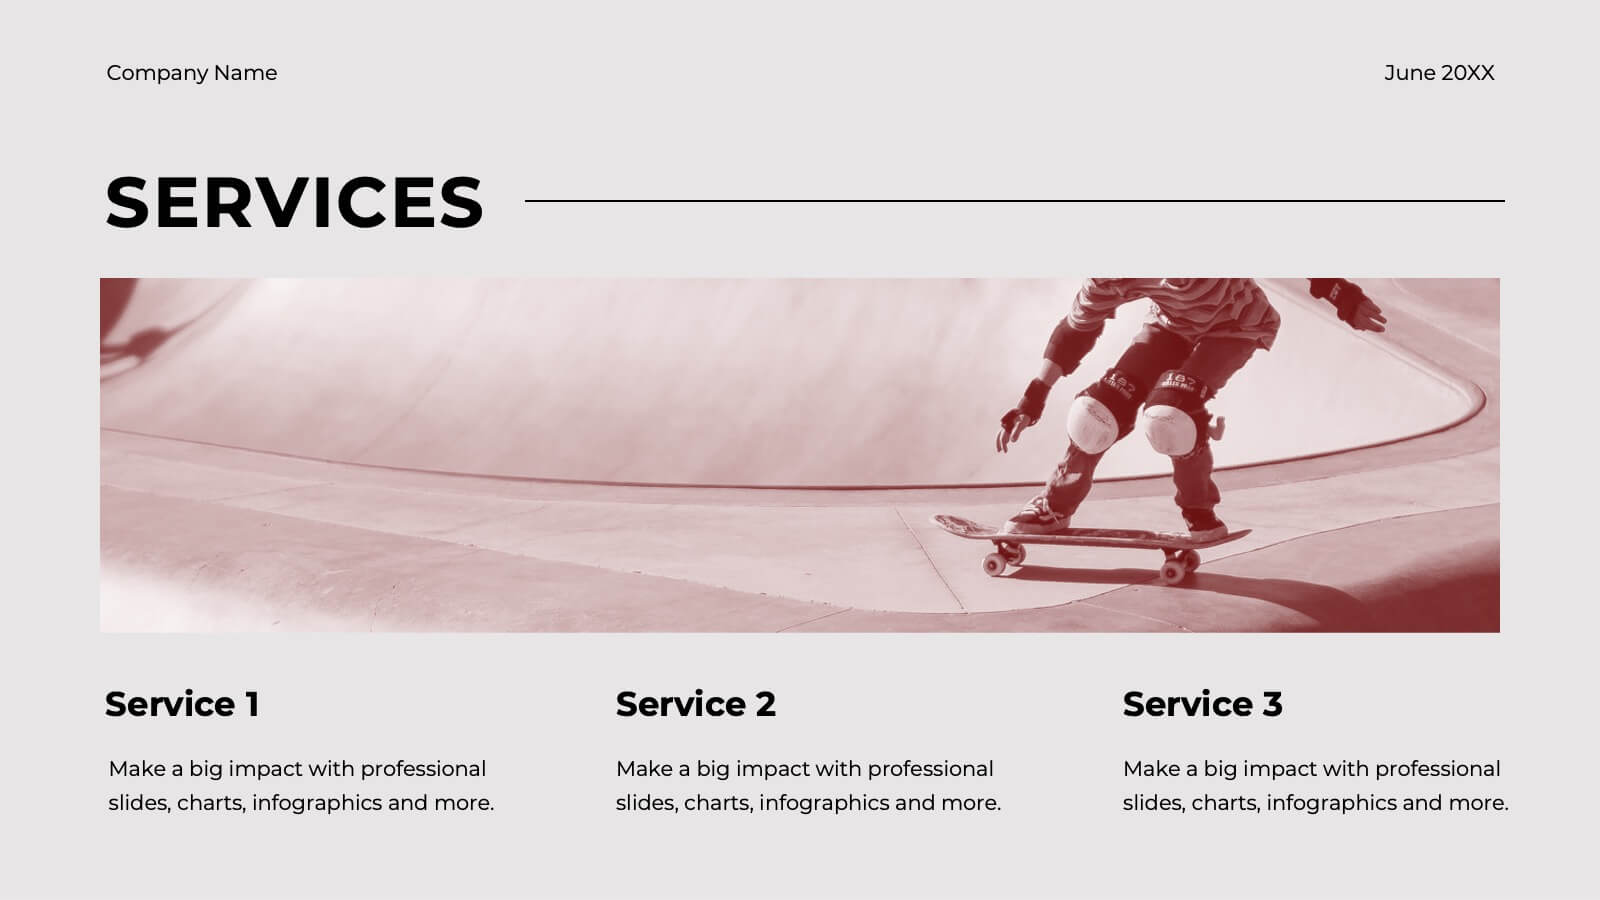
Ember Startup Growth Plan Presentation
Launch your entrepreneurial journey with this dynamic startup plan template! Perfect for detailing your mission, market strategy, and unique value proposition, it features professional slides for customer analysis, business models, and financial projections. Present your innovative ideas clearly and convincingly. Compatible with PowerPoint, Keynote, and Google Slides for seamless presentations on any platform.


7 slides
Timeline Schedule Infographics
A Timeline Schedule is an effective way to communicate complex schedules or timelines. It's a constructive tool for coordinating work and managing projects. This template can help you build a timeline, show the overview and present your value proposition. This timeline Infographic can be used for any business, personal, or academic project. This is a fully editable template so you can change the color, size and everything as per your needs. The timeline charts have been designed with various categories and time range pattern through which you can plan your projects in an effective way!


4 slides
Simple and Effective Steps Presentation
Guide your audience through a seamless workflow with this "Simple and Effective Steps" template. Designed for clarity and impact, this layout breaks down processes into four distinct steps, making it ideal for project planning, decision-making, and strategy execution. Fully customizable and compatible with PowerPoint, Keynote, and Google Slides.


5 slides
CBD Black Market Infographics
Navigate the intricate realities of the cannabis industry with our CBD black market infographics. This essential visual resource, marked by its striking use of pink, orange, and purple hues. It's a tool for law enforcement agencies, legal consultants, and market researchers who are tracking or presenting on the unauthorized distribution within the cannabis industry. The template doesn't just illustrate statistics; it educates on the precautions and market dynamics overshadowed by the black market's presence. Featuring compelling graphics, relevant icons, these infographics synthesize data into more digestible content, aiding in informed decision-making and public awareness campaigns.


6 slides
Problem Solving and Innovation Solution Presentation
Unlock creative thinking with the Problem Solving and Innovation Solution Presentation. This puzzle lightbulb diagram helps visualize key components of innovative strategies—ideal for brainstorming sessions, business development plans, or process improvement meetings. Editable in PowerPoint, Keynote, and Google Slides.