


Features
- 8 Unique slides
- Fully editable and easy to edit in Microsoft Powerpoint, Keynote and Google Slides
- 16:9 widescreen layout
- Clean and professional designs
- Export to JPG, PDF or send by email


Do you have any questions?
Recommend


6 slides
Travel Tips Infographic
By following travel tips, you can enhance your travel experience, mitigate potential challenges, and make the most of your adventures. This infographic template is designed to provide travelers with essential tips and guidelines for a successful and enjoyable trip. Whether you're planning a vacation, business trip, or backpacking adventure, this infographic offers valuable information to help you make the most out of your travel experience. This template is a valuable tool for enhancing travel experiences and ensuring a smooth and memorable trip. Compatible with Powerpoint, Keynote, and Google Slides.


6 slides
Identifying Market Challenges Presentation
Stay ahead of the competition by breaking down market challenges with this dynamic presentation template! Designed for business strategists, marketers, and analysts, this layout helps you visually structure key obstacles and opportunities. Perfect for market research and competitive analysis. Fully customizable and compatible with PowerPoint, Keynote, and Google Slides.


7 slides
Sales Infographic Presentation Template
A Sales Infographic is a visual representation of data or information related to sales. They can include charts, graphs, and diagrams that show how much money a company has made, how many products they have sold, and what their best-selling products are. This template is perfect for anyone who wants to show off their sale numbers in a fun and easy-to-understand way. This template has colorful pictures and charts that make it easy to see how much you've sold and how well your sales are doing. This template is a perfect way to help a company make decisions and track progress.


4 slides
Team OKRs Alignment Slide Presentation
Bring clarity and collaboration to your team’s goals with a clean, connected layout that visualizes how objectives lead to measurable results. Perfect for aligning departments, tracking progress, or sharing performance updates, this presentation turns strategy into action. Fully compatible with PowerPoint, Keynote, and Google Slides for easy customization.


4 slides
Market Growth Strategy Presentation
Drive business success with this Market Growth Strategy template. Designed for marketers, entrepreneurs, and business analysts, this slide features a step-by-step financial growth visualization using stacked coin icons and peak markers. Showcase key strategies, revenue projections, and scaling tactics in an engaging, easy-to-follow format. Fully customizable and compatible with PowerPoint, Keynote, and Google Slides.


7 slides
Construction Management Infographic Presentation
A Construction Infographic is a visual representation of data related to the construction industry and processes. This templates uses colorful construction illustrations to presents data, statistics, and other information in a visually appealing way. You can uses this to cover a wide range of topics, including project timelines, budget breakdowns, safety statistics, materials usage, sustainability practices, and more. This infographic uses illustrations, icons, text boxes and other visual elements to help convey your information. This can be easily edited in Powerpoint, Keynote and Google Slides.


5 slides
Business Meeting Agenda and Planning Presentation
Make every meeting count with this clean and professional agenda timeline. Featuring five circular stages connected in a fluid path, this layout is ideal for breaking down meeting objectives, planning steps, or stakeholder discussions. Fully customizable and compatible with PowerPoint, Keynote, and Google Slides.


5 slides
Topic Web Mind Mapping
Visualize your ideas with clarity and structure using the Topic Web Mind Mapping Presentation. Perfect for brainstorming, educational planning, or strategic thinking, this layout helps you centralize a core concept and expand with five supporting branches. Customize easily in PowerPoint, Keynote, or Google Slides to fit any topic or audience.


5 slides
Process Flow Infographics
Streamline your pathway to success with our process flow infographics template. Utilizing a professional gray palette accented with colorful highlights, this creative vertical design is tailored for clarity and impact. Ideal for business strategists and process engineers, this template assists in illustrating step-by-step progressions or workflows in an engaging manner. It's perfect for those who need to communicate processes effectively, ensuring every phase is visually represented and easy to understand. This template comes equipped with innovative graphics, diverse icons, and dedicated spaces for images, making your data presentation a smooth, navigable experience.


6 slides
Industry Analysis with Porter's Forces Presentation
The Industry Analysis with Porter's Forces Presentation offers a clean and strategic layout for visualizing competitive dynamics. This deck illustrates the five forces—Buyers, Suppliers, Competitors, Substitutions, and New Entry—in a semi-circular flow that makes relationships easy to understand. Each force is paired with editable text and icons for clarity. Ideal for market research, business strategy, or consulting work. Fully compatible with PowerPoint, Keynote, and Google Slides.


22 slides
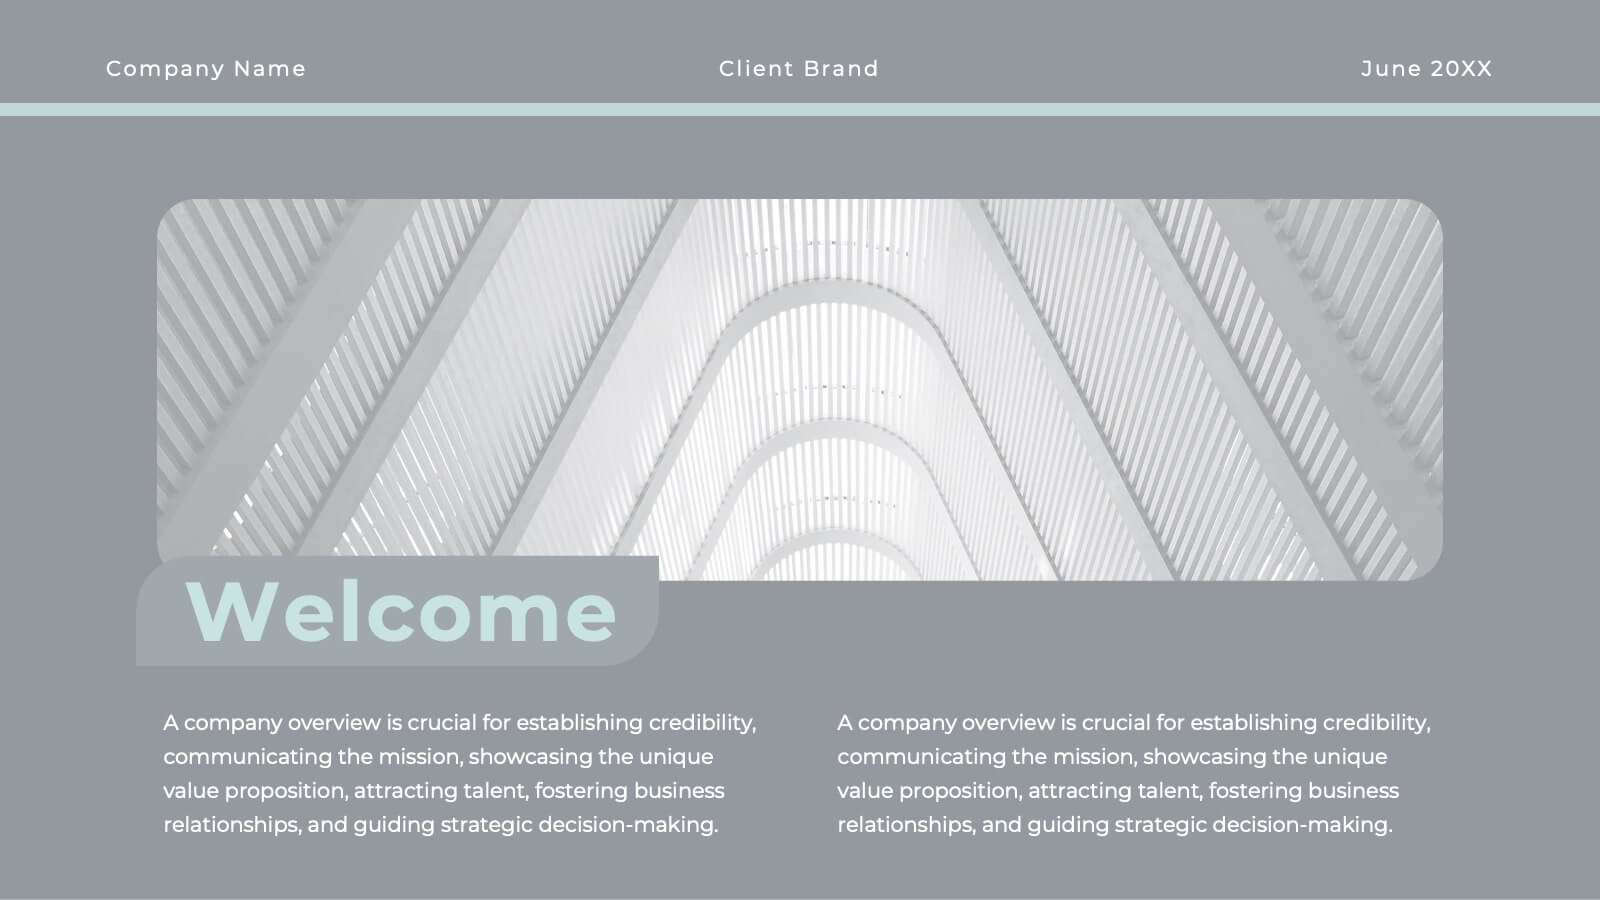
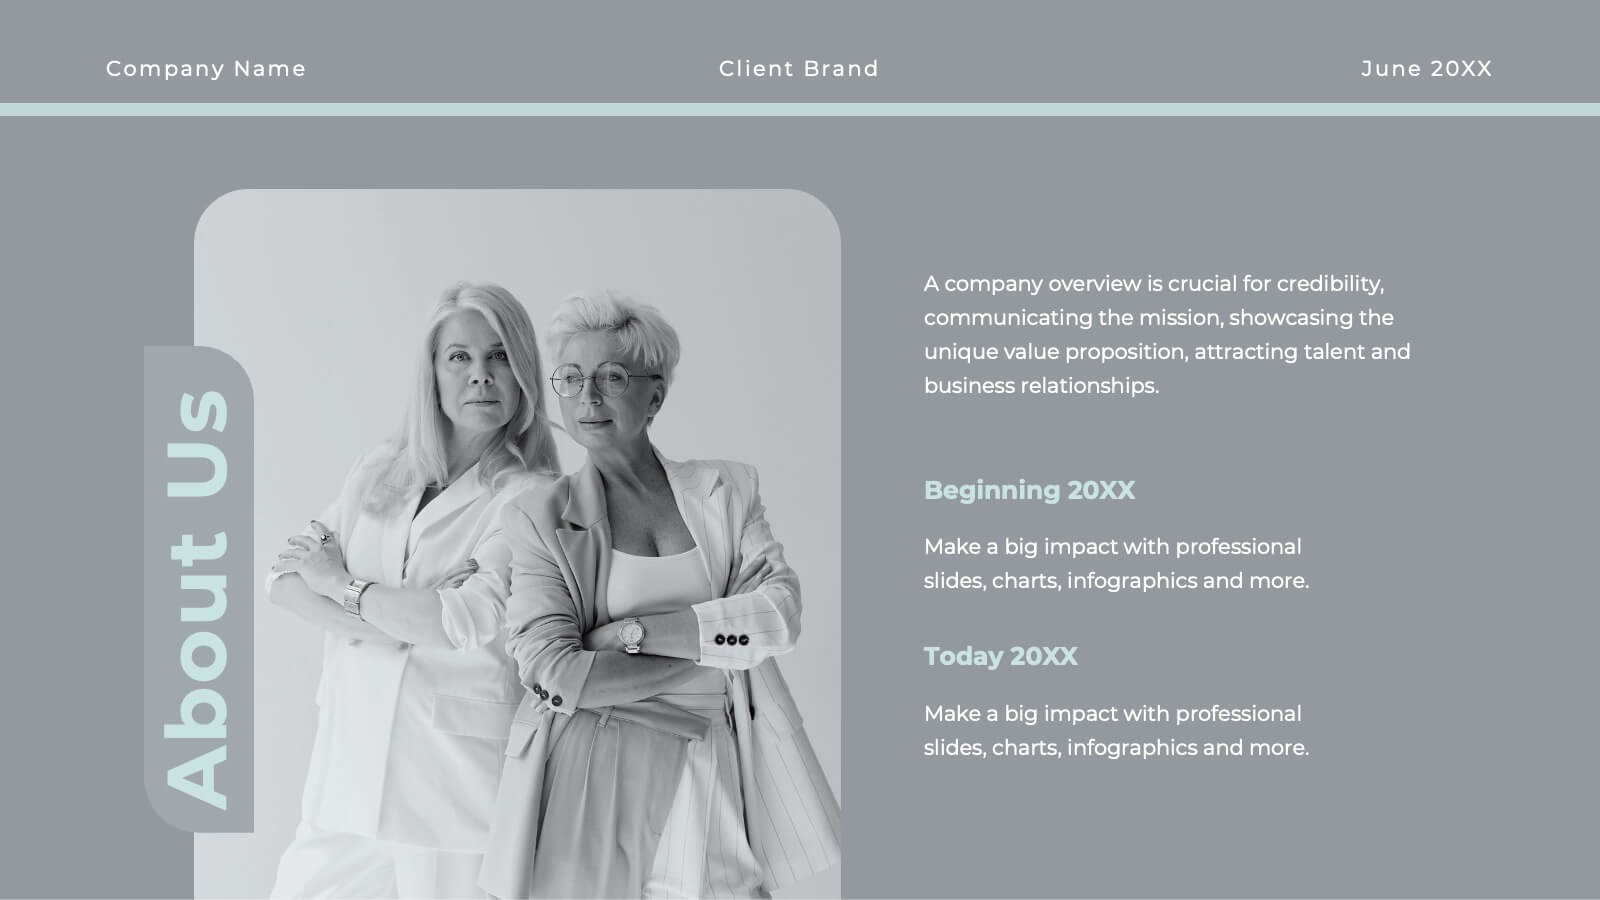
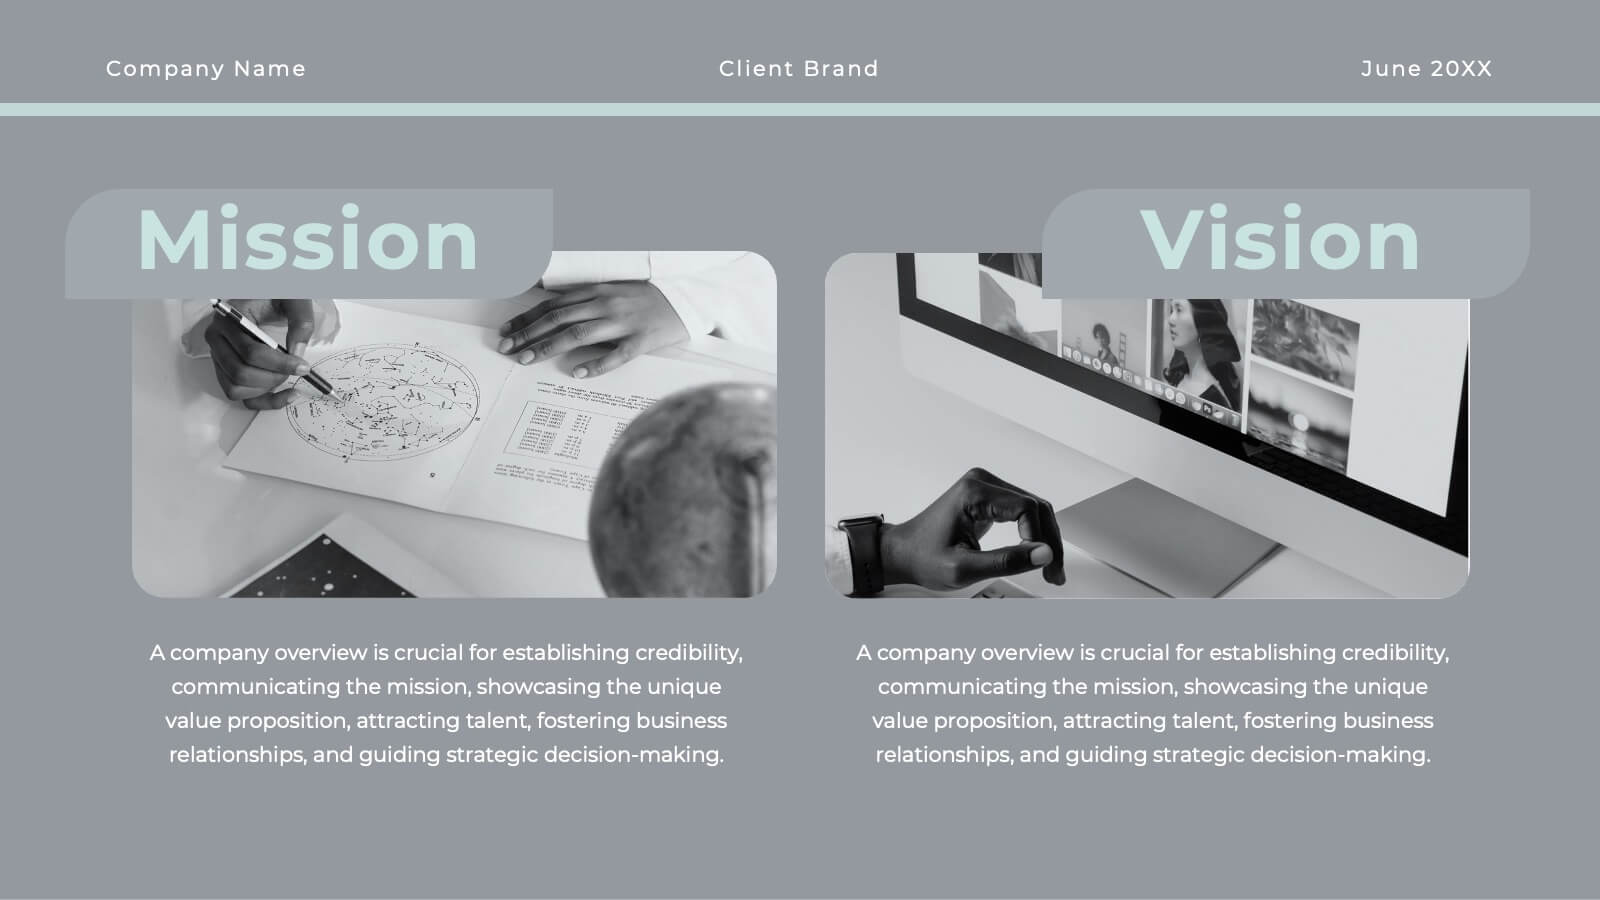
Whirlwind Advertising Agency Proposal Presentation
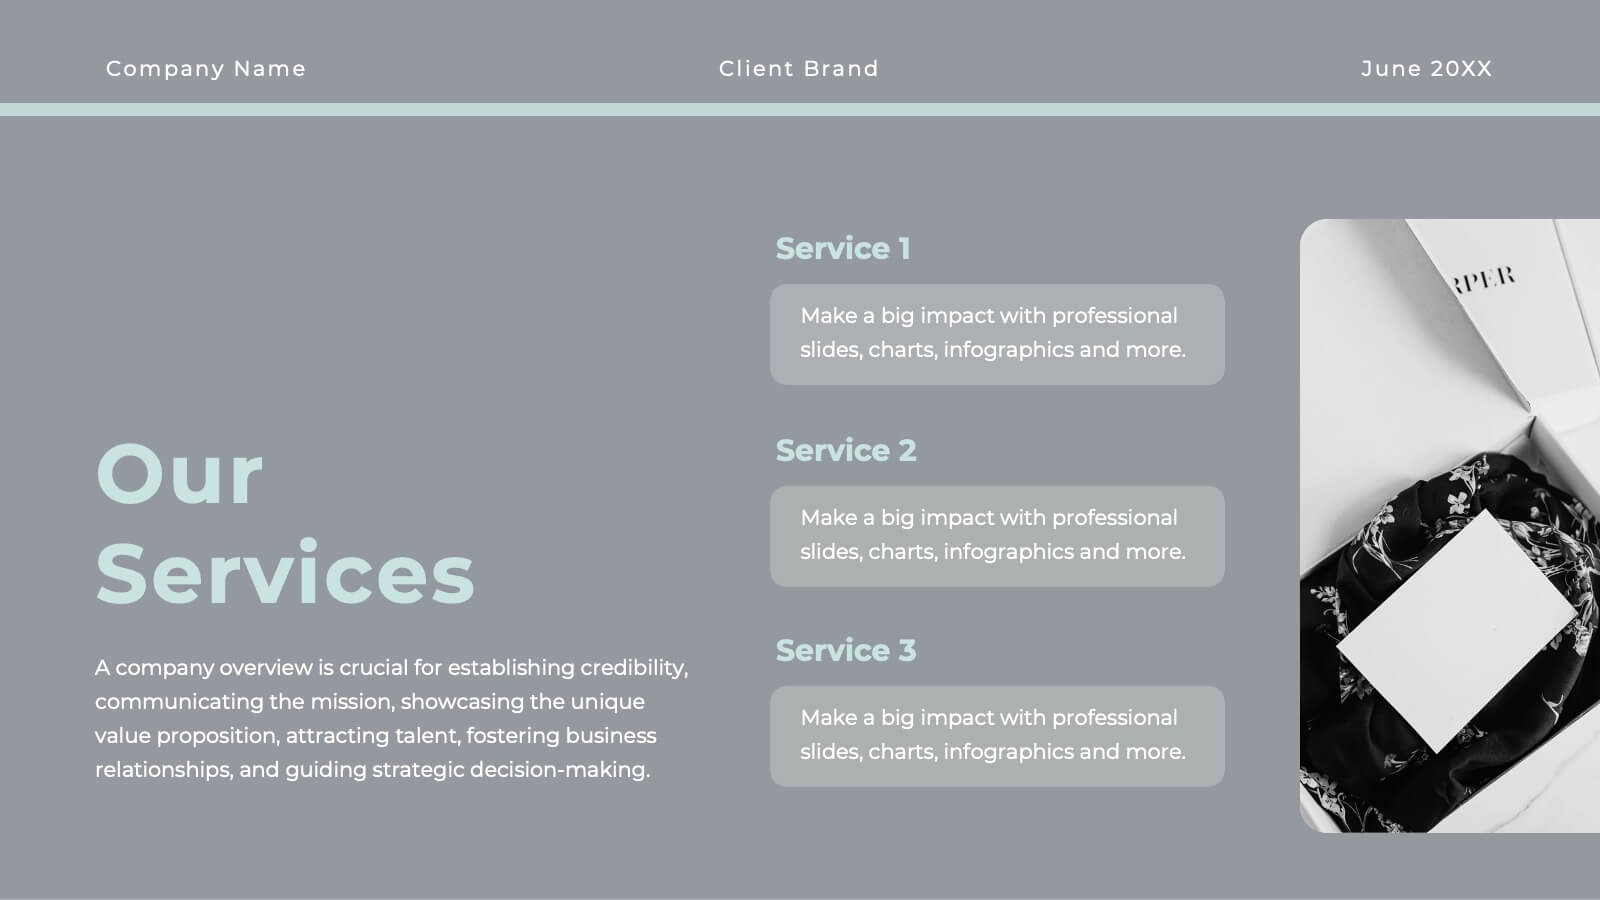
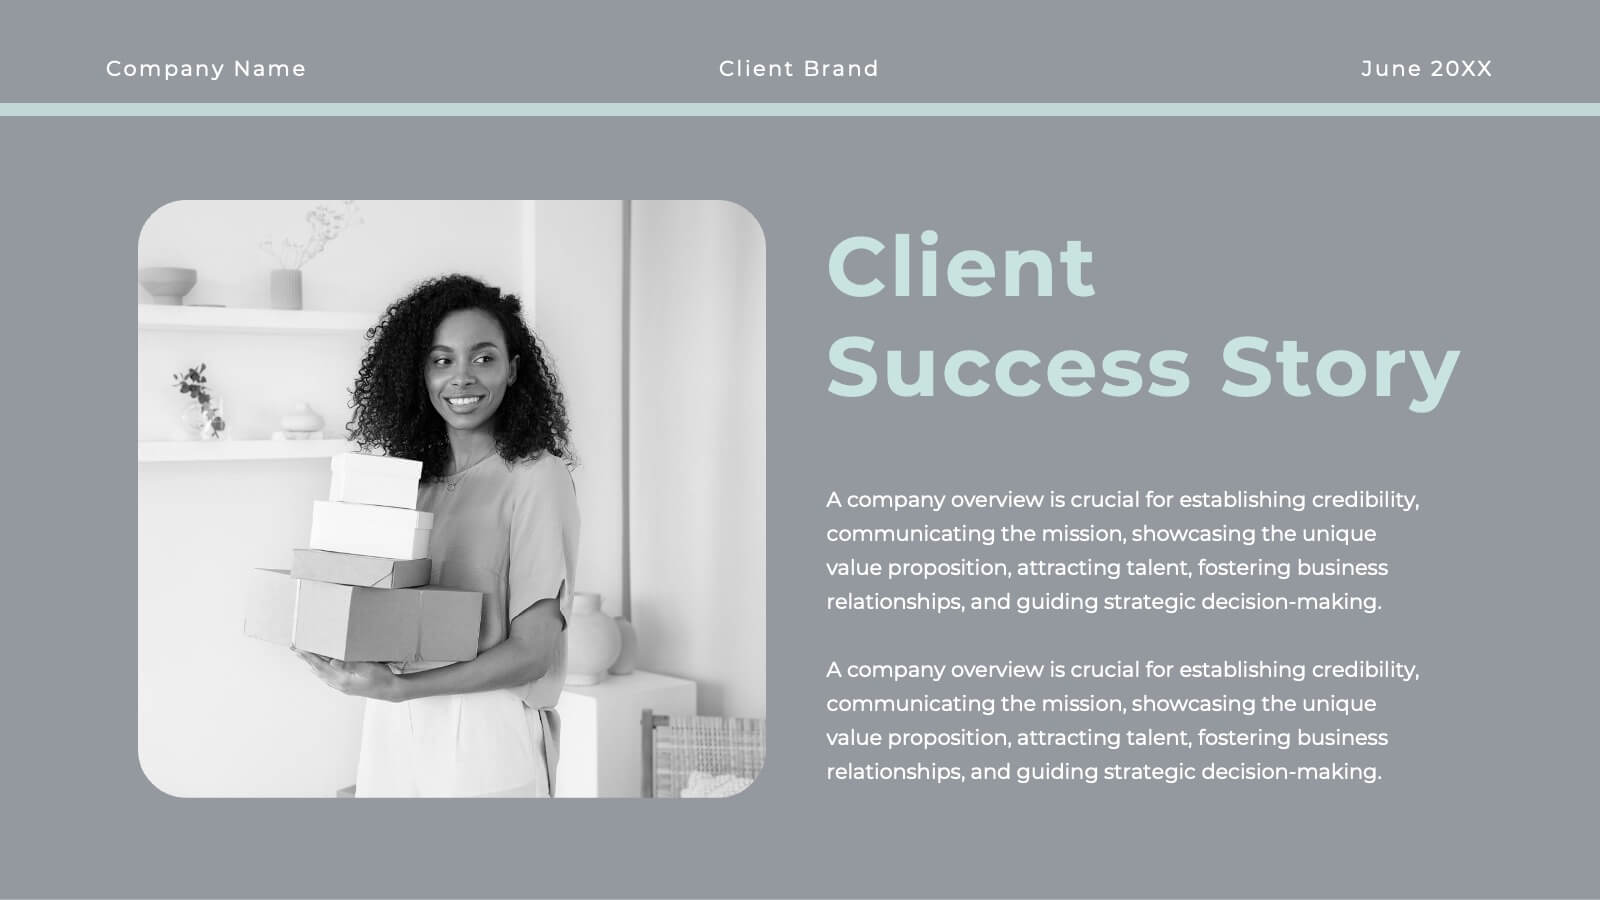
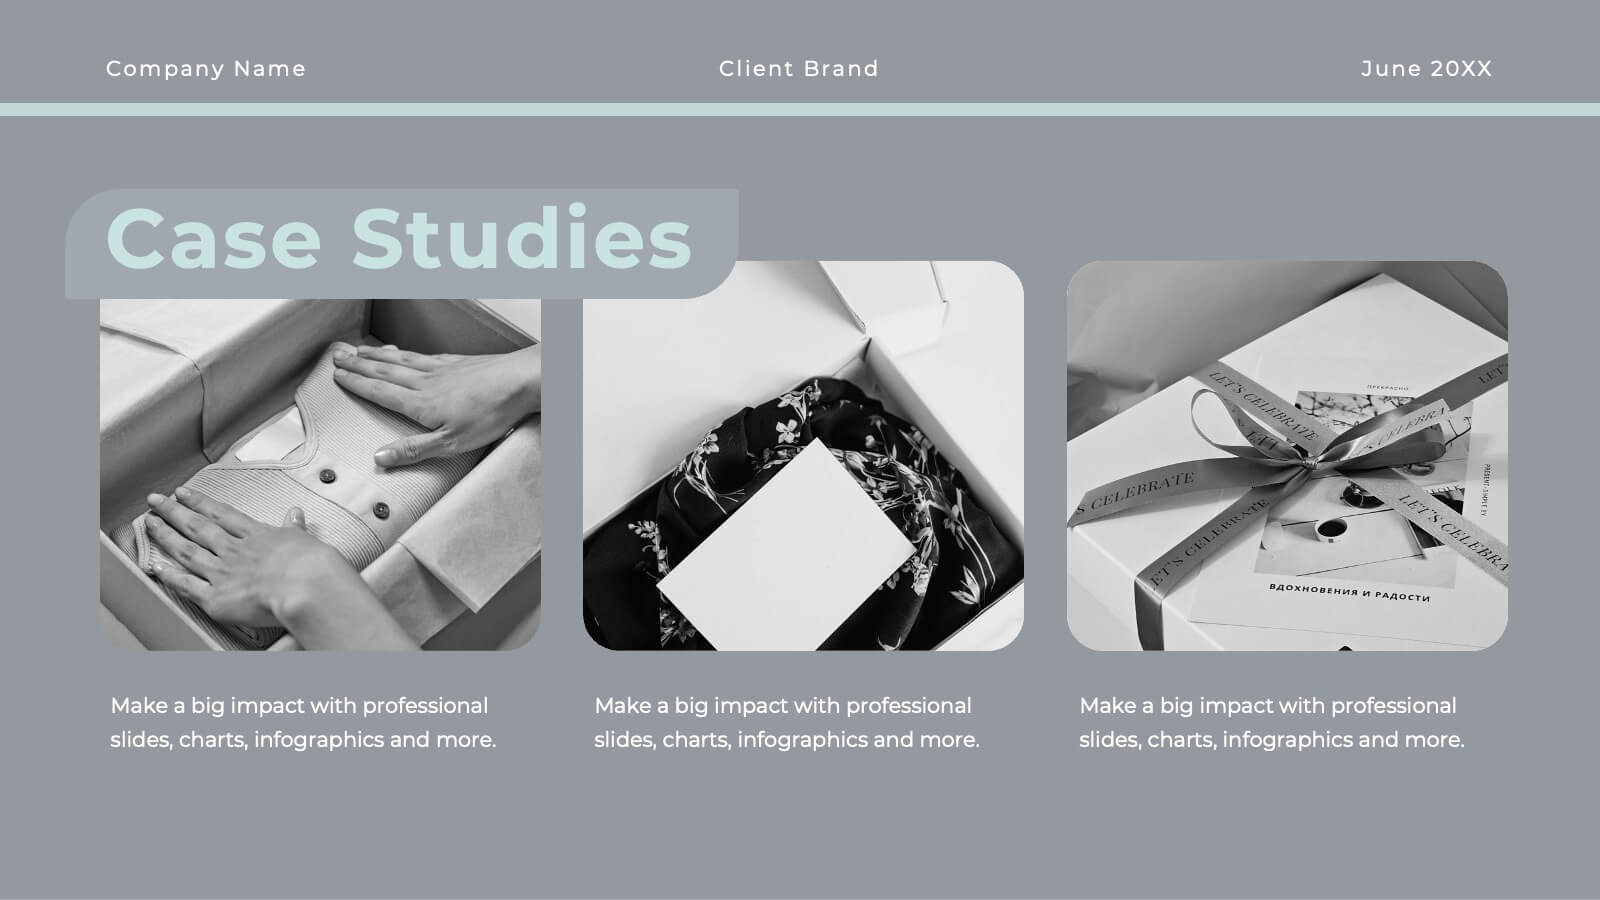
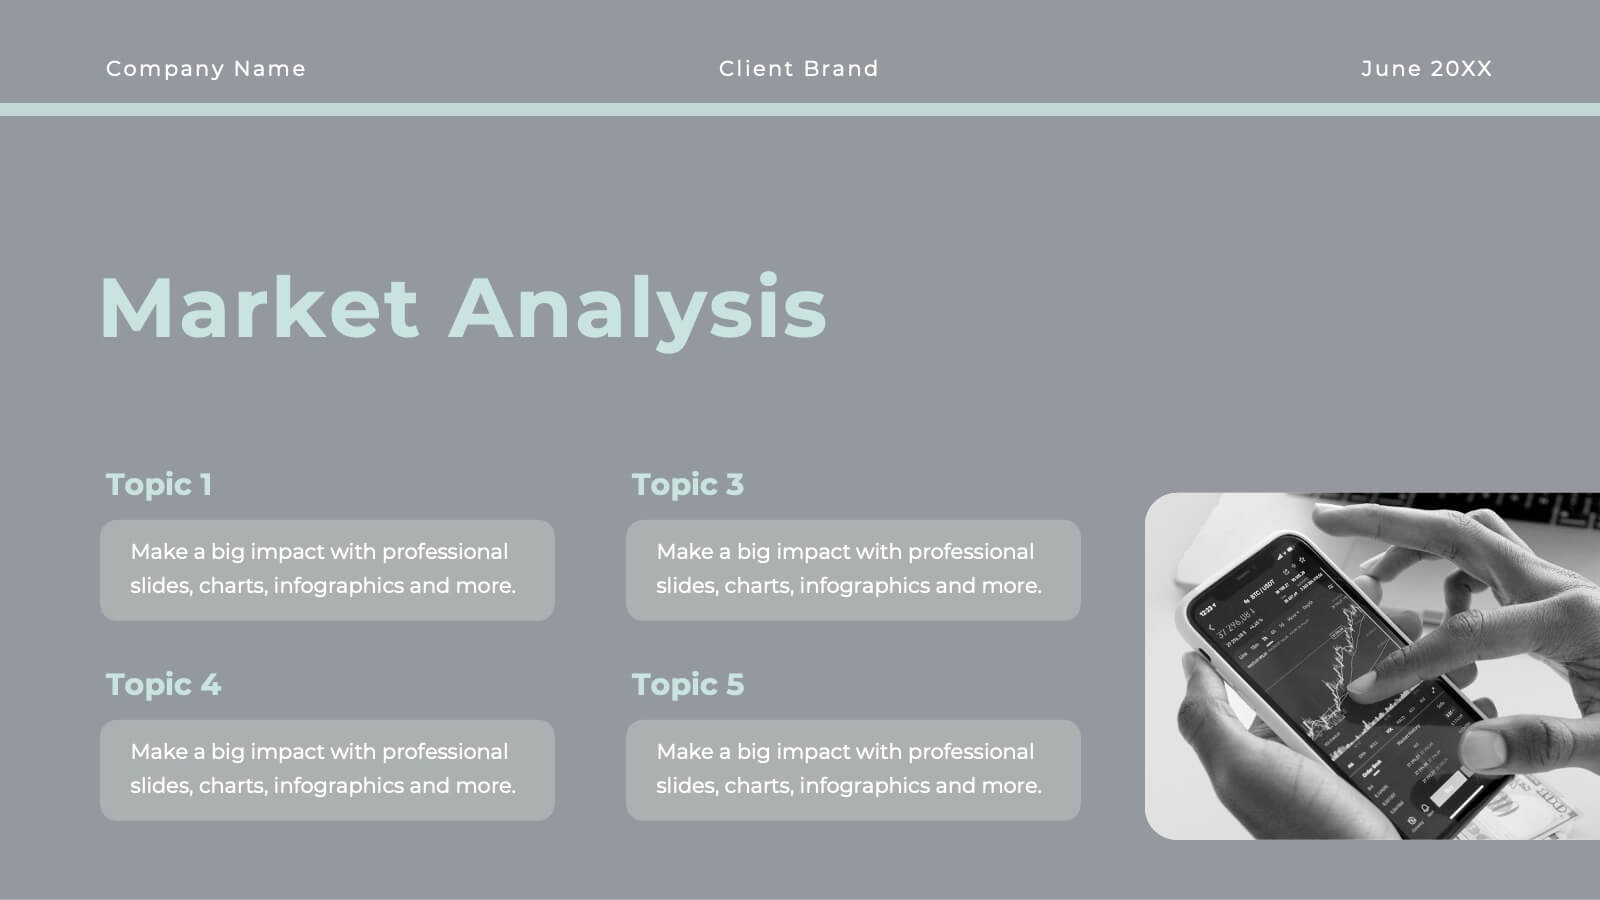
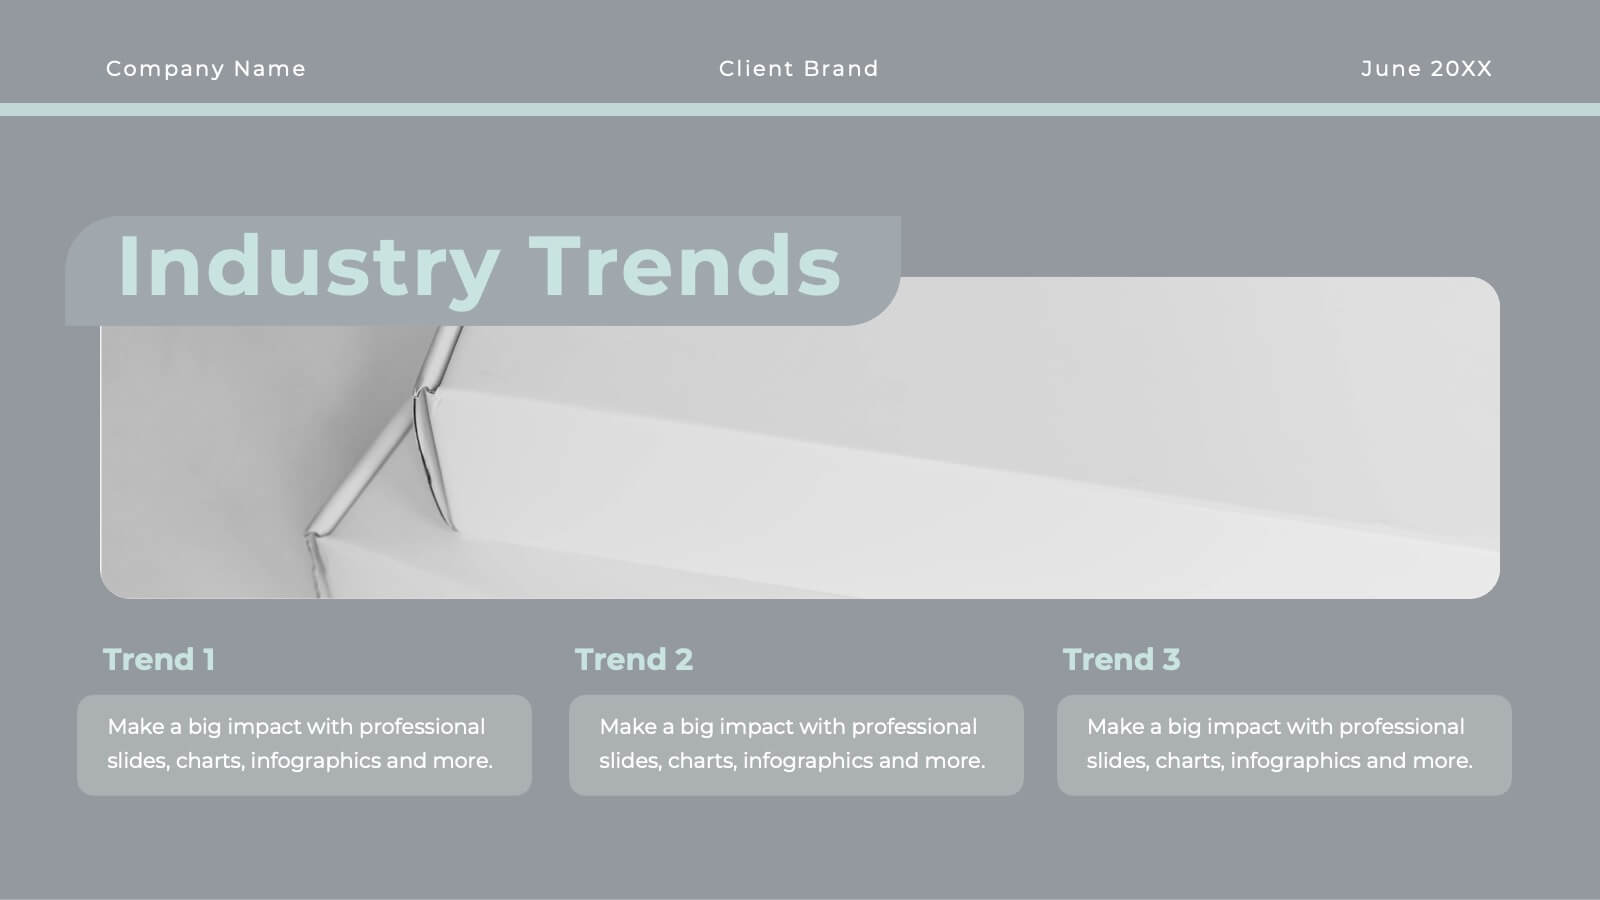
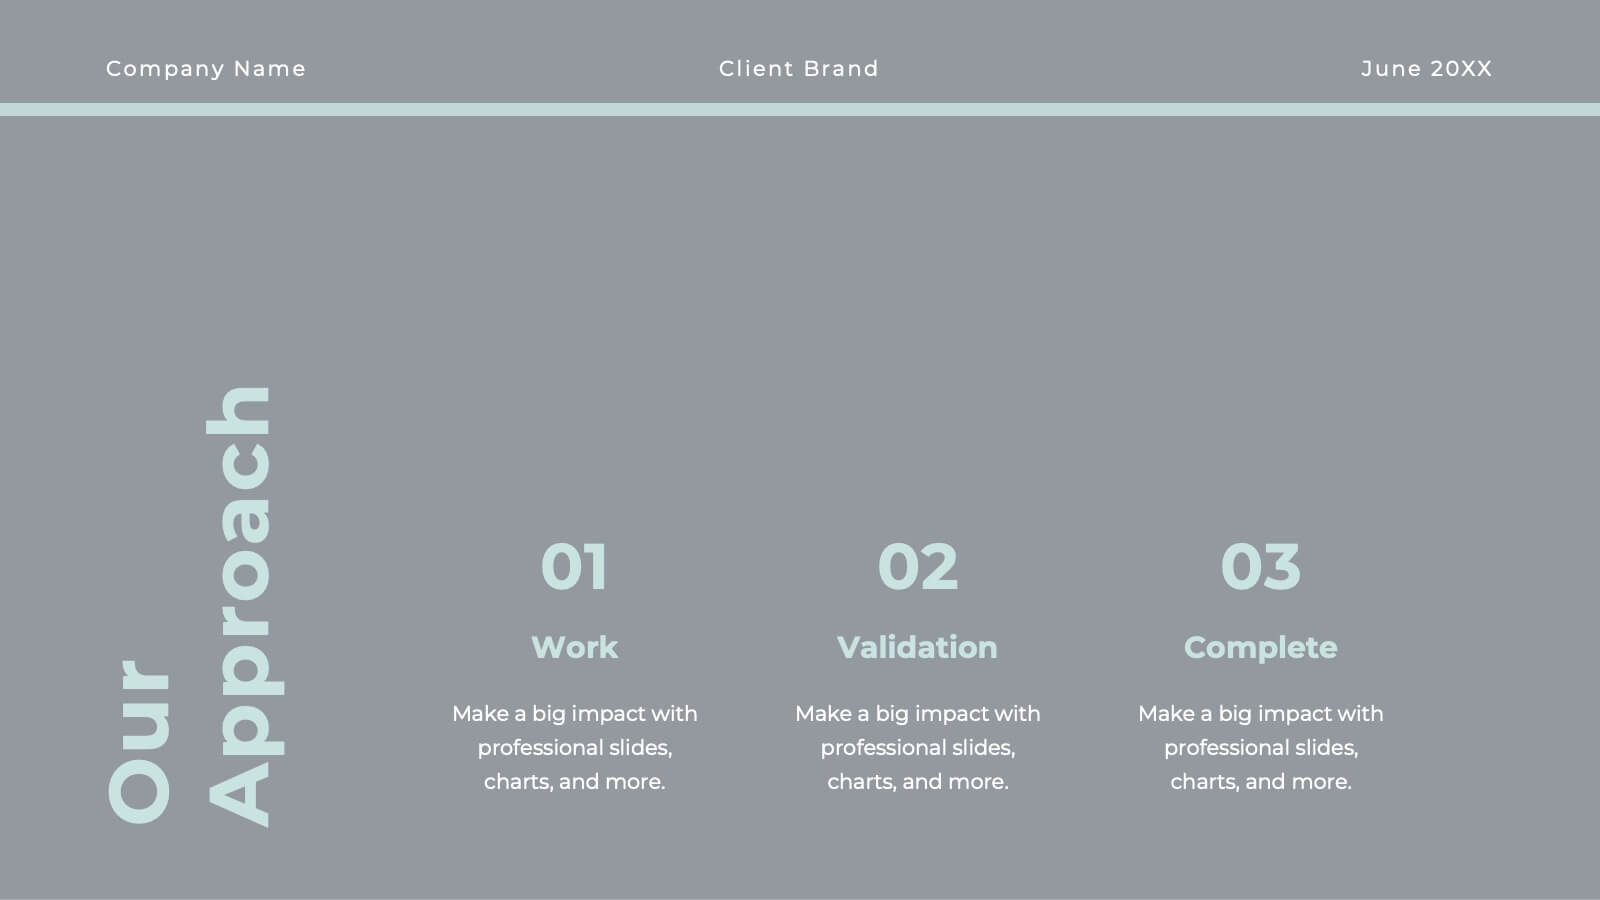
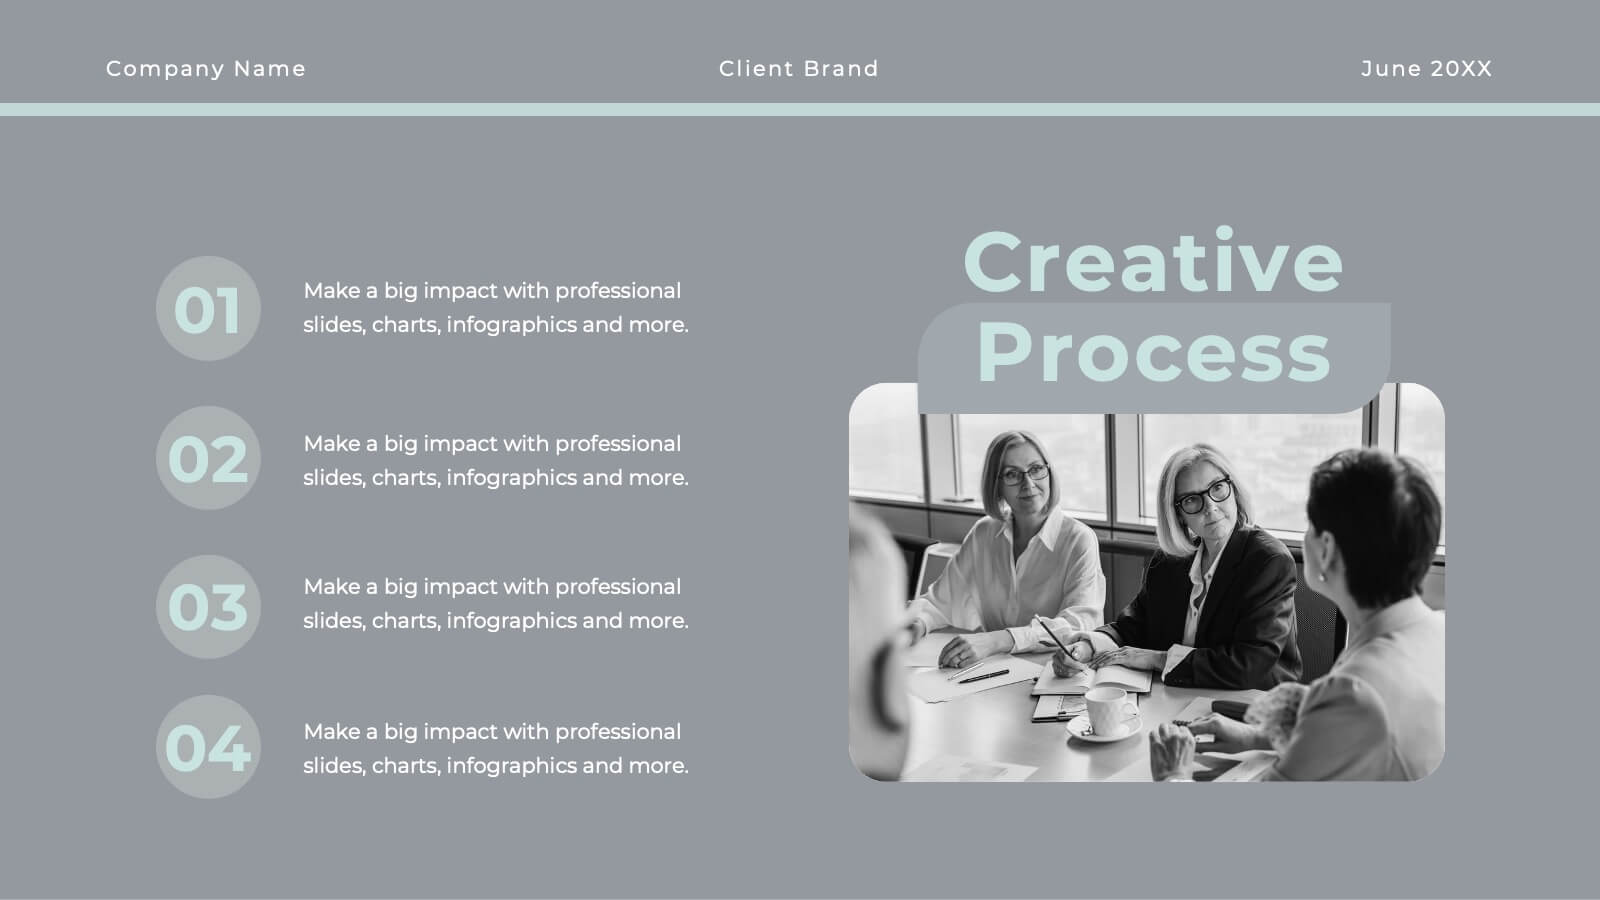
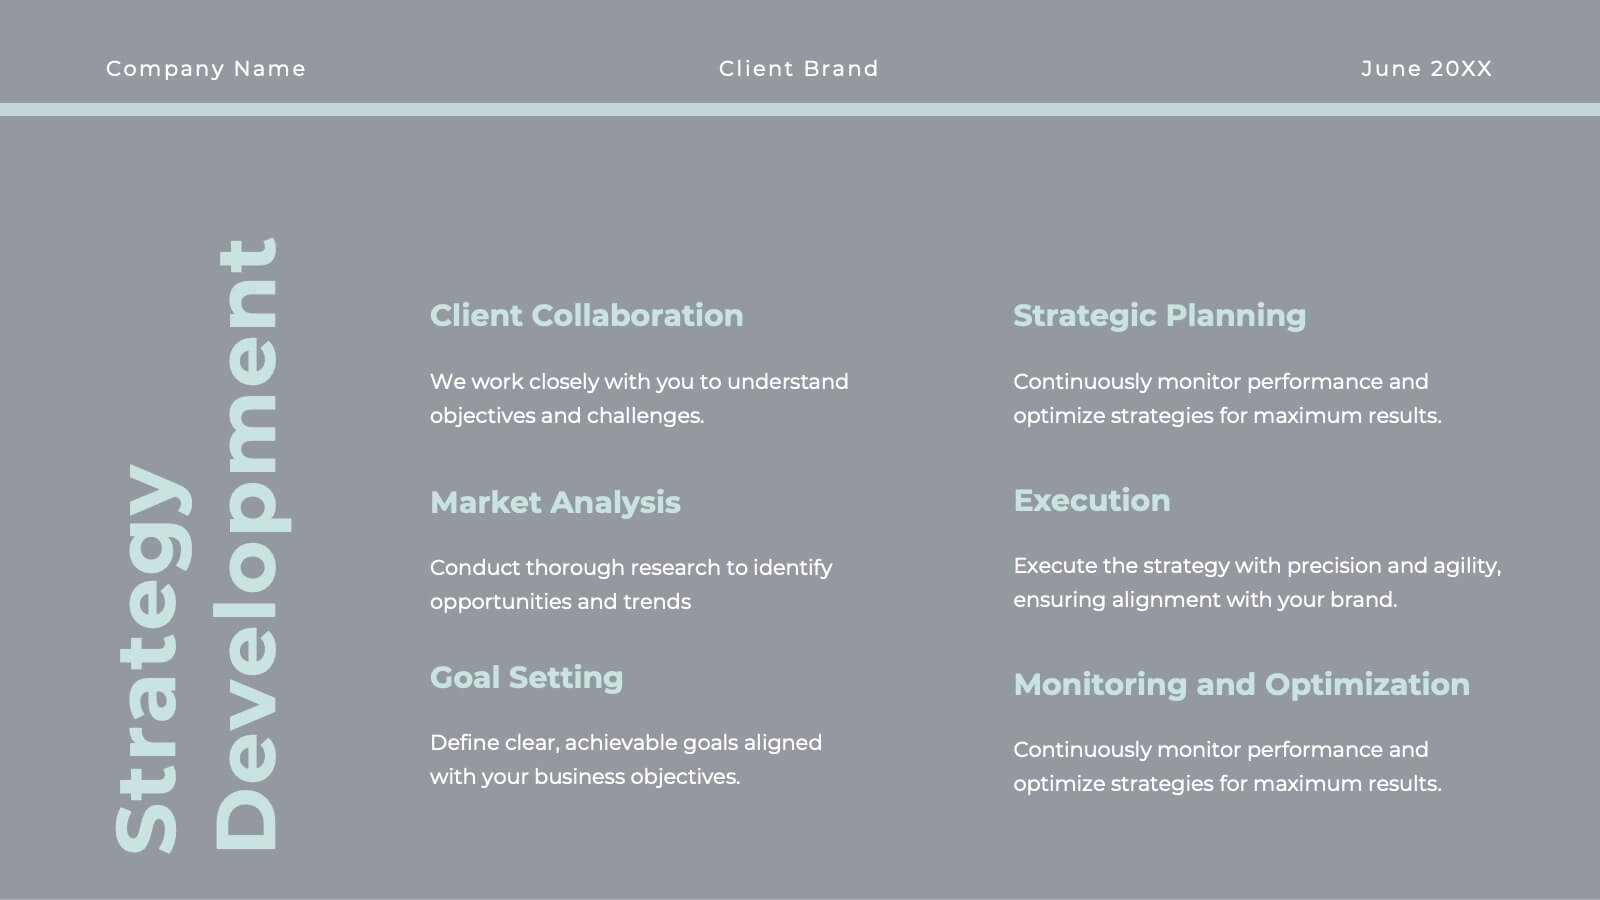
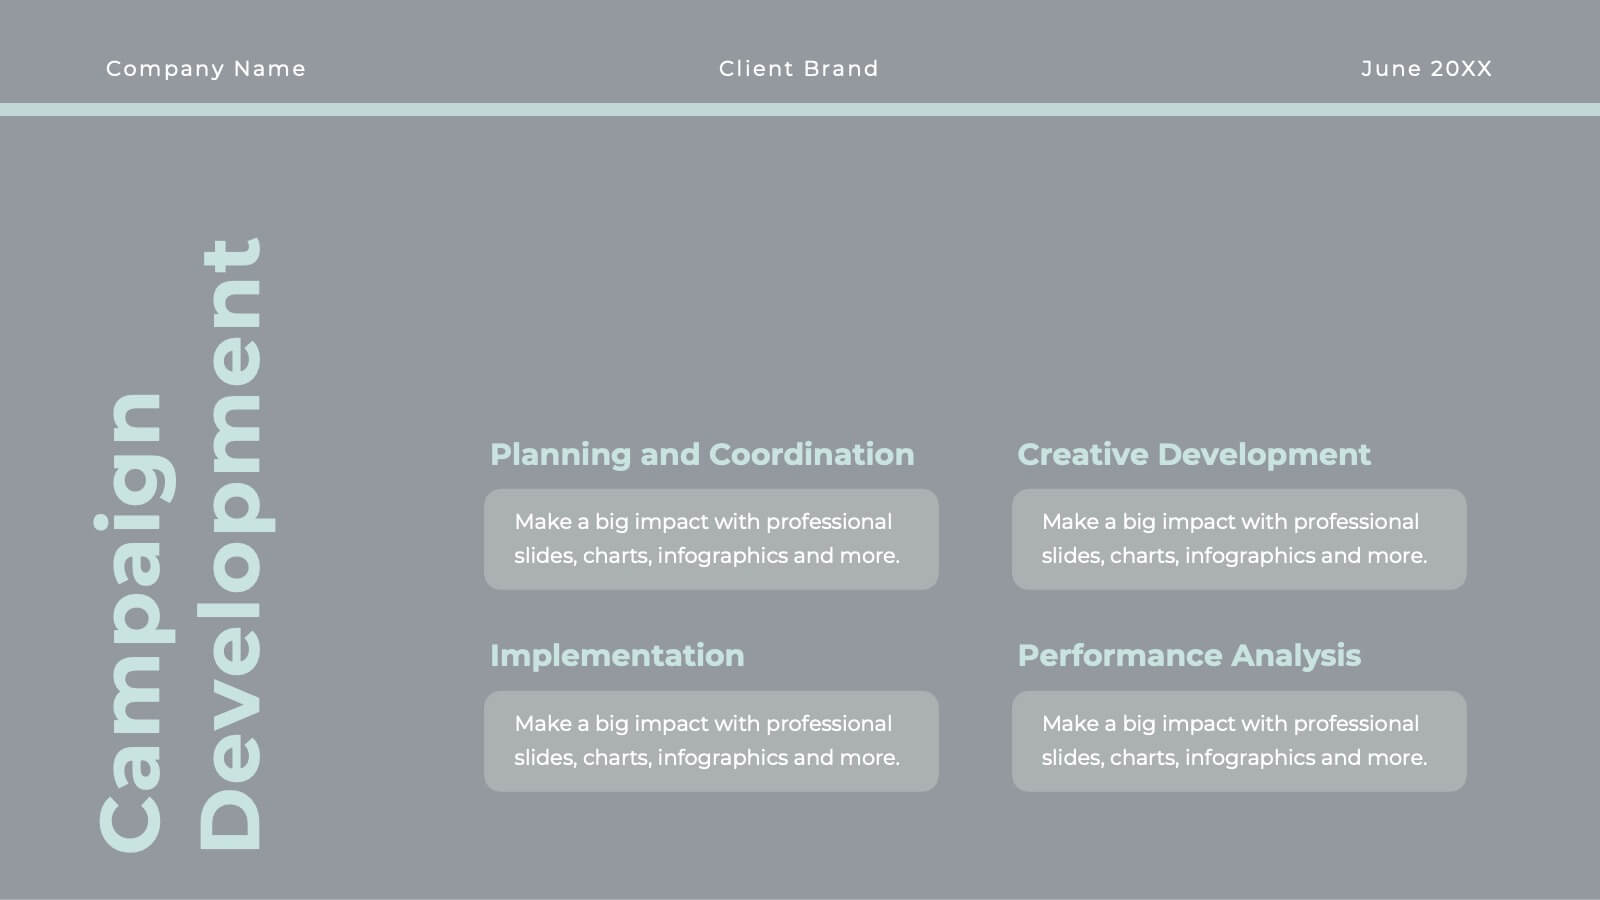
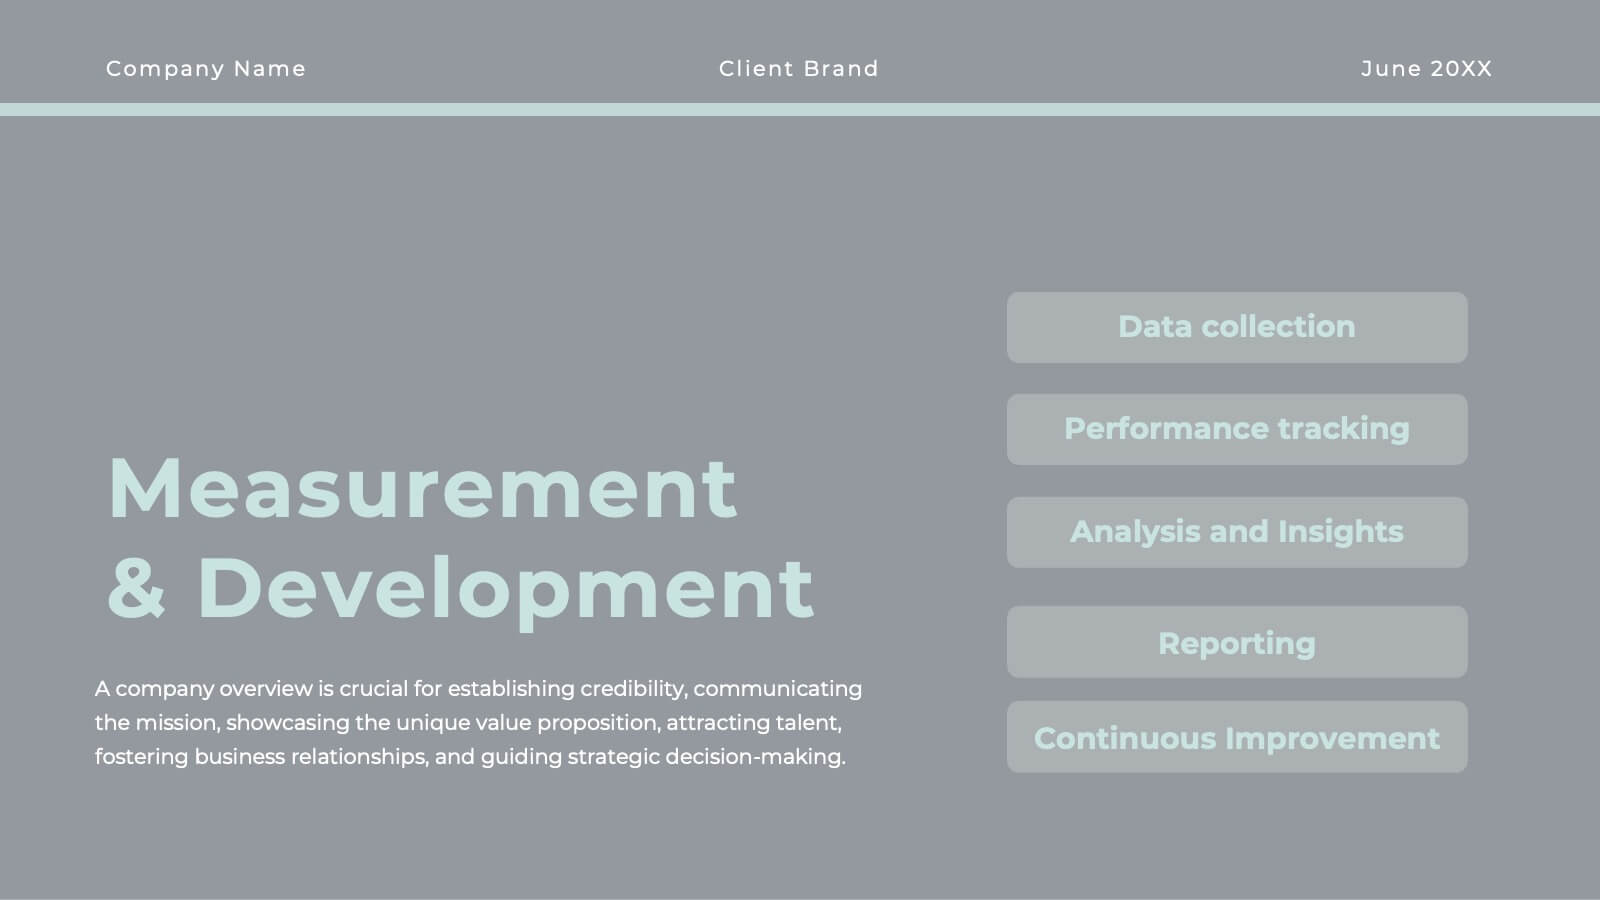
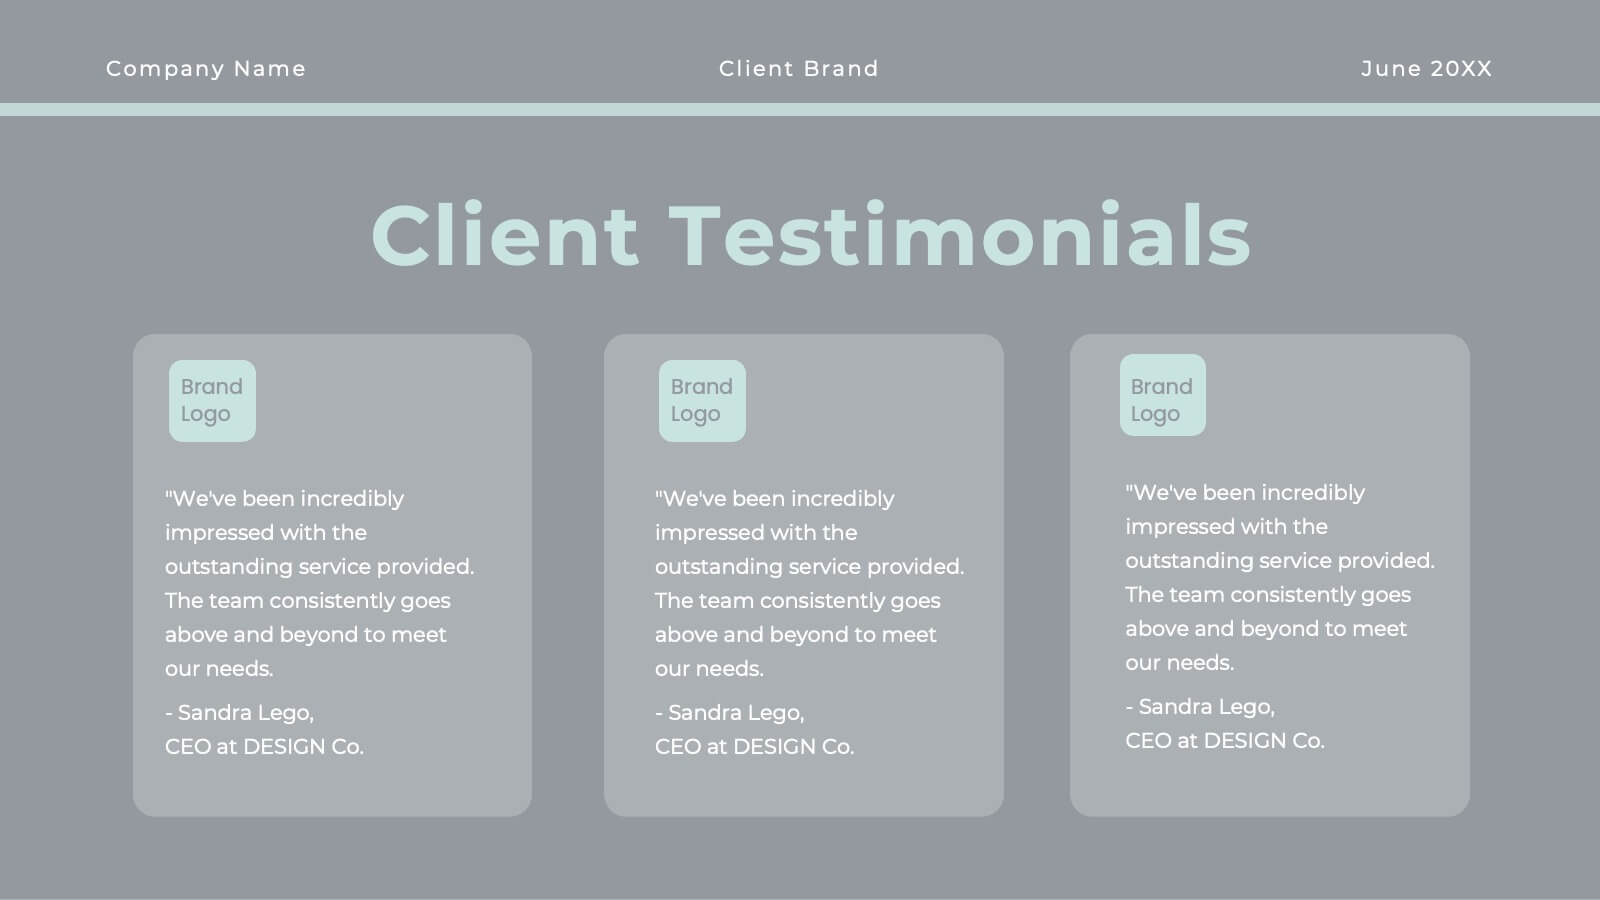
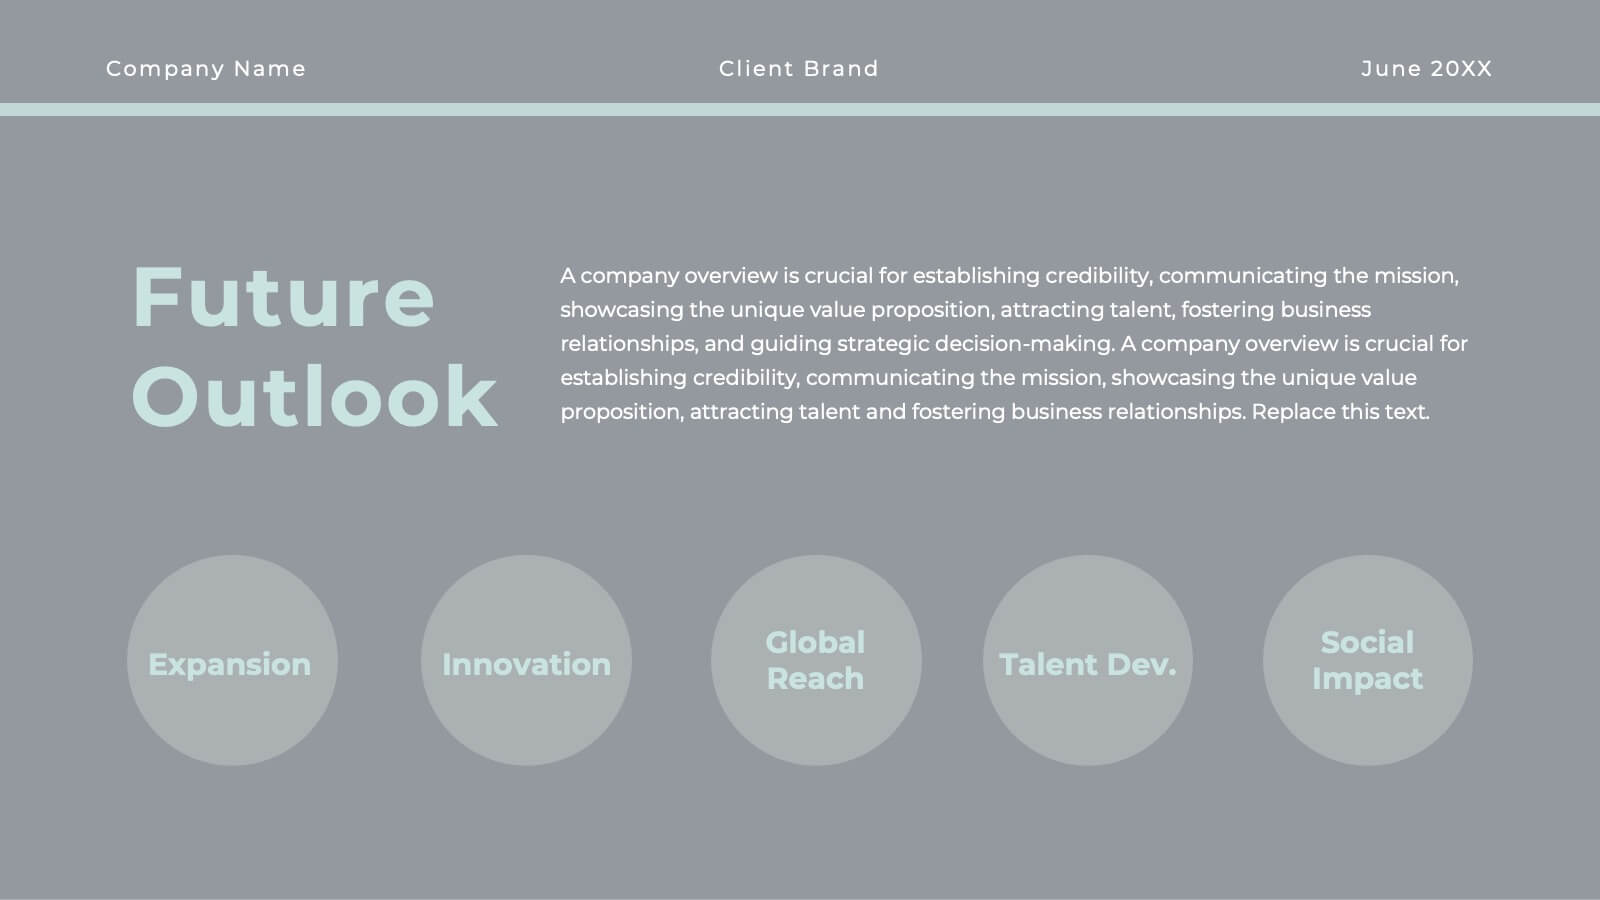
Get ready to elevate your agency’s game with a proposal template that’s as polished as your services! This sleek and sophisticated design is crafted to make a lasting impression on your clients and partners. From introducing your team’s expertise to showcasing successful case studies, every slide is meticulously designed to reflect professionalism and creativity. The clean, modern layout helps you present your market analysis, industry trends, and strategic approach with clarity and impact. With dedicated sections for client testimonials, campaign development, and partnership opportunities, this template ensures your agency’s value proposition is communicated with confidence and style. Perfectly adaptable to PowerPoint, Keynote, and Google Slides, this proposal template is your go-to tool for sealing deals and building lasting relationships. Your agency’s vision and mission will shine through in a presentation that’s both powerful and persuasive, making your proposals truly unforgettable!


22 slides
Etherwind Advertising Agency Proposal Presentation
This Advertising Agency Proposal Presentation Template offers a sleek and professional layout, perfect for showcasing your agency's capabilities, services, and success stories. Covering essential sections such as market analysis, strategy development, campaign execution, and client testimonials, it ensures a compelling pitch to potential clients. Designed for easy customization in PowerPoint, Keynote, and Google Slides, making it a versatile choice for agencies looking to impress their audience.


12 slides
Business Event Planning Schedule Presentation
Optimize your event planning with the Business Event Planning Schedule template, which streamlines your organization efforts by providing a clear timeline from January to June. It's perfect for entering key business insights or data at various stages. Designed for adaptability, this template ensures your planning remains concise and relevant. Compatible with PowerPoint, Keynote, and Google Slides, it integrates effortlessly into your workflow.


20 slides
Astralisque Sales Proposal Presentation
This Sales Proposal Presentation is designed to help businesses outline their sales strategies with a bold and dynamic style. Covering key elements such as competitive analysis, objectives, pricing strategy, and sales performance metrics, it ensures a professional look. Fully customizable and compatible with PowerPoint, Keynote, and Google Slides.


4 slides
Global Market Overview with World Map Presentation
Present international data visually with this world map slide layout. Ideal for showcasing market reach, regional insights, or global performance metrics. Each pin can be customized with location-specific information and iconography. Perfect for business overviews, sales reports, and investor decks. Editable in PowerPoint, Keynote, and Google Slides.


6 slides
Strategic Solution Framework Presentation
Build your ideas step by step with this dynamic layout that turns strategies into a clear visual journey. Perfect for illustrating processes, growth plans, or solution pathways, it helps simplify complex frameworks into engaging visuals. Fully editable and compatible with PowerPoint, Keynote, and Google Slides for seamless customization.


6 slides
Strategic Business Planning Presentation
Bring your ideas to life with a slide design that makes strategic planning feel bold, focused, and easy to follow. This presentation walks through key business objectives, priorities, and action steps using clean visuals and intuitive layouts. Perfect for teams presenting strategy, goals, and long-term planning. Fully compatible with PowerPoint, Keynote, and Google Slides.