


Características


¿Tienes alguna pregunta?
Recomendar


6 diapositivas
6-Step Training Program Slide Presentation
Make your training process feel like a journey worth taking. This vibrant 6-step infographic template helps you break down each stage of your program with clear icons, color-coded steps, and a clean visual path. Ideal for onboarding, workshops, or employee development. Fully compatible with PowerPoint, Keynote, and Google Slides.


6 diapositivas
Porter's Five Forces Strategy Presentation
Give your competitive analysis a bold, intuitive flow with a clean layout that visually breaks down each force in a simple, strategic way. This presentation helps you highlight market pressures, evaluate risks, and support smarter decision-making with clarity and confidence. Fully editable and compatible with PowerPoint, Keynote, and Google Slides.


5 diapositivas
Spider Chart for Mind Organization Presentation
Clarify complex ideas with the Spider Chart for Mind Organization Presentation. This layout visually maps key topics and subtopics, helping you identify patterns, priorities, or areas of focus. Ideal for planning, decision-making, and brainstorming sessions. Fully customizable in Canva, PowerPoint, Google Slides, and Keynote for seamless use.


21 diapositivas
Thistledown Marketing Campaign Presentation
Elevate your marketing campaigns with this polished and professional presentation template. Perfectly tailored to showcase key components such as campaign objectives, target audience, and competitive landscape, it provides a cohesive structure for presenting your strategies effectively. The slides also include sections for financial highlights, unique selling proposition, and growth planning, ensuring your goals are communicated with clarity. Whether you're discussing market presence, service offerings, or team leadership, this template helps streamline your content. Fully editable in PowerPoint, Google Slides, and Keynote, it offers flexibility to align with your branding and deliver a compelling campaign presentation.


21 diapositivas
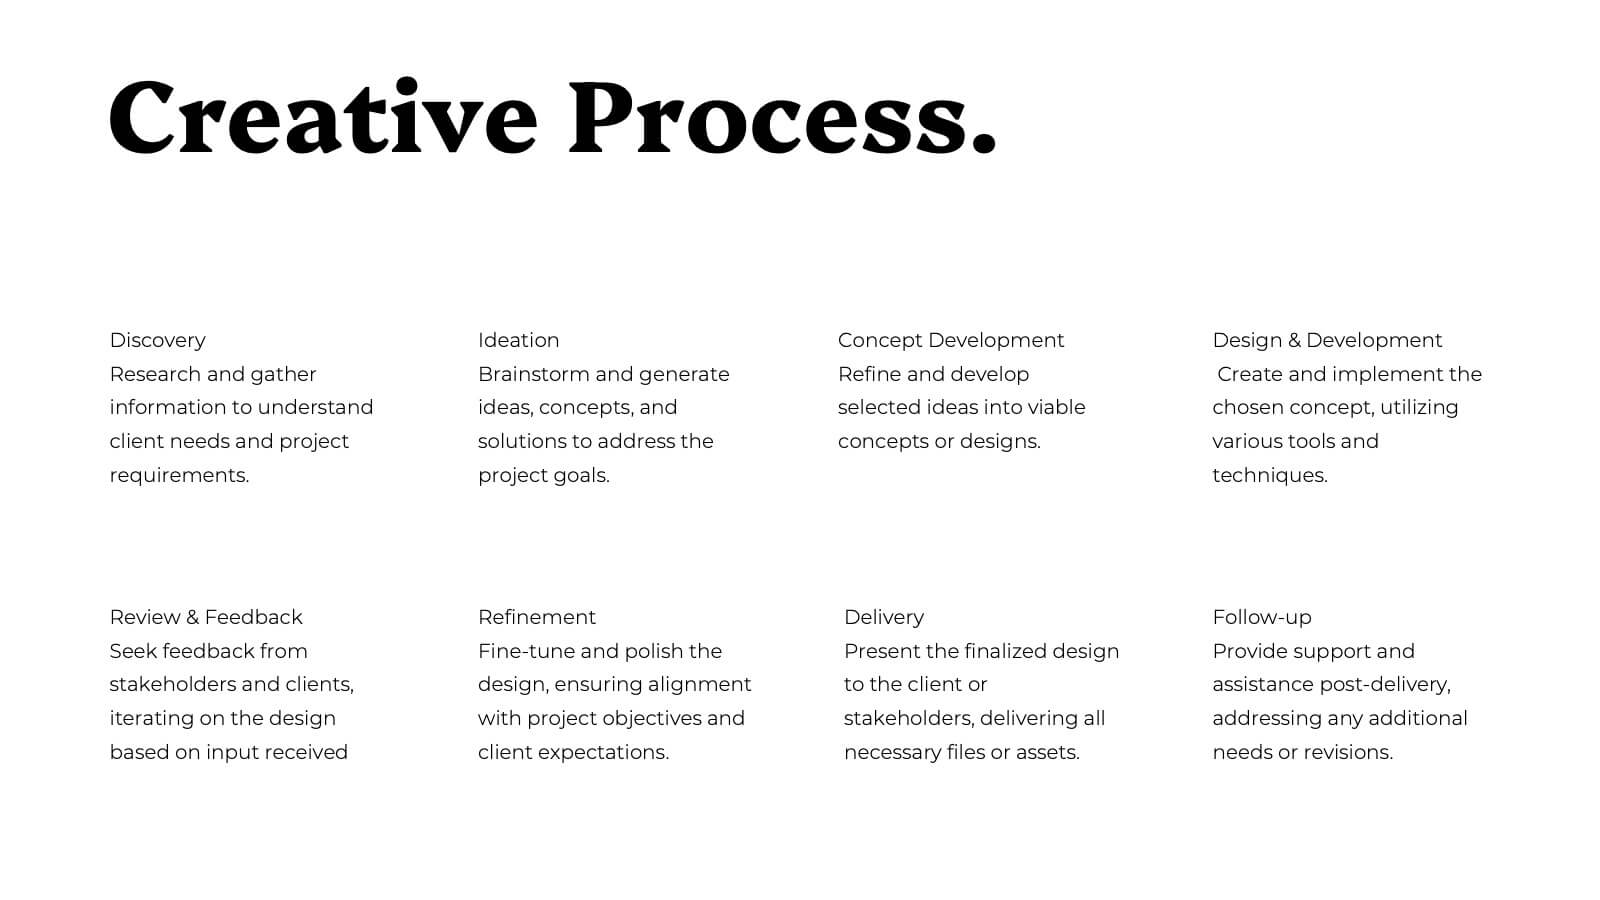
Arcadian Photography Portfolio Template Presentation
Showcase your best work with this sleek and stylish photography portfolio presentation template! It’s perfect for presenting your featured projects, creative process, and client testimonials in a visually stunning way. This template is fully customizable and offers a professional touch to your portfolio, making it ideal for both personal and client presentations. Compatible with PowerPoint, Keynote, and Google Slides.


5 diapositivas
Western Europe Political Map Slide Presentation
Showcase political insights and regional data with a clear, modern map design that highlights countries across Western Europe. Perfect for comparing demographics, election data, or market performance, this layout combines clarity with visual impact. Fully compatible with PowerPoint, Keynote, and Google Slides for easy customization and professional presentations.


4 diapositivas
Workforce Adaptation Through Change Management Presentation
Show how your team evolves and thrives through transformation with this visual journey up the change curve. This template uses a clear mountain-climb illustration to highlight workforce progression and adaptation. Ideal for HR, change leaders, and organizational development professionals. Fully compatible with PowerPoint, Keynote, and Google Slides.


26 diapositivas
Dax Presentation Template
Dax is a professional and clean template that was created to make your presentations stand out. It has a vibrant color scheme and engaging graphics that are easy to edit. The clean look has plenty of room for you to display your content, and this high-quality design will make an impression in your meeting or presentation for your targeted audience. It also allows you to present your content in a way that is professional and engaging. Its vibrant style also makes it stand out from other presentations. This template is suitable for all types of businesses. Don't think twice this one if for you!


26 diapositivas
Melo Presentation Template
Are you looking for a presentation to make your product stand out? Melo is a beautifully elegant presentation with modern elements and light neutral color palette. Perfect for furniture brands, or any one looking for a modern presentation. These slides include world maps, company slides, mockups and charts perfect for businesses, this template has everything you'll need. It's simple yet chic design makes it stand out and at the same time keep your audience engaged. This is the perfect choice for businesses, brands or anyone who needs to make a great looking template on their next presentation


22 diapositivas
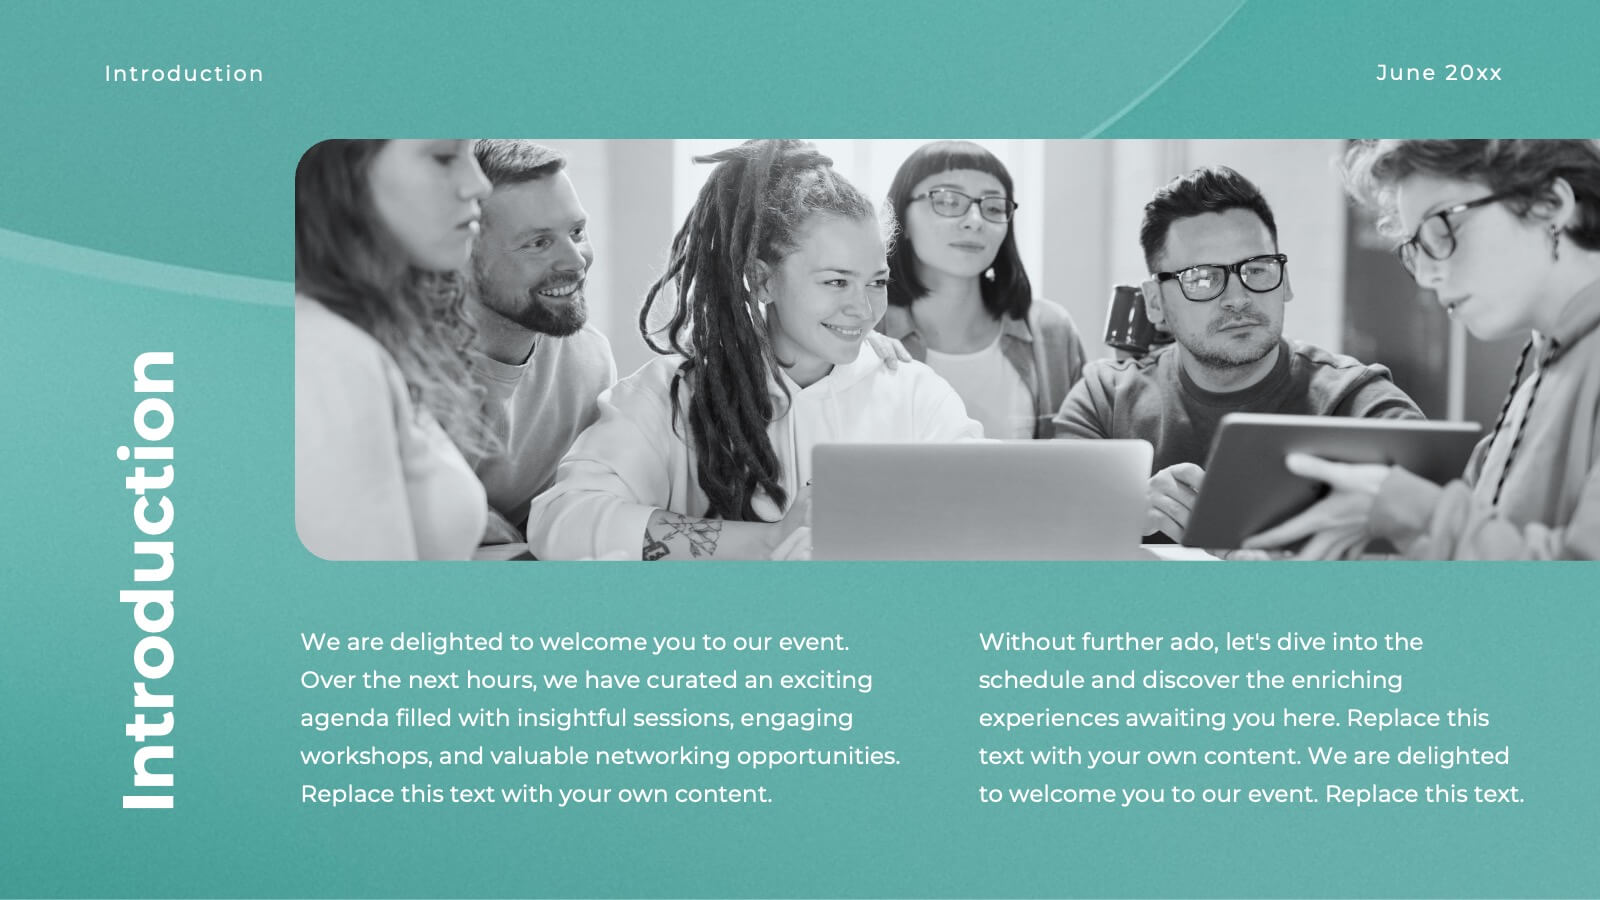
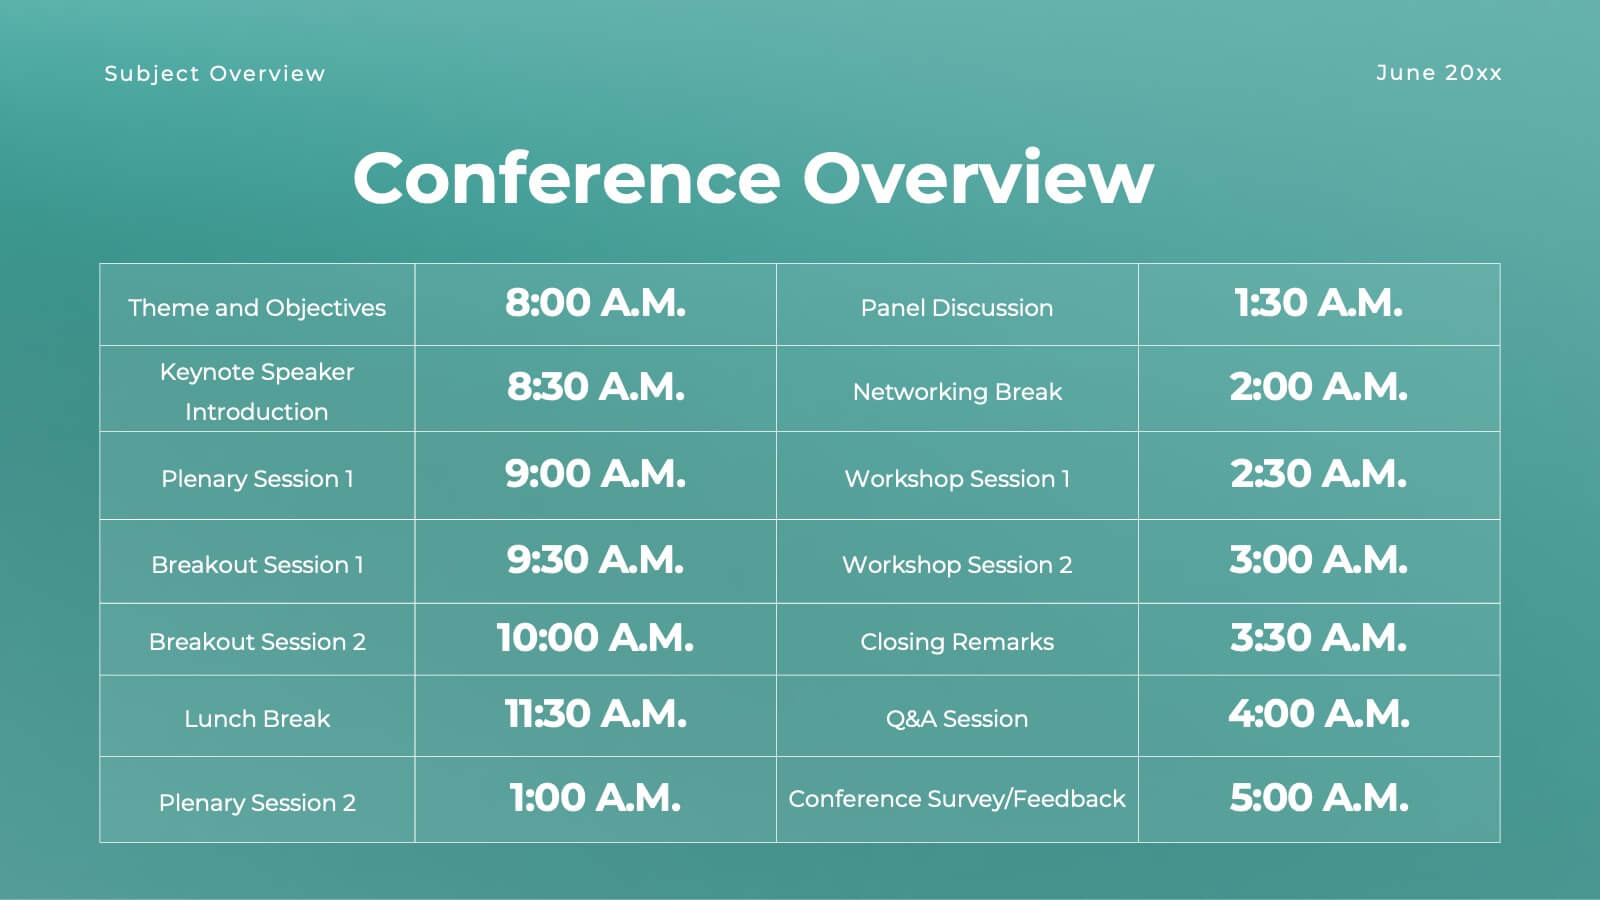
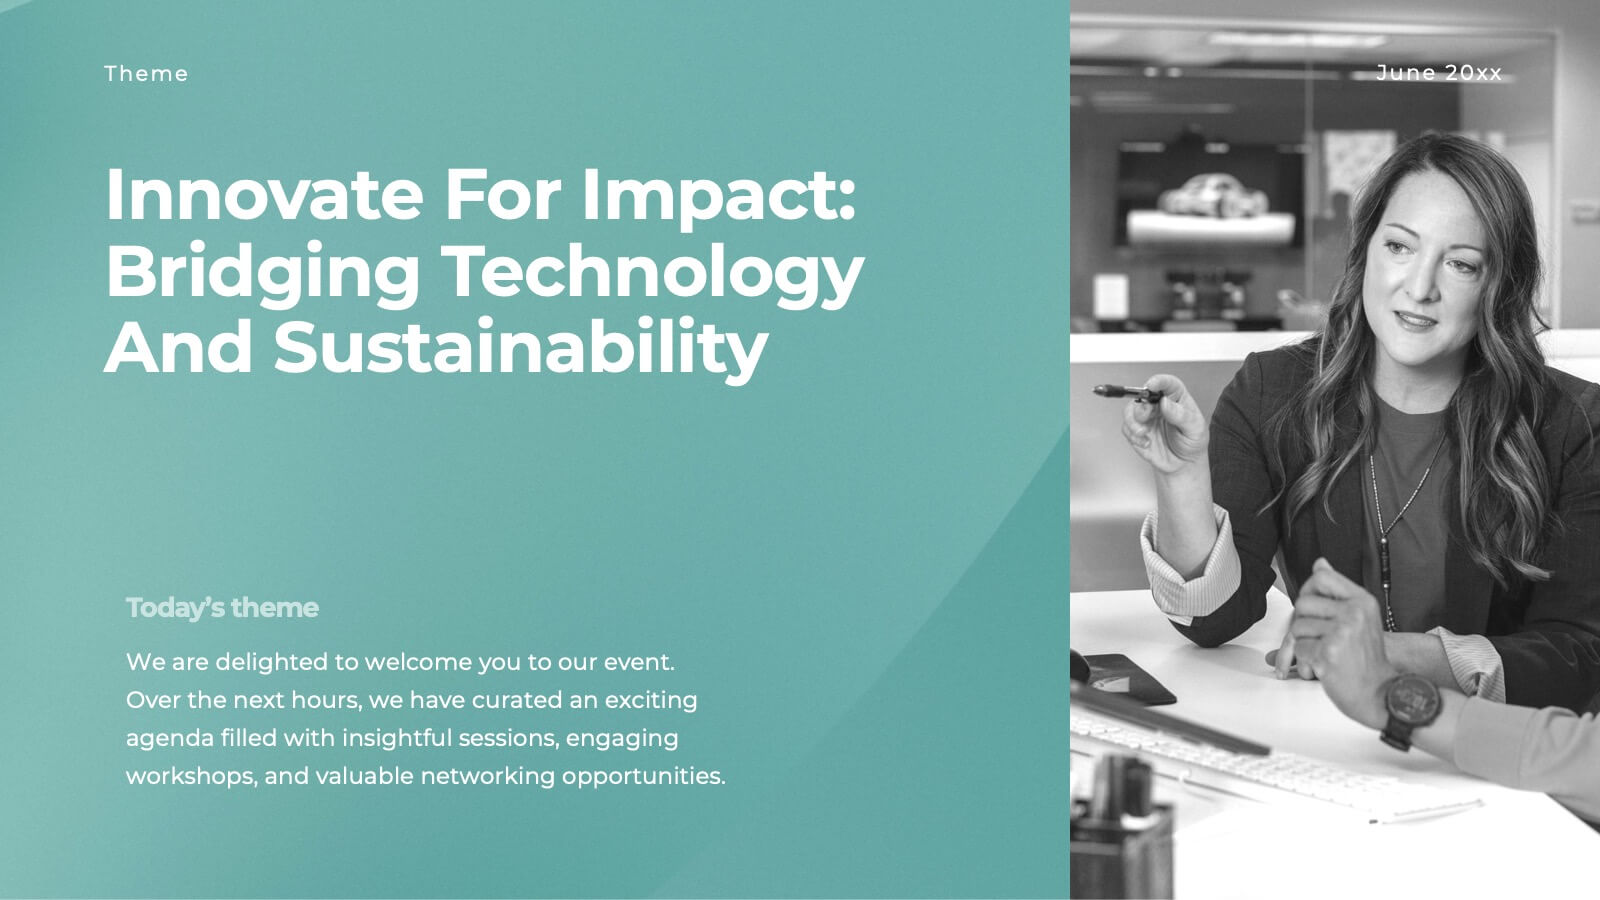
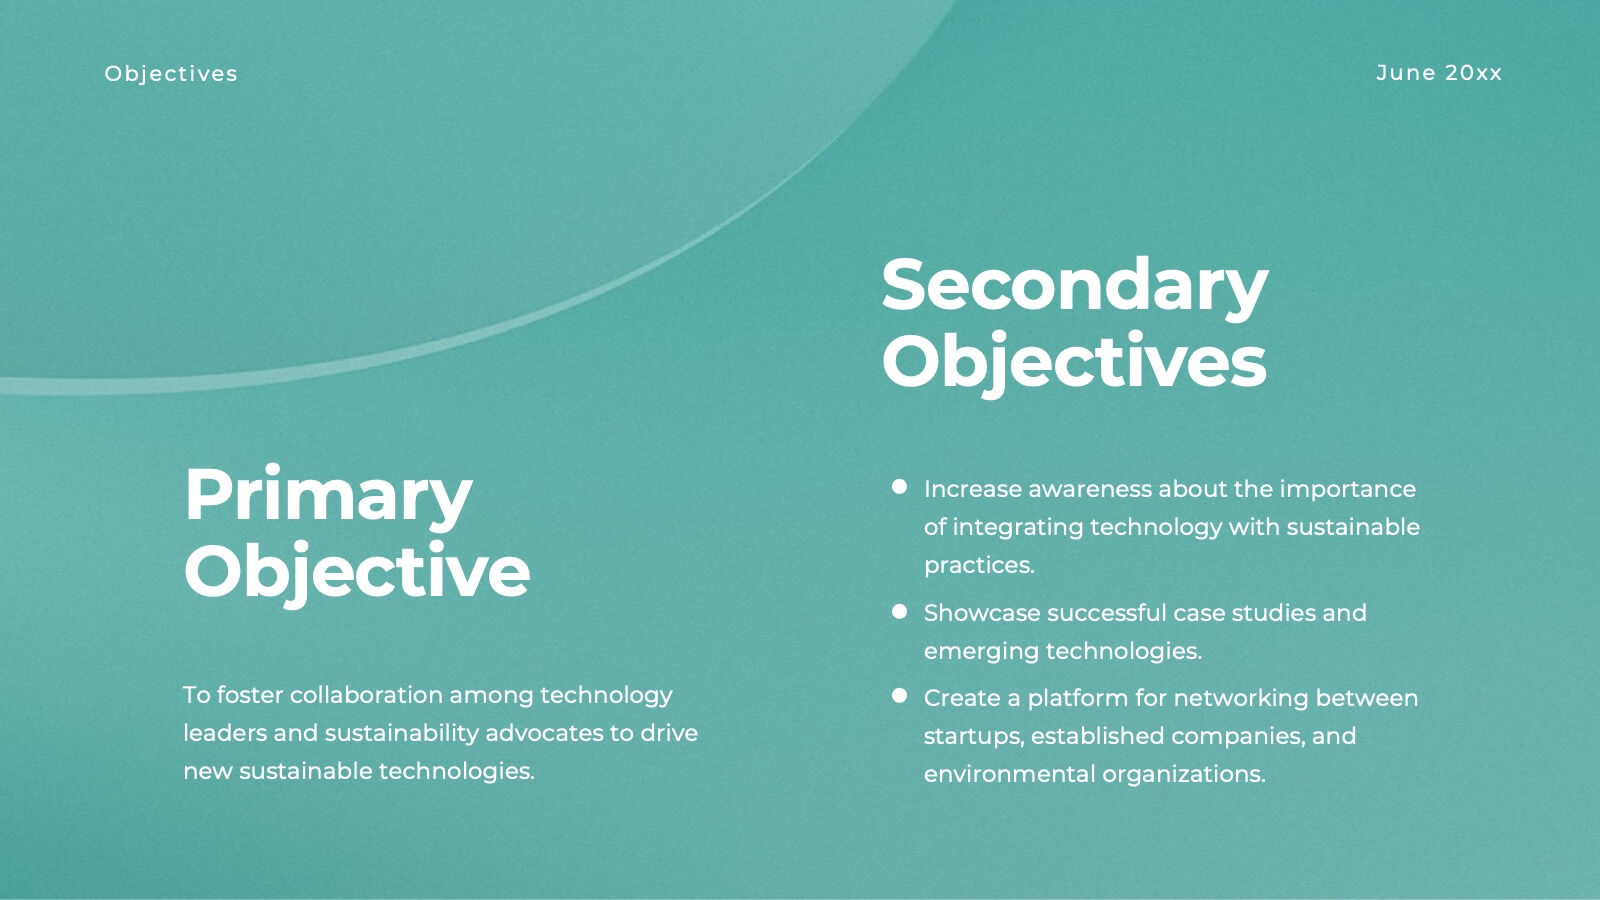
Halo Small Business Pitch Deck Presentation
Streamline your business presentations with this versatile pitch deck template! Ideal for conferences and meetings, it includes slides for objectives, session details, keynote speakers, and panel discussions. Keep your audience engaged with professional design and clear, structured content. Compatible with PowerPoint, Keynote, and Google Slides for seamless presentations on any platform.


26 diapositivas
Cutting-Edge AI Breakthroughs Presentation
Step into the future with this exciting presentation on cutting-edge AI breakthroughs. Covering advancements in machine learning, automation, ethical AI, and real-world applications, this template helps you present complex innovations with clarity and impact. Fully customizable and compatible with PowerPoint, Keynote, and Google Slides for a seamless and engaging presentation experience.


6 diapositivas
Business Challenge Identification Presentation
Spotting roadblocks has never looked this good! This infographic presentation template helps you map out key pain points across departments or processes, making it easier to analyze, discuss, and resolve challenges visually. It’s a perfect tool for business strategy teams and consultants. Fully compatible with PowerPoint, Keynote, and Google Slides.


4 diapositivas
Report Recap and Summary Section Presentation
Summarize key takeaways clearly with this Report Recap and Summary Section slide. Featuring a step-by-step horizontal layout with bold numbering, icons, and text boxes, this design helps emphasize three main points or stages in your report. Ideal for executive briefs or performance reviews. Fully editable in Canva, PowerPoint, or Google Slides.


14 diapositivas
Business Innovation and Idea Development Presentation
Drive Business Innovation and Idea Development with this dynamic and structured template, perfect for illustrating creative processes, strategic growth, and idea execution. Designed with a lightbulb-themed layout, this presentation helps break down complex concepts into clear, engaging sections. Fully customizable and compatible with PowerPoint, Keynote, and Google Slides, making it an essential tool for entrepreneurs, teams, and business leaders looking to present ideas with impact.


5 diapositivas
SEO and Funnel Tactics in Marketing Presentation
Showcase your digital strategy step-by-step with the SEO and Funnel Tactics in Marketing Presentation. Designed with a layered visual layout, this template helps you highlight up to five key stages of your marketing funnel—from awareness to conversion. Fully customizable in PowerPoint, Canva, Keynote, and Google Slides.


5 diapositivas
Management Framework Structure Presentation
Bring your ideas to life with a dynamic slide that maps out clear stages of leadership, planning, and execution. This layout helps you break down complex management structures into simple, visual steps that any audience can follow. Fully editable and easy to customize in PowerPoint, Keynote, and Google Slides.


12 diapositivas
Corporate Case Study Analysis
Break down your business case into clear, actionable sections with this five-step analysis layout. Each stage—from point A to E—is designed for highlighting core components such as challenges, processes, and insights. Ideal for consultants, executives, and analysts. Compatible with PowerPoint, Keynote, and Google Slides.