


Características


¿Tienes alguna pregunta?
Recomendar


5 diapositivas
Meeting Minutes and Notes Presentation
Keep every discussion organized and every detail accounted for with this clean and structured layout. Perfect for summarizing key decisions, attendees, and next steps, it helps teams capture essential meeting insights efficiently. This easy-to-edit template works flawlessly with PowerPoint, Keynote, and Google Slides for a polished professional presentation.


21 diapositivas
Sylvan Research Findings Report Presentation
The Research Findings Report Presentation Template features 21 modern slides designed to highlight key achievements, competitor insights, and actionable recommendations. Perfect for presenting performance metrics, market trends, and team productivity. Fully customizable and compatible with PowerPoint, Keynote, and Google Slides, it ensures clarity and professionalism for business reports and strategy reviews.


3 diapositivas
Agricultural Business Plan Presentation
Showcase your farming strategies with this agricultural business plan template, featuring plant growth visuals and clean, modern layouts. Ideal for agribusiness proposals, sustainability reports, and agricultural project planning. Fully editable in Canva, PowerPoint, and Google Slides, allowing you to customize text, icons, and colors to match your brand identity.


4 diapositivas
30 60 90 Day Plan Goals Presentation
Set your roadmap in motion with a clean, visual timeline that makes each milestone easy to follow and present with confidence. This presentation helps you outline priorities, track progress, and communicate clear goals for the first three months. Fully editable and compatible with PowerPoint, Keynote, and Google Slides.


6 diapositivas
Logistics and Procurement Supply Chain Presentation
Optimize your supply chain strategy with the Logistics and Procurement Supply Chain template. Designed to illustrate key logistics processes, procurement flows, and operational efficiency, this structured layout helps you present crucial data with clarity. Fully customizable and compatible with PowerPoint, Keynote, and Google Slides for seamless business integration.


6 diapositivas
Problem-Solving Framework for Business Success Presentation
Streamline your approach to complex challenges with this 6-step business problem-solving framework. This professional slide layout clearly separates each stage—from identifying the issue to implementing solutions—using easy-to-edit circular markers and concise content boxes. Ideal for consulting pitches, internal planning, or strategy development, this slide is fully customizable in PowerPoint, Keynote, and Google Slides.

20 diapositivas
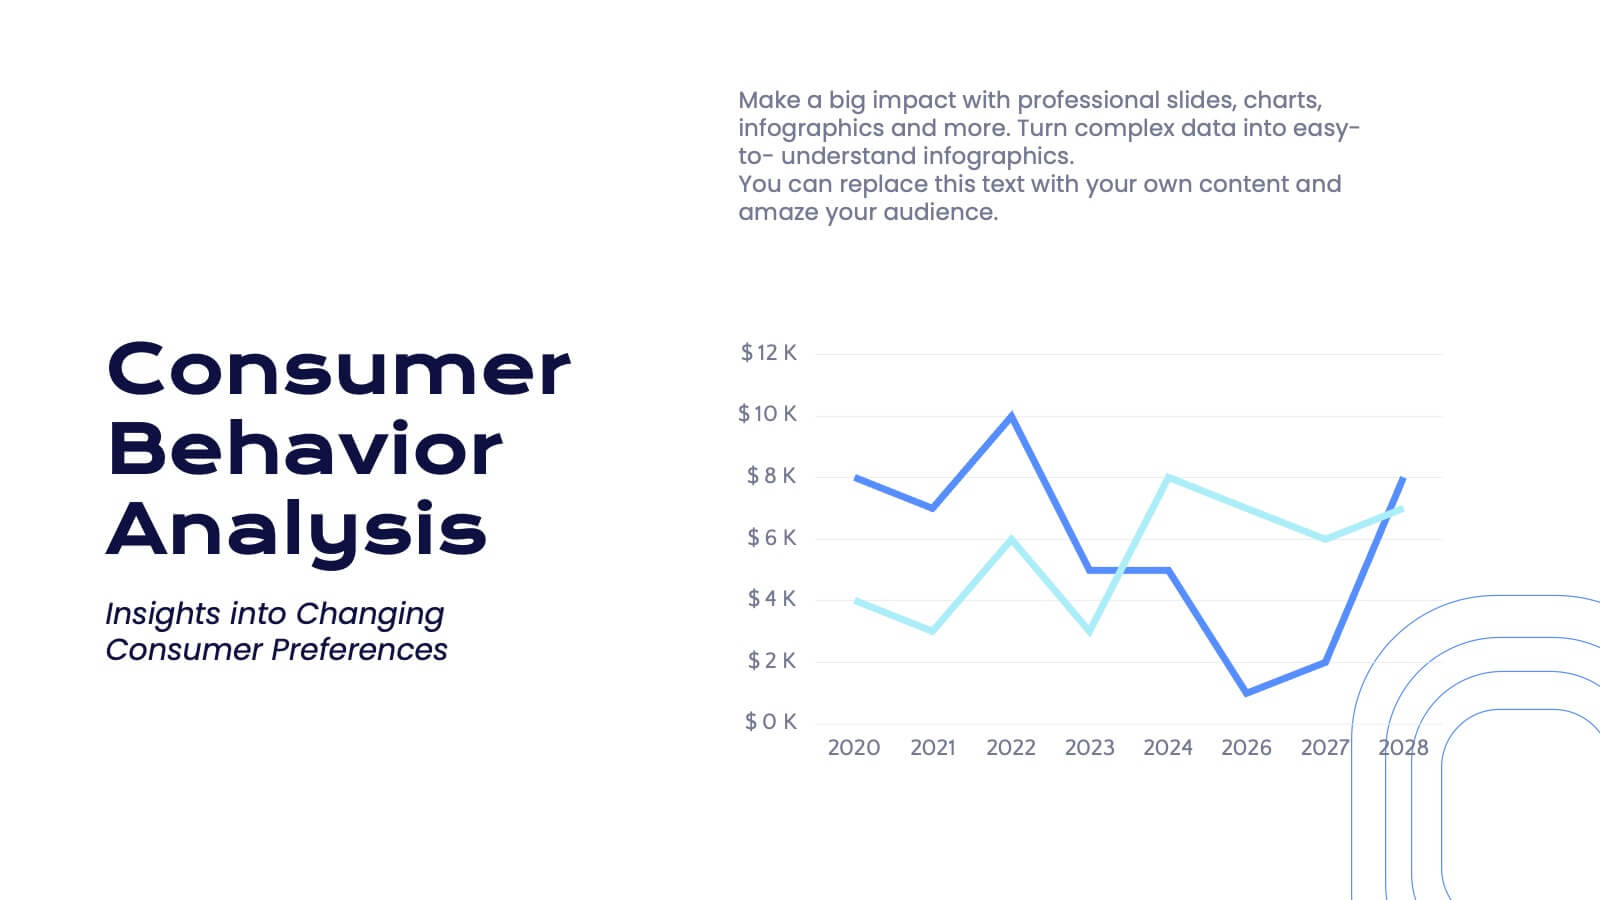
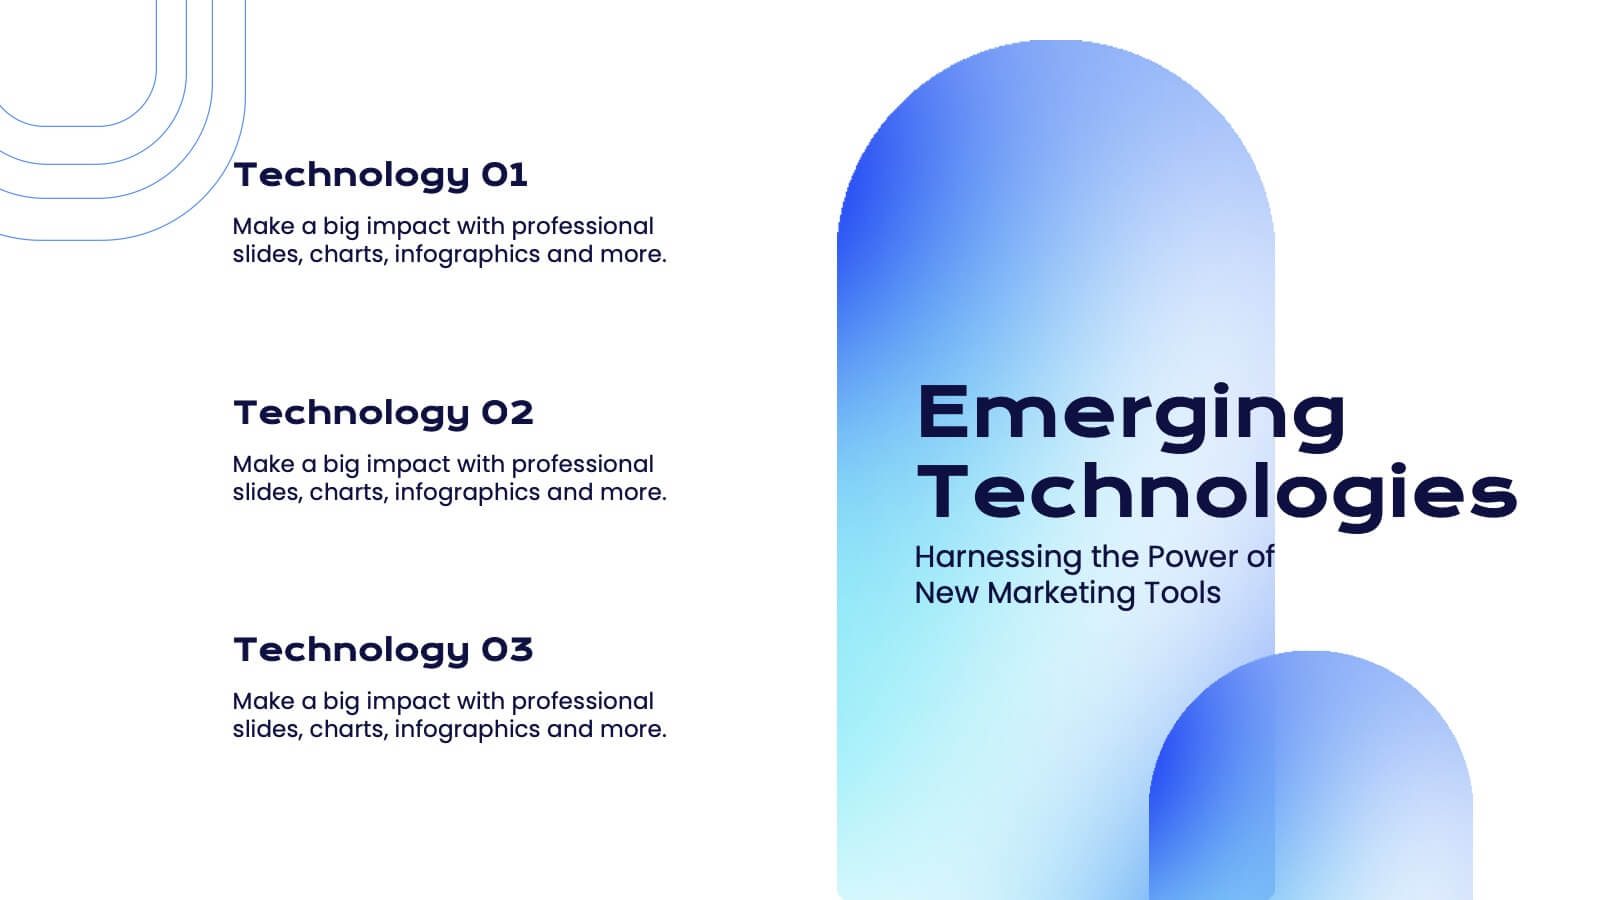
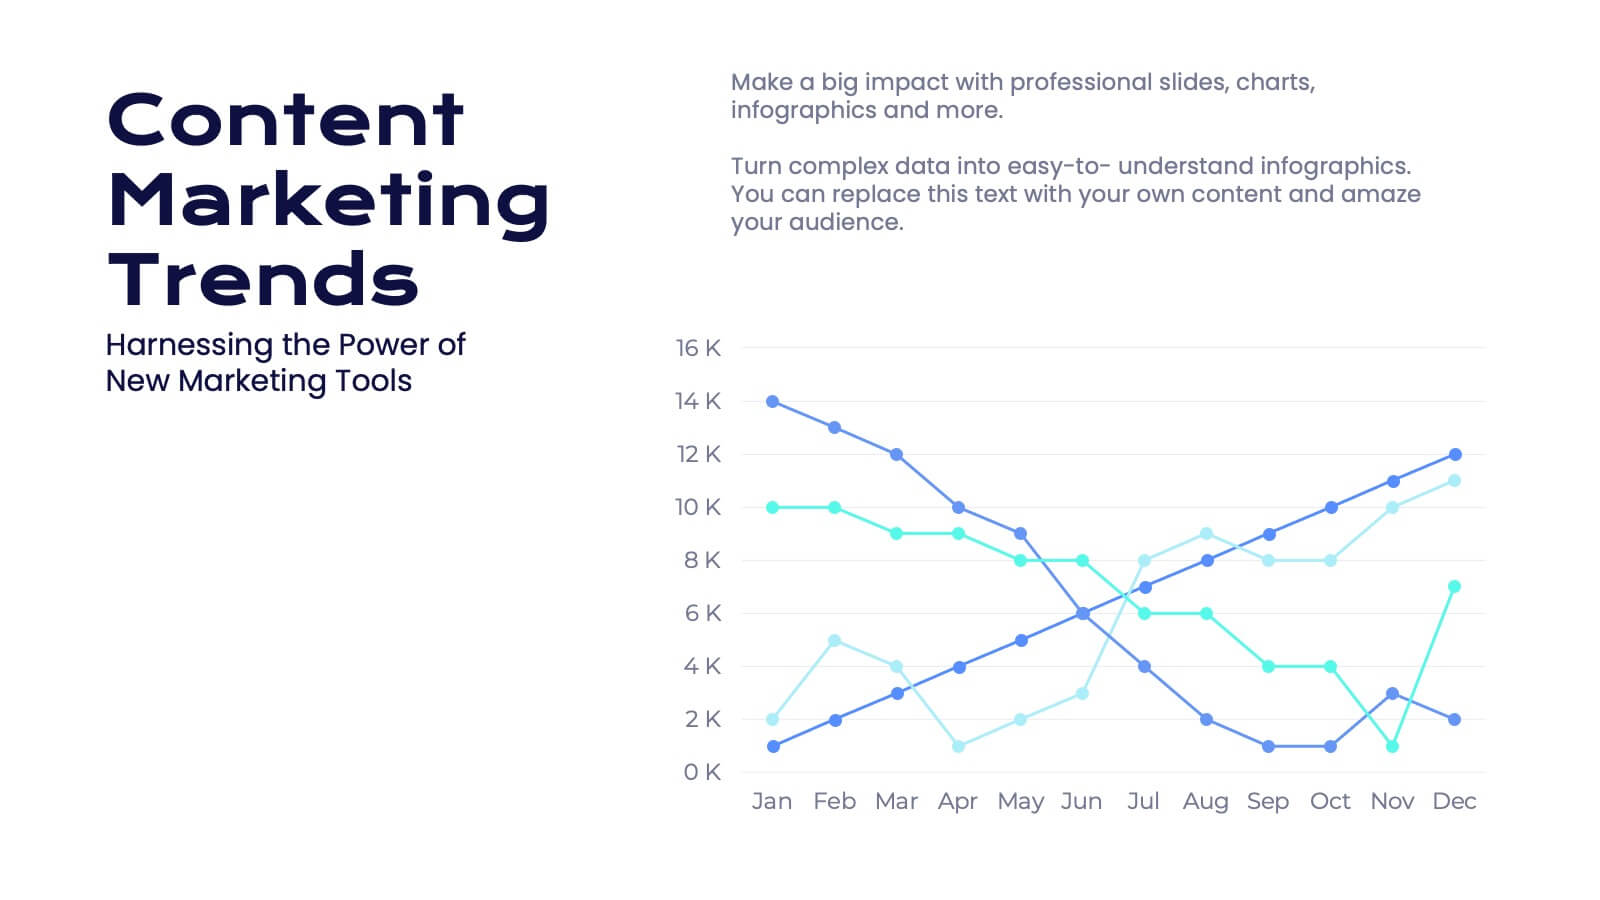
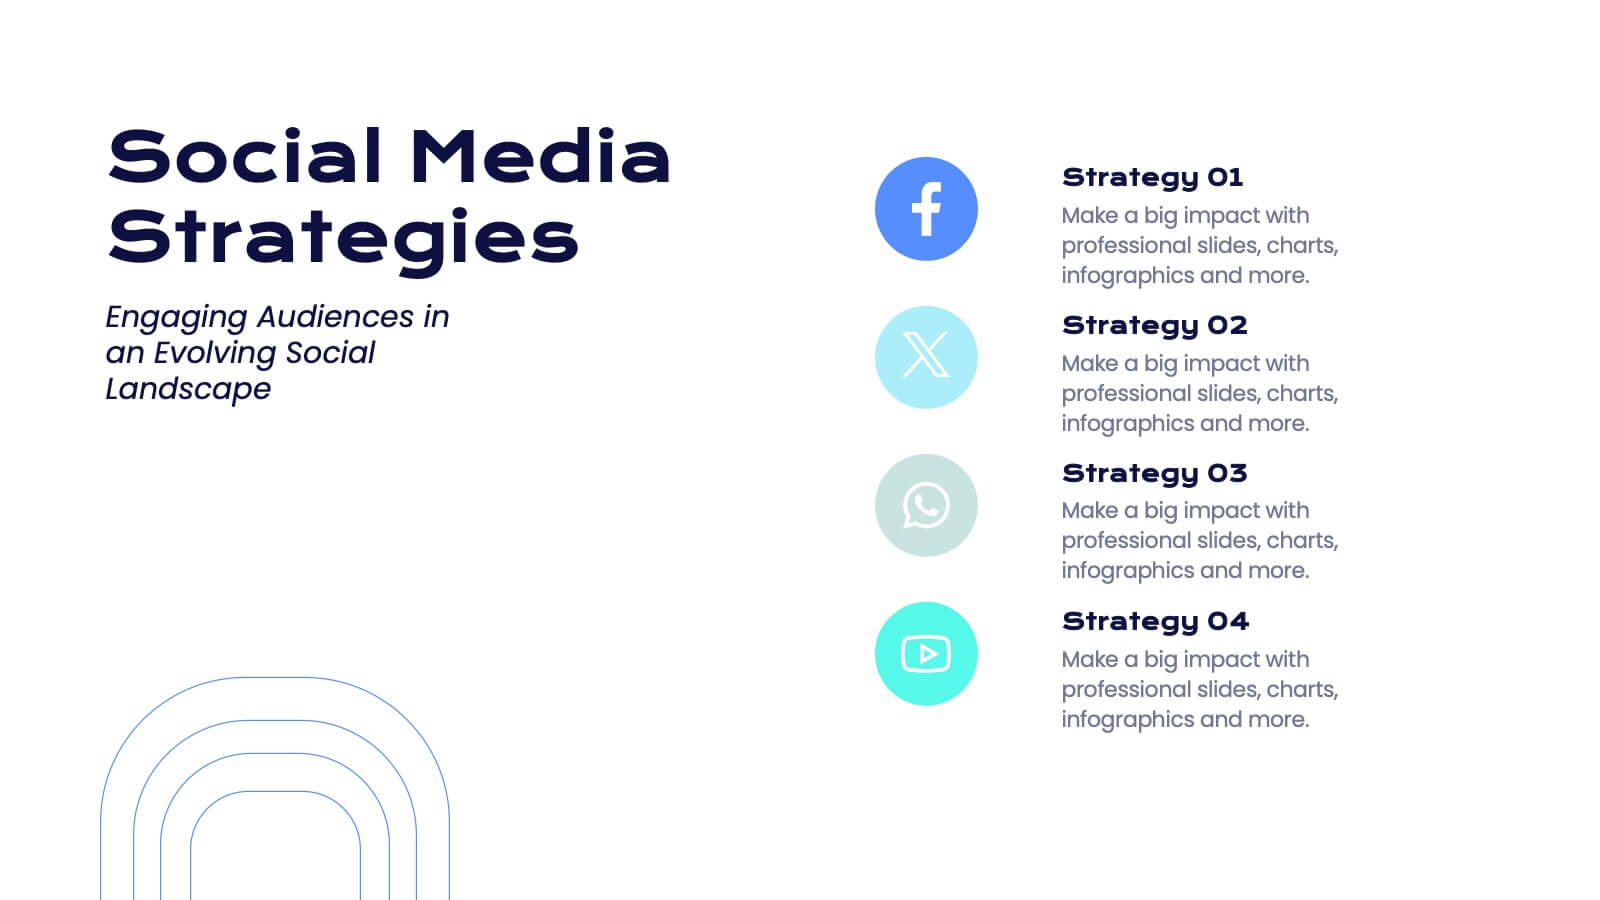
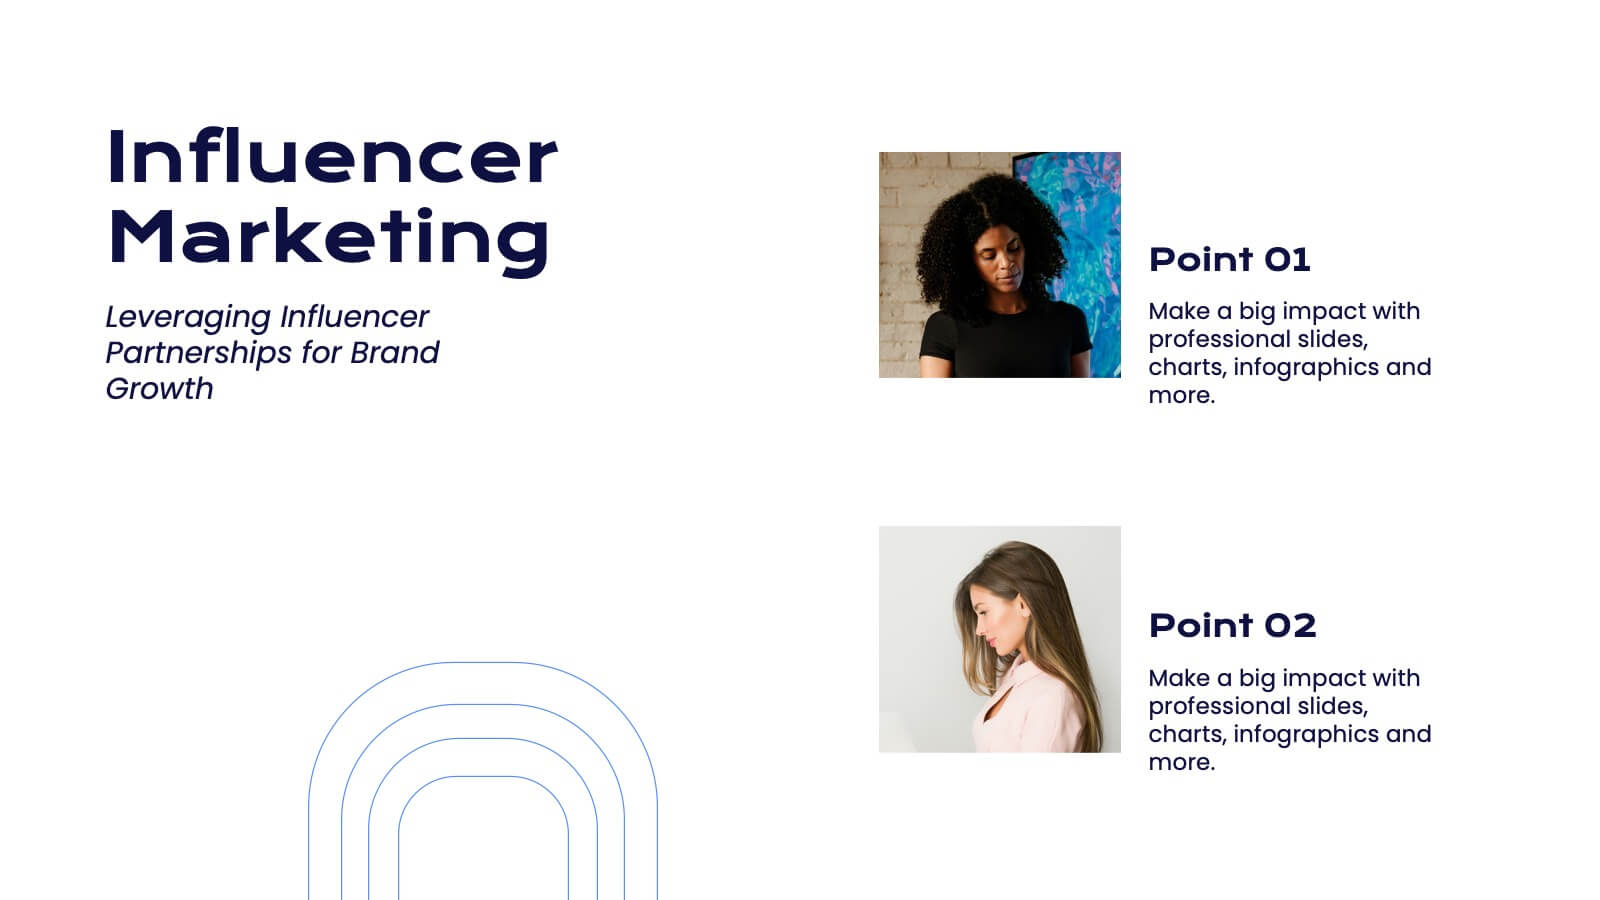
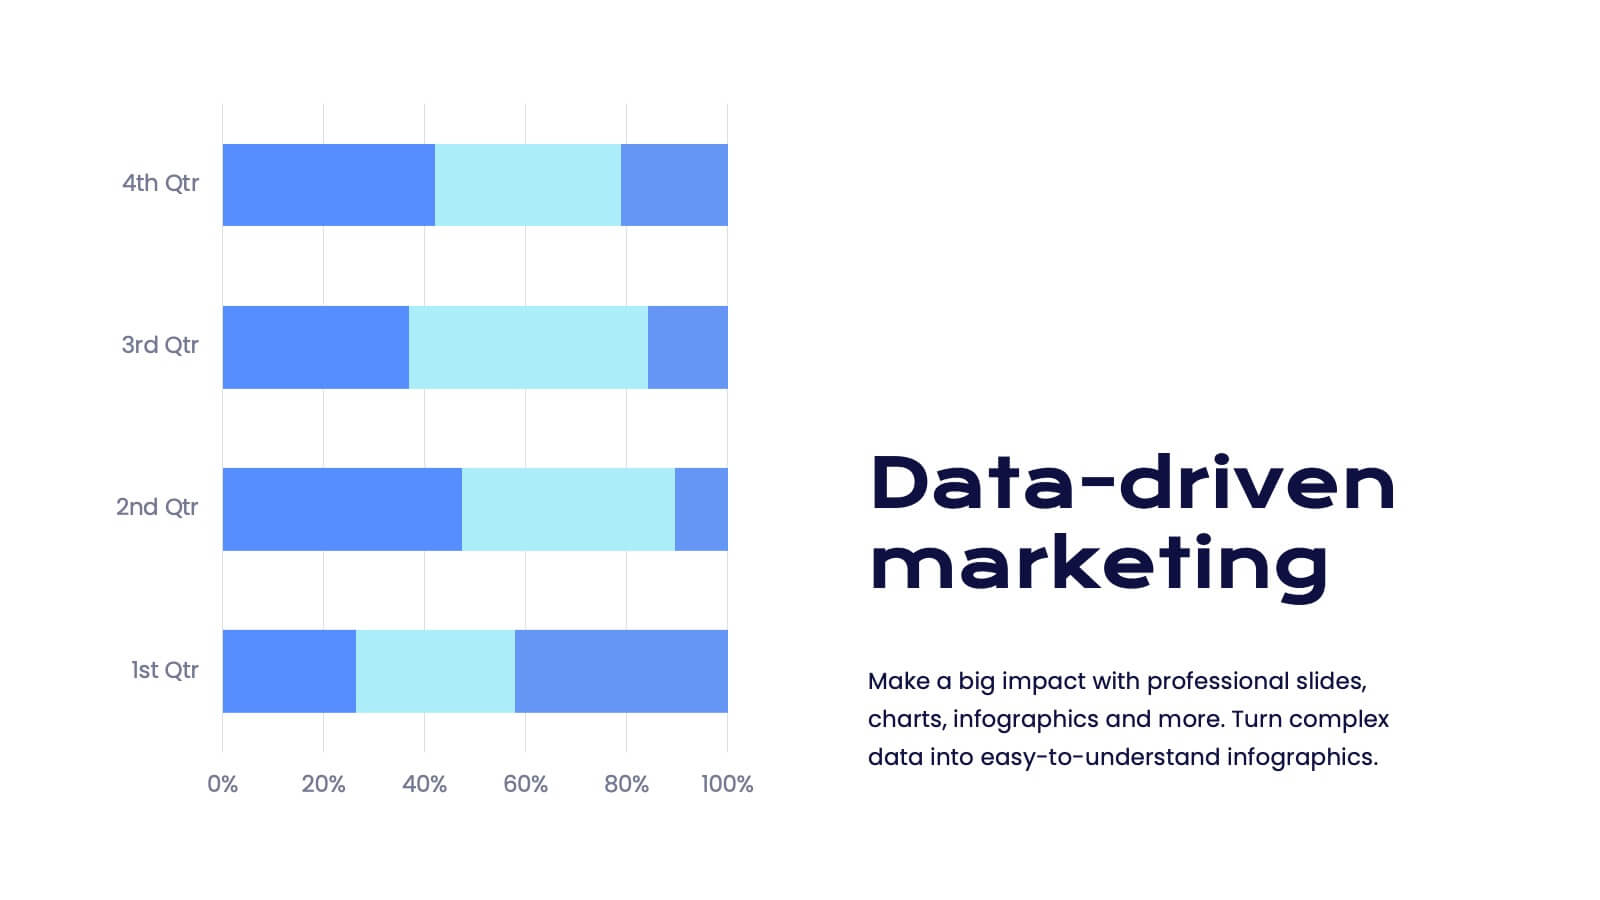
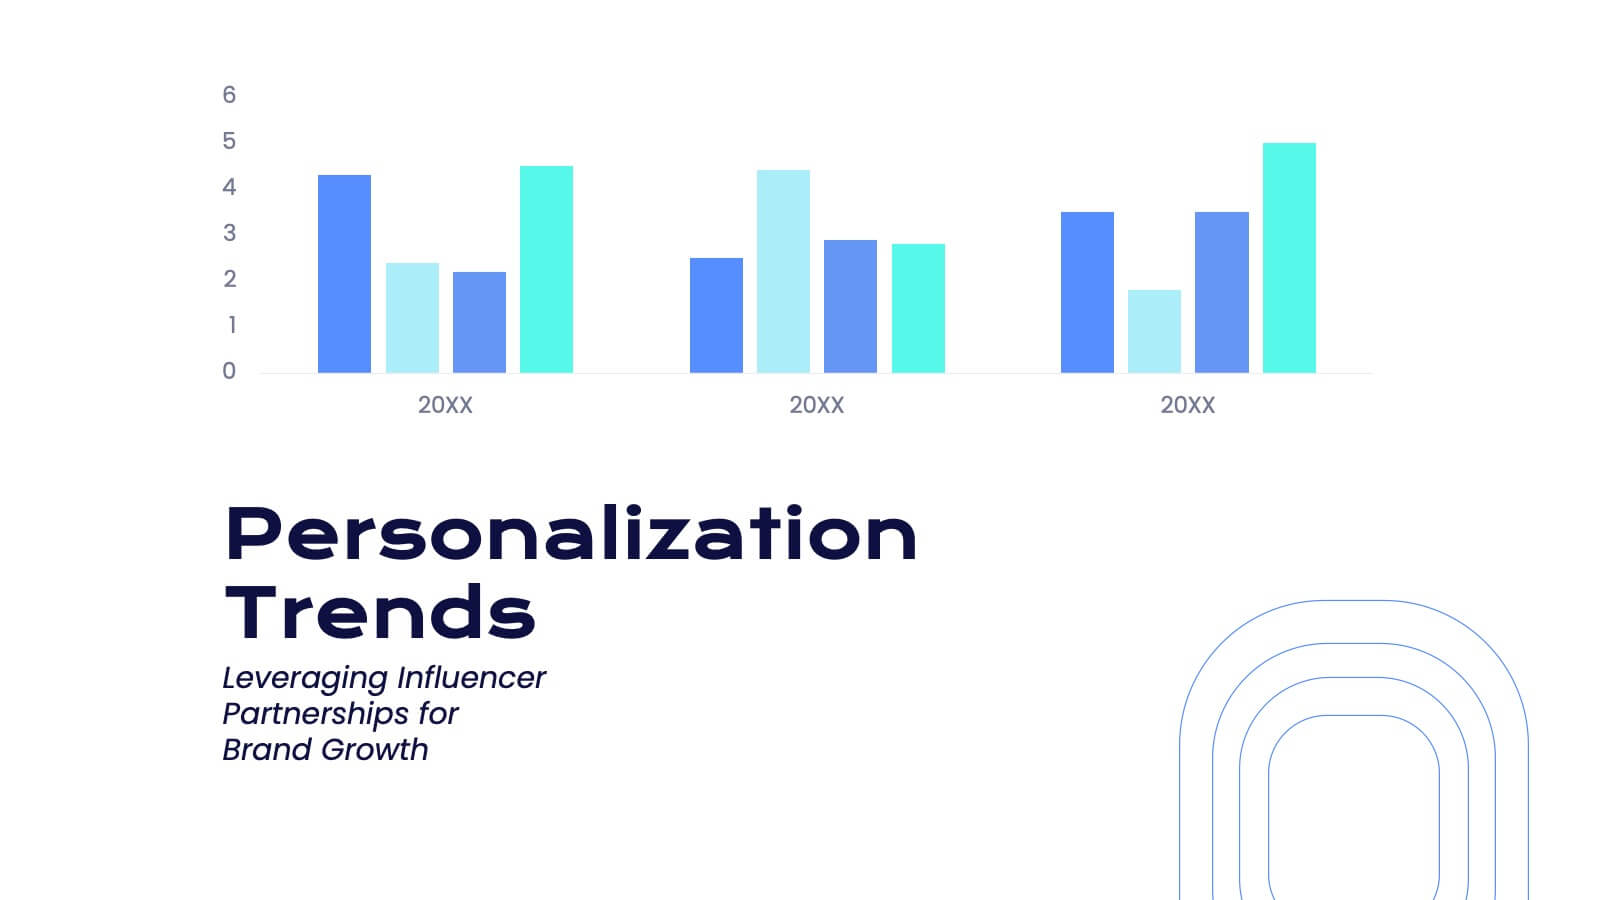
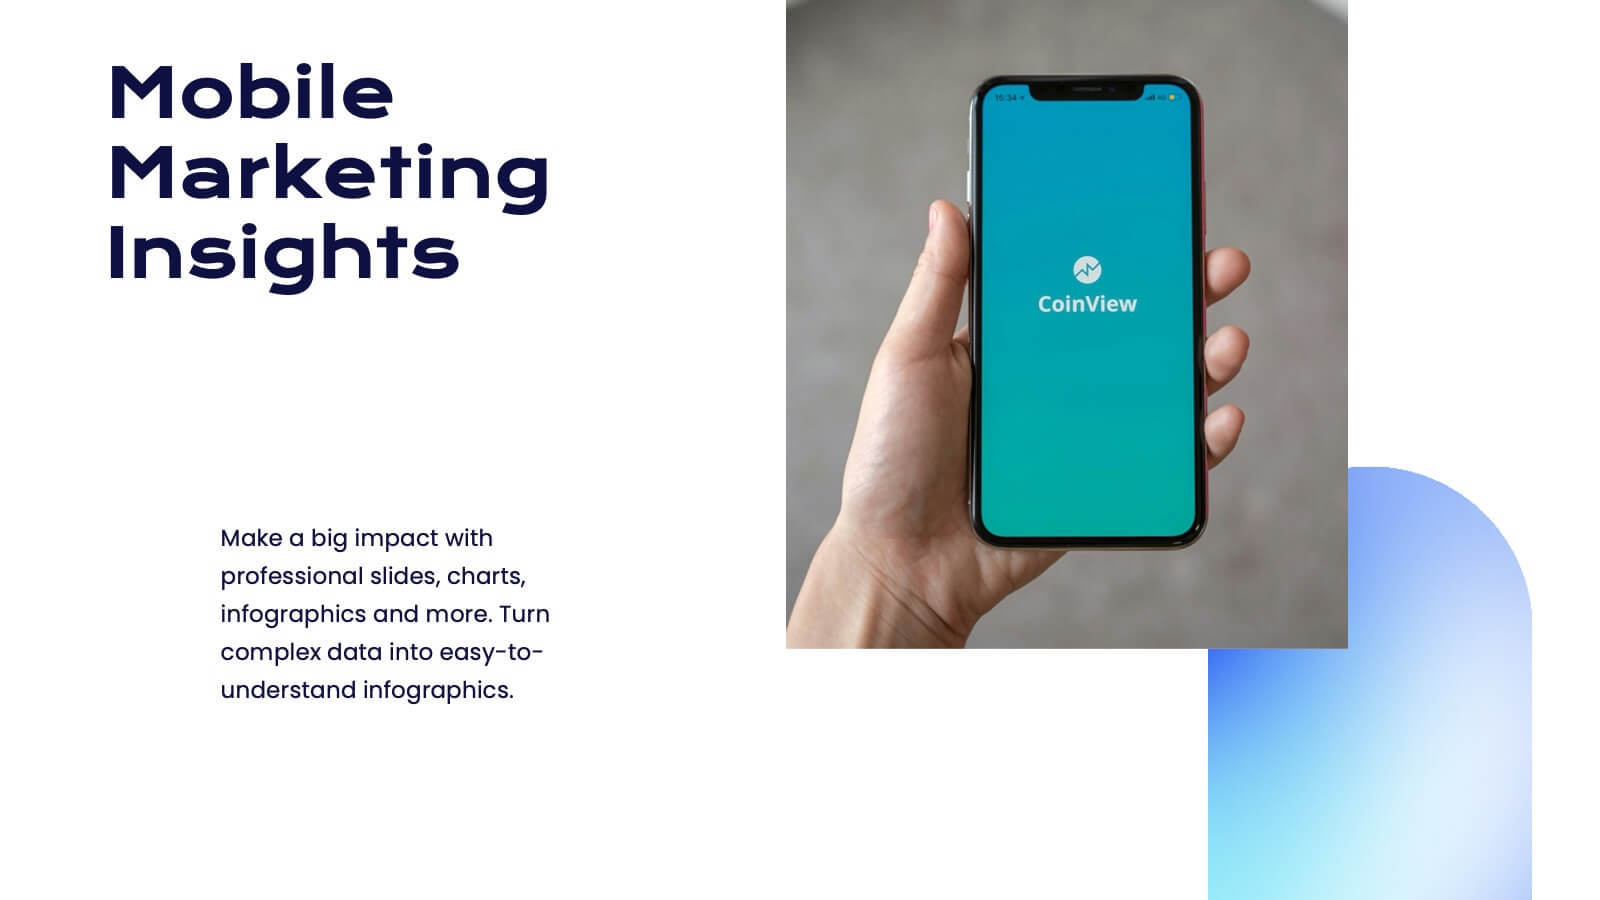
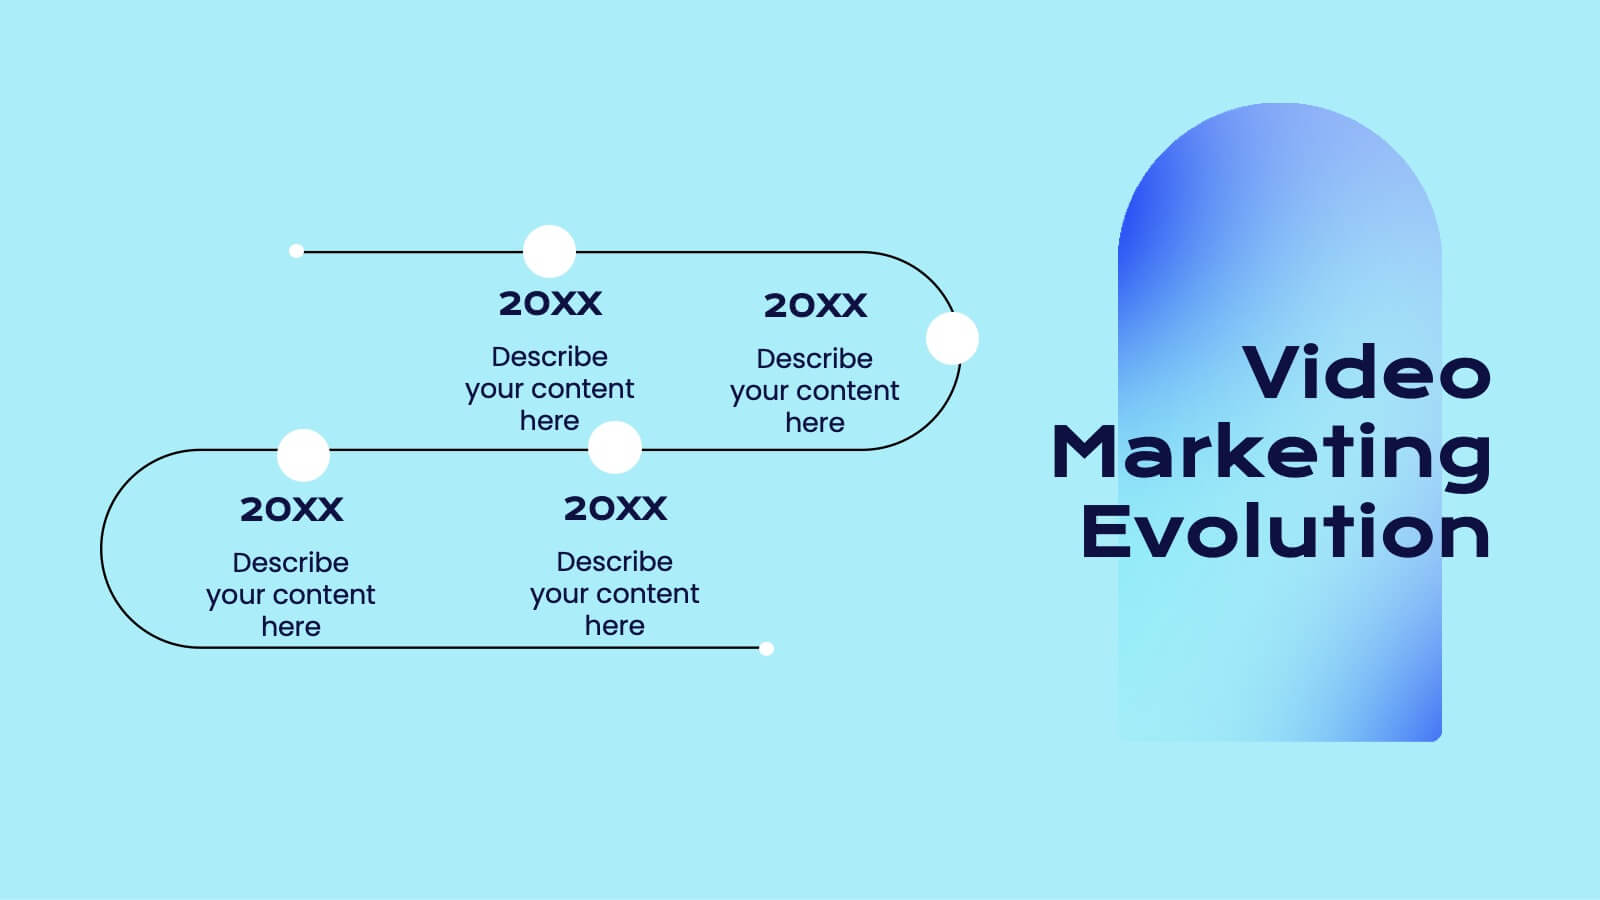
Faerie Digital Marketing Strategy Plan Presentation
Create a compelling marketing strategy with this sleek, modern template! It covers key topics like consumer behavior, social media strategies, and emerging trends. Perfect for showcasing insights in a clear, data-driven format. Fully customizable, it works seamlessly with PowerPoint, Keynote, and Google Slides for effective presentations.


5 diapositivas
End-to-End Process Flow Framework Presentation
Visualize your operations from start to finish with the End-to-End Process Flow Framework Presentation. This clean, arrow-based layout is perfect for outlining workflows, project stages, or business processes step by step. Fully customizable in Canva, PowerPoint, and Google Slides to suit any team or strategic need.


5 diapositivas
Annual Achievements and Highlights Presentation
Celebrate your progress with the Annual Achievements and Highlights Presentation. This timeline-style layout guides viewers along a visual path of milestones year by year. Each pin represents a key accomplishment, backed by icons and editable text for context. Perfect for end-of-year reviews or company retrospectives. Compatible with PowerPoint, Google Slides, and Canva.


6 diapositivas
COVID-19 Impact on Business Presentation
Visually communicate the key effects of the pandemic with this clean and engaging slide layout. Featuring a central storefront icon surrounded by six customizable virus-themed icons, this design allows you to outline critical changes, challenges, or strategic shifts. Ideal for presentations on crisis management, business continuity, or recovery planning. Fully editable in PowerPoint, Keynote, and Google Slides.


4 diapositivas
Strategic Business Objectives Framework
Showcase your company's top strategic goals with this clean and professional slide. Each briefcase icon represents a key business objective, perfect for planning, reporting, or investor updates. Fully customizable in PowerPoint, Keynote, and Google Slides.


7 diapositivas
Environmental Planning Infographic Presentation
Environmental infographics are an essential tool in raising awareness about the state of the environment and the impact of human activities on the planet. This template presents a broad range of data text on the environment for you to input. Use this eye-catching infographic design to educate and raise awareness about the environment. This template is ideal to give an overview of the topic, its importance and the main issues. Stay on track using facts and figures, good visuals and data visualizations. This presentation is easy to use and can be edited in Powerpoint, Keynote or Google Slides.


4 diapositivas
Real Estate and Housing Market Presentation
Turn market insights into visual stories that captivate investors and clients alike. This sleek and modern presentation helps you illustrate property trends, housing data, and real estate growth with clarity and confidence. Fully customizable and compatible with PowerPoint, Keynote, and Google Slides for easy editing and professional results.


8 diapositivas
Puzzle Piece Strategy Connection Presentation
Align your ideas with clarity using the Puzzle Piece Strategy Connection Presentation. This vertical puzzle layout visually connects four key steps, making it perfect for illustrating strategy alignment, workflow processes, or integrated systems. Easily editable in PowerPoint, Canva, or Google Slides—ideal for team briefings or strategic roadmaps.


4 diapositivas
Decision Analysis Framework Presentation
Make every choice smarter with this structured and visually balanced template designed to showcase options, outcomes, and key insights. Ideal for strategy meetings or data-driven reports, it helps you present decisions with confidence and clarity. Fully editable and compatible with PowerPoint, Keynote, and Google Slides for seamless customization.


4 diapositivas
Restaurant Menu Design Showcase Presentation
Showcase your food offerings with this stylish Restaurant Menu Design Template. Divided into clear sections—Menu, Drinks, and Desserts—it’s perfect for restaurants, cafés, or pop-up events. Fully editable in PowerPoint, Keynote, and Google Slides, this layout lets you present items cleanly with bold titles and organized structure for easy viewing.


4 diapositivas
4-Quadrant Empathy Map Presentation
Dive into your audience’s mindset with a clean, structured layout that brings clarity to what they see, feel, hear, and do. This presentation helps teams understand user behavior and motivations with simple quadrant-based insights. Fully compatible with PowerPoint, Keynote, and Google Slides.