


Características


¿Tienes alguna pregunta?
Recomendar


20 diapositivas
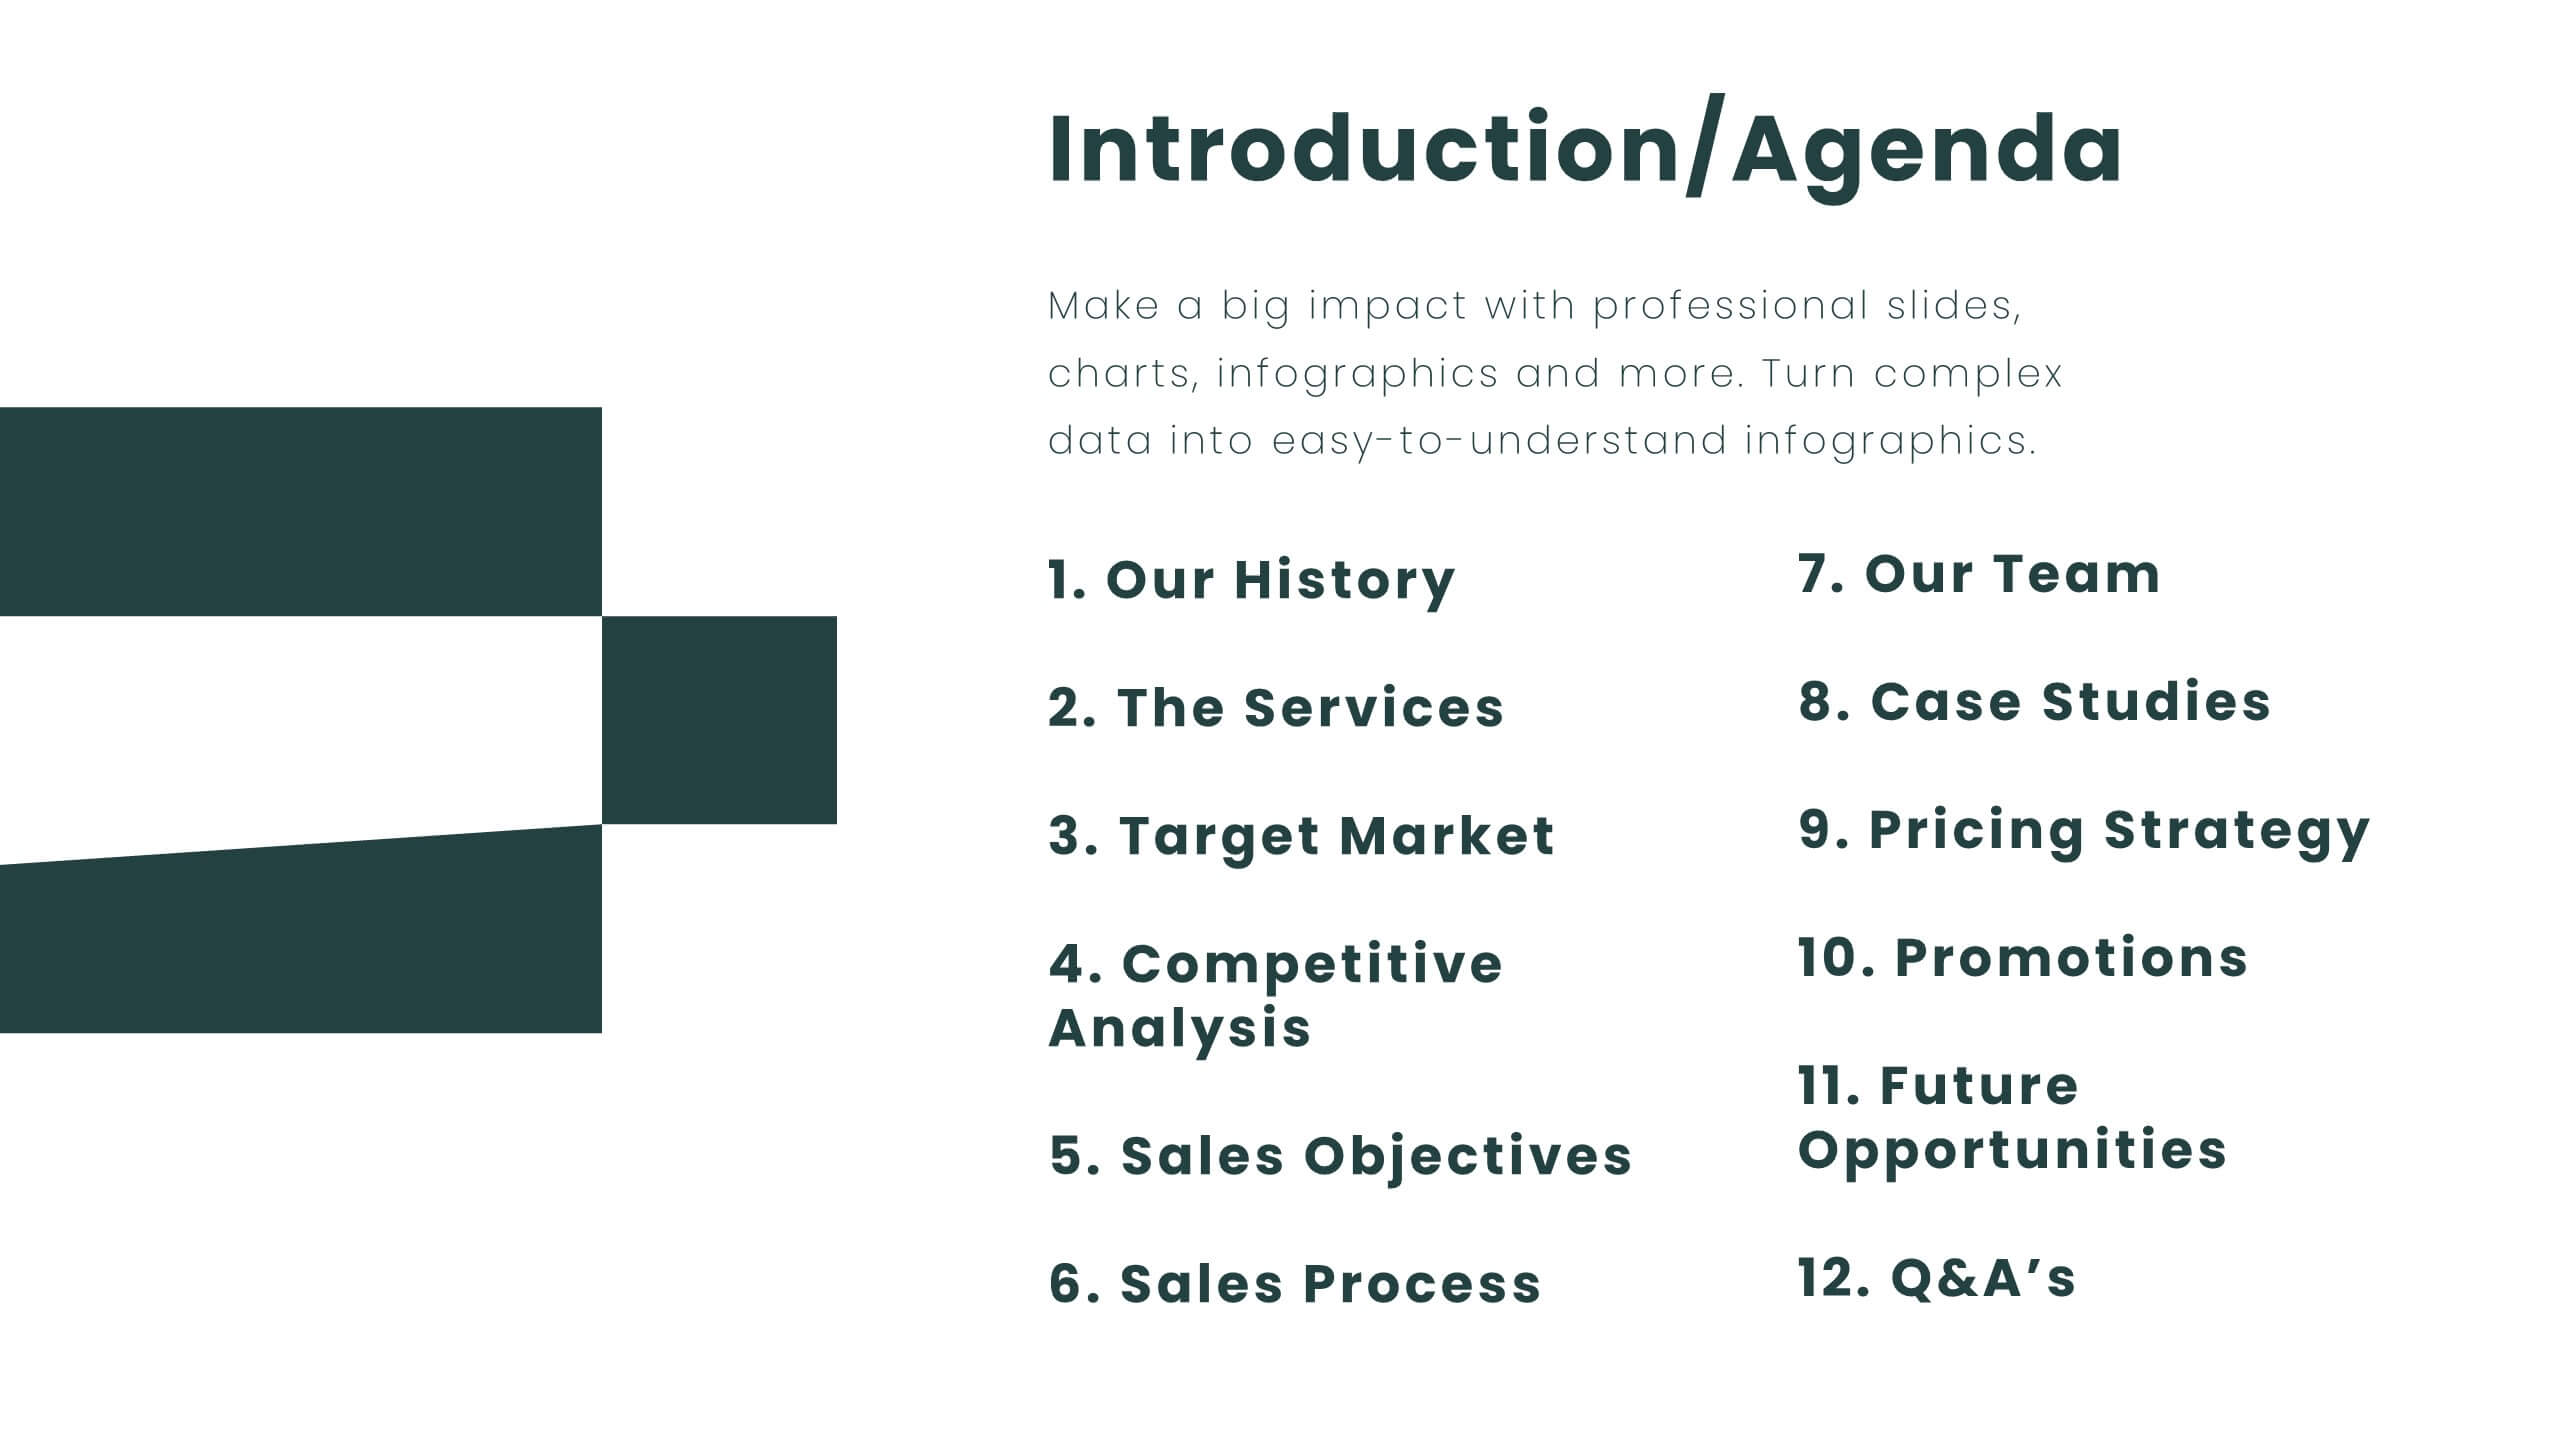
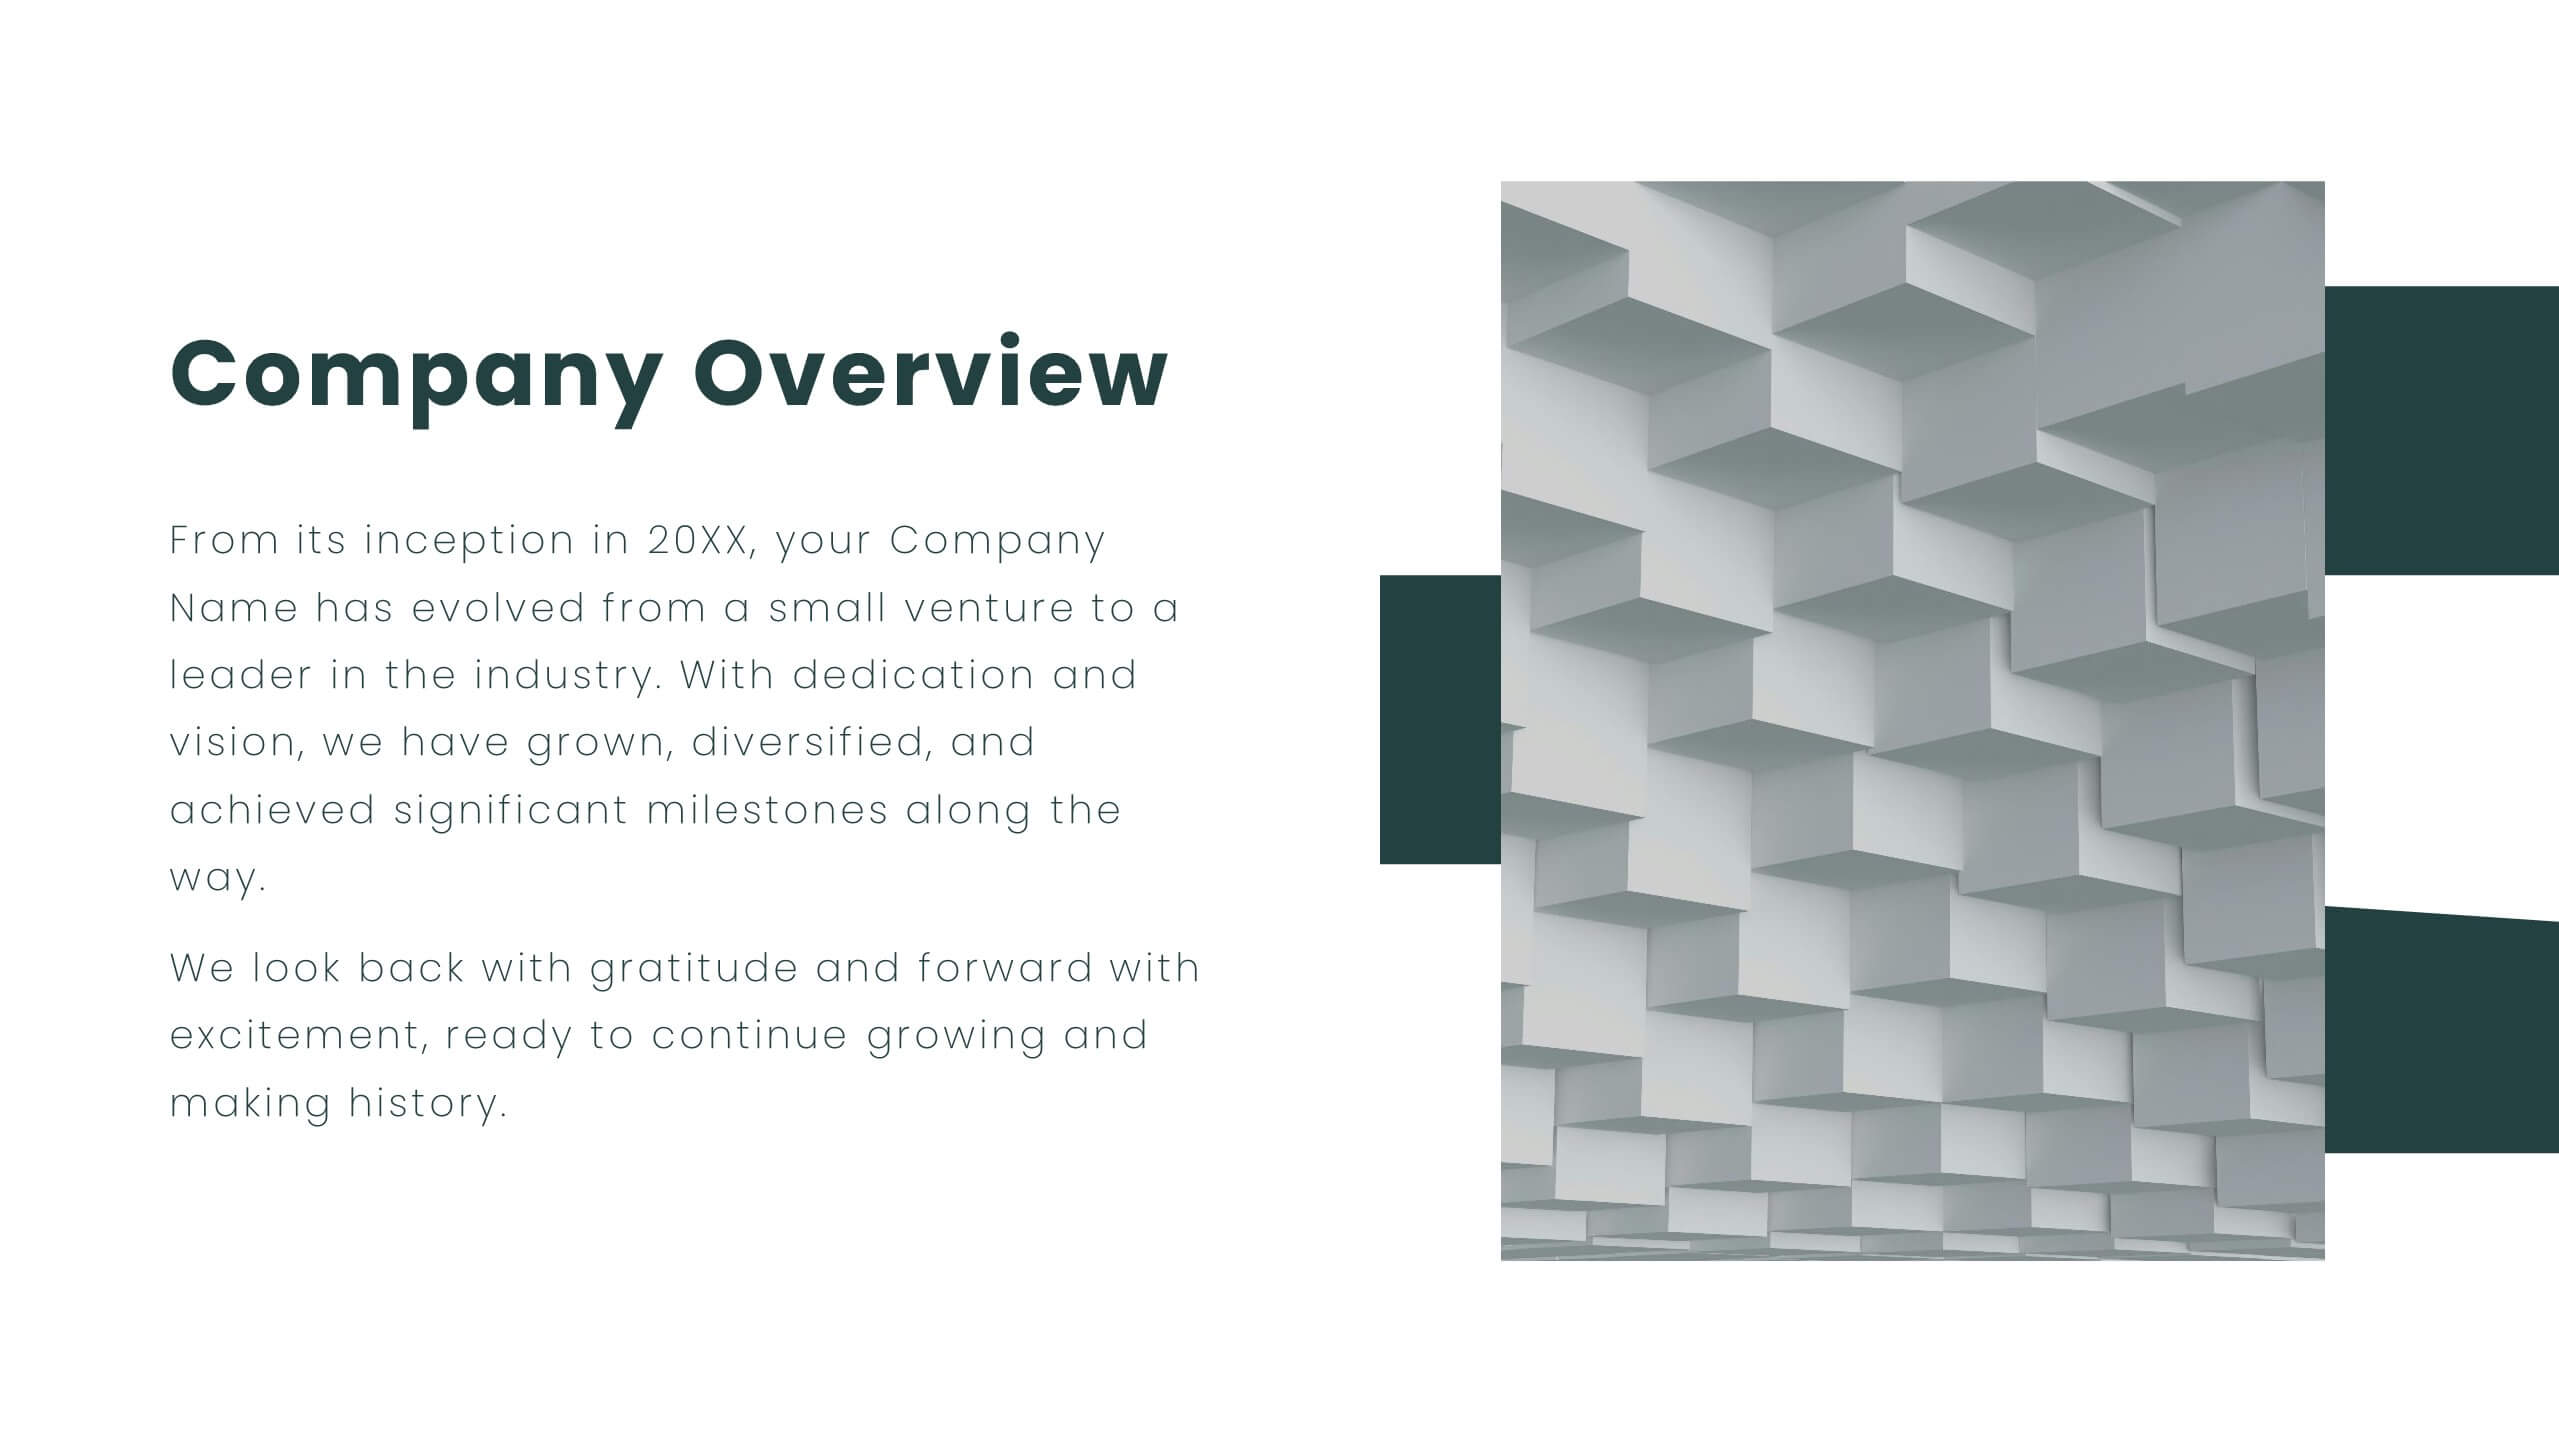
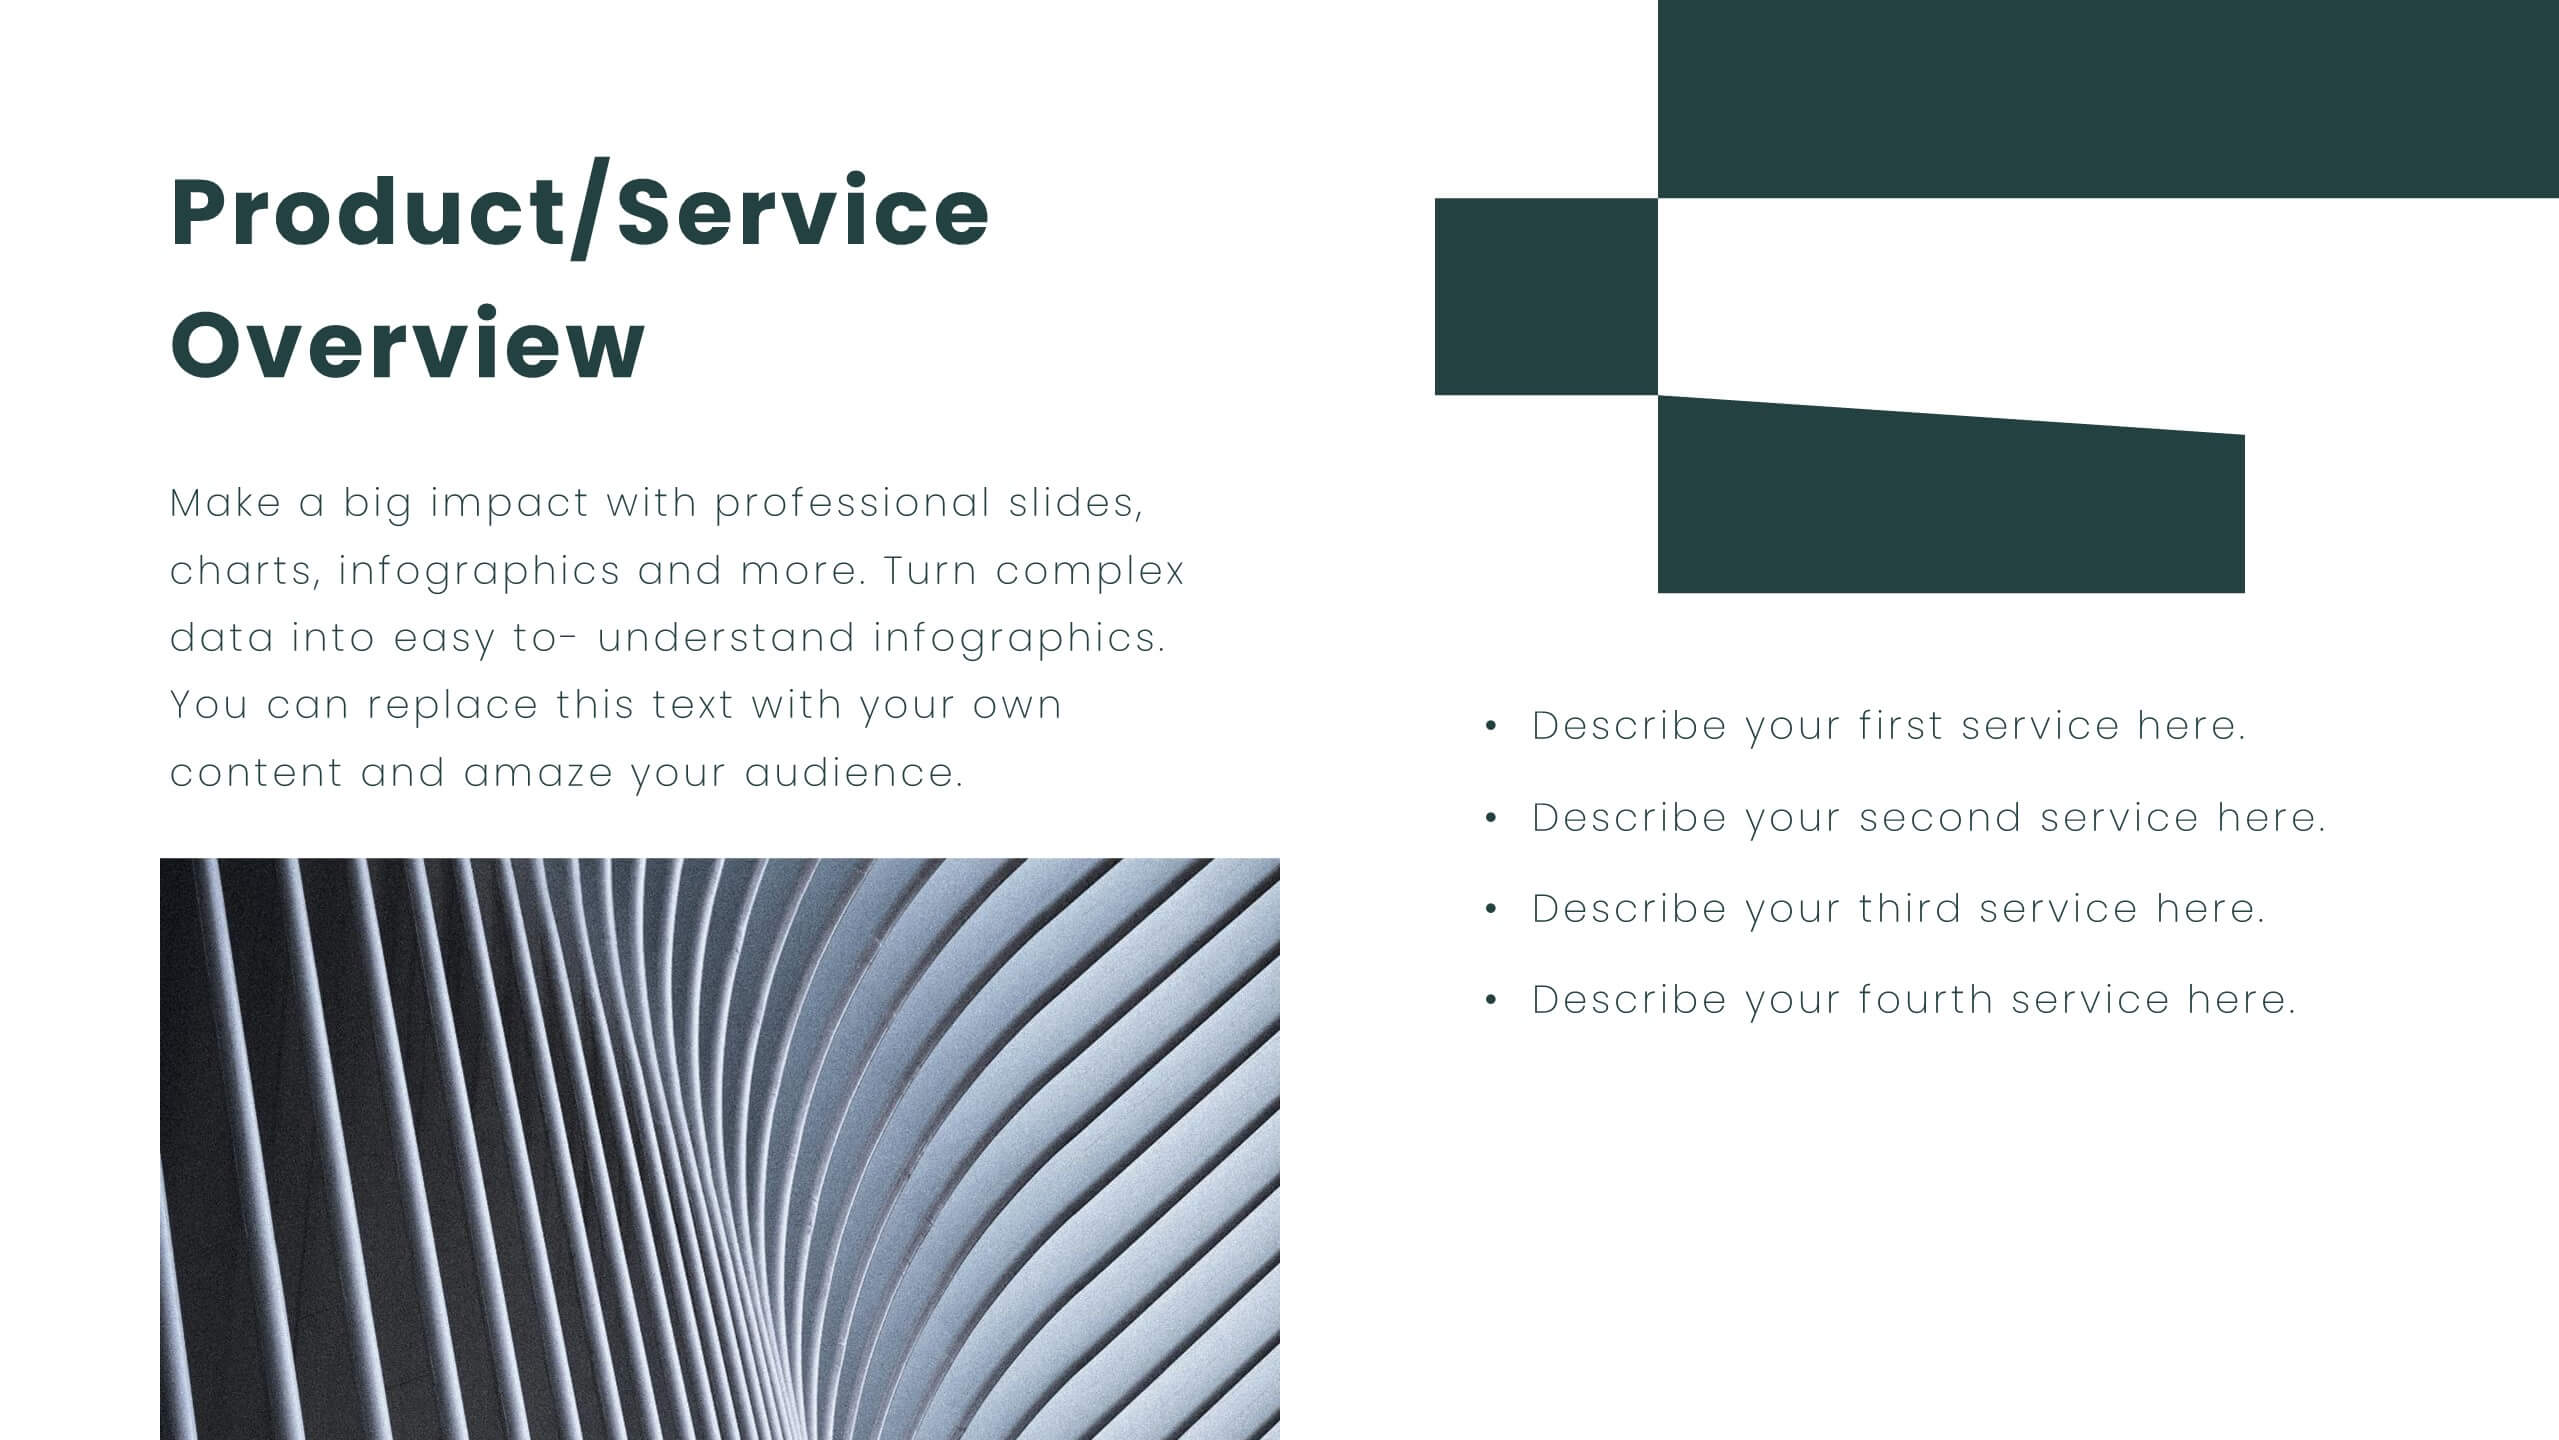
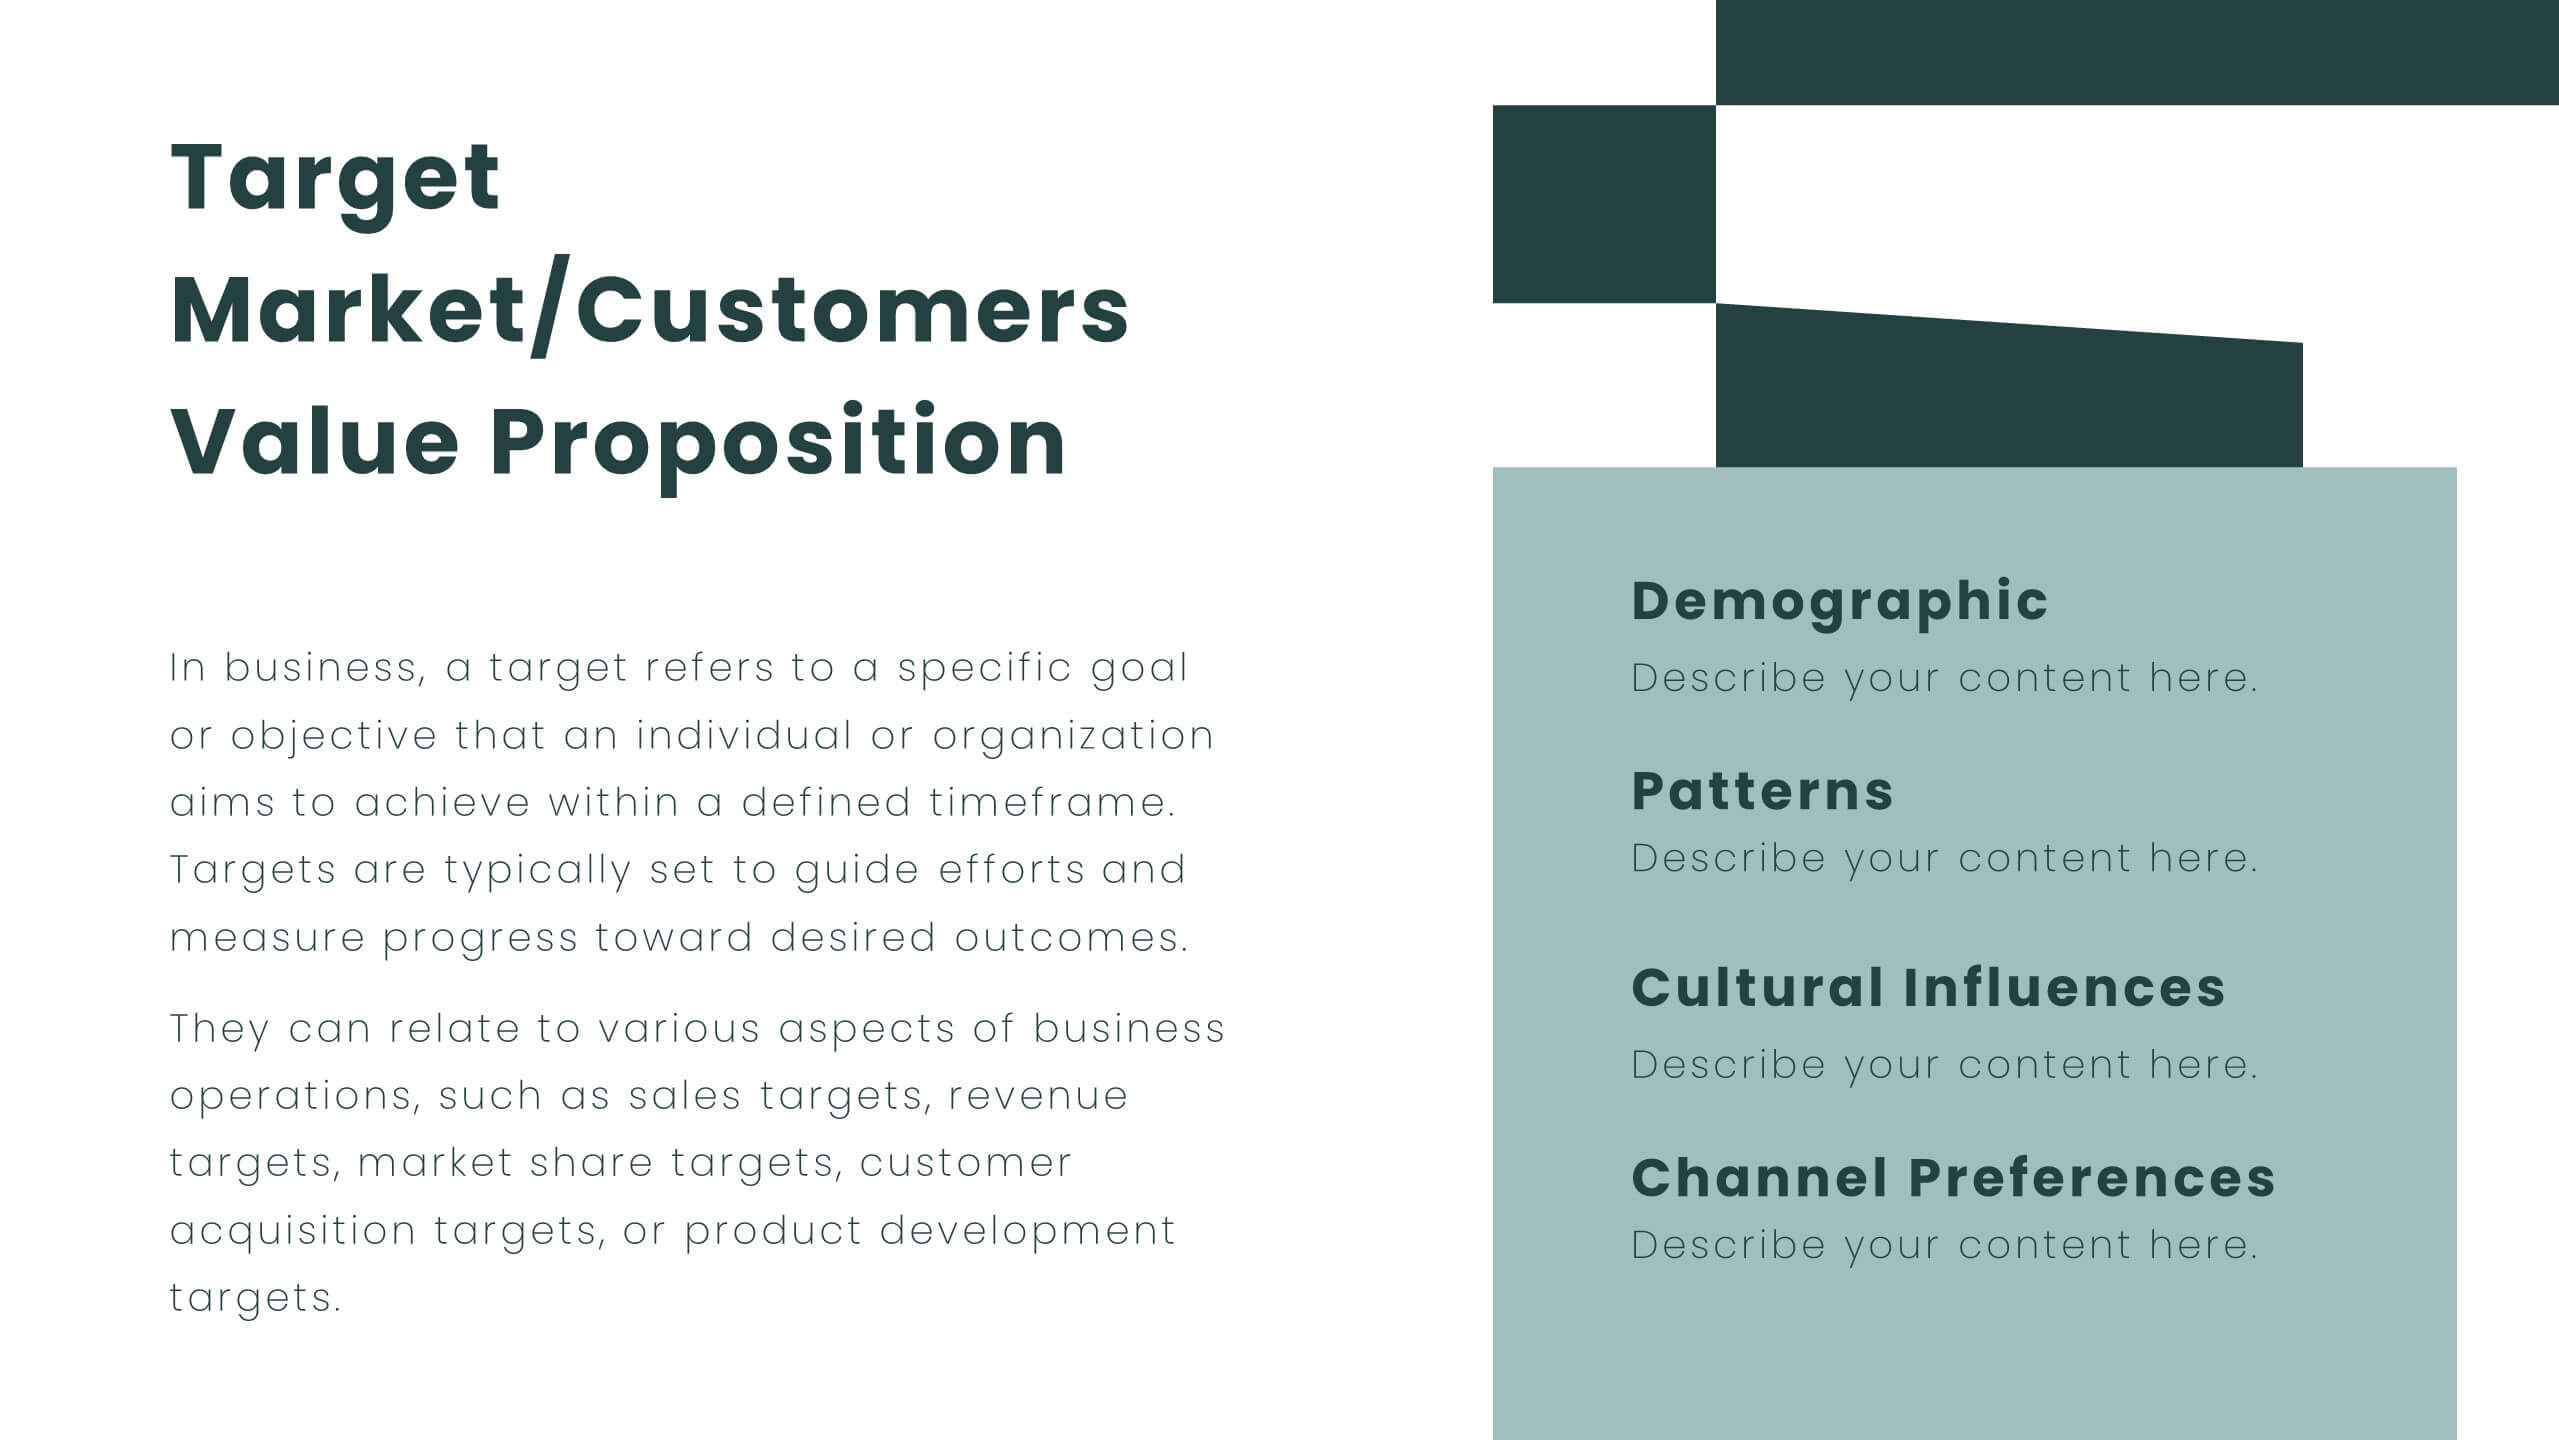
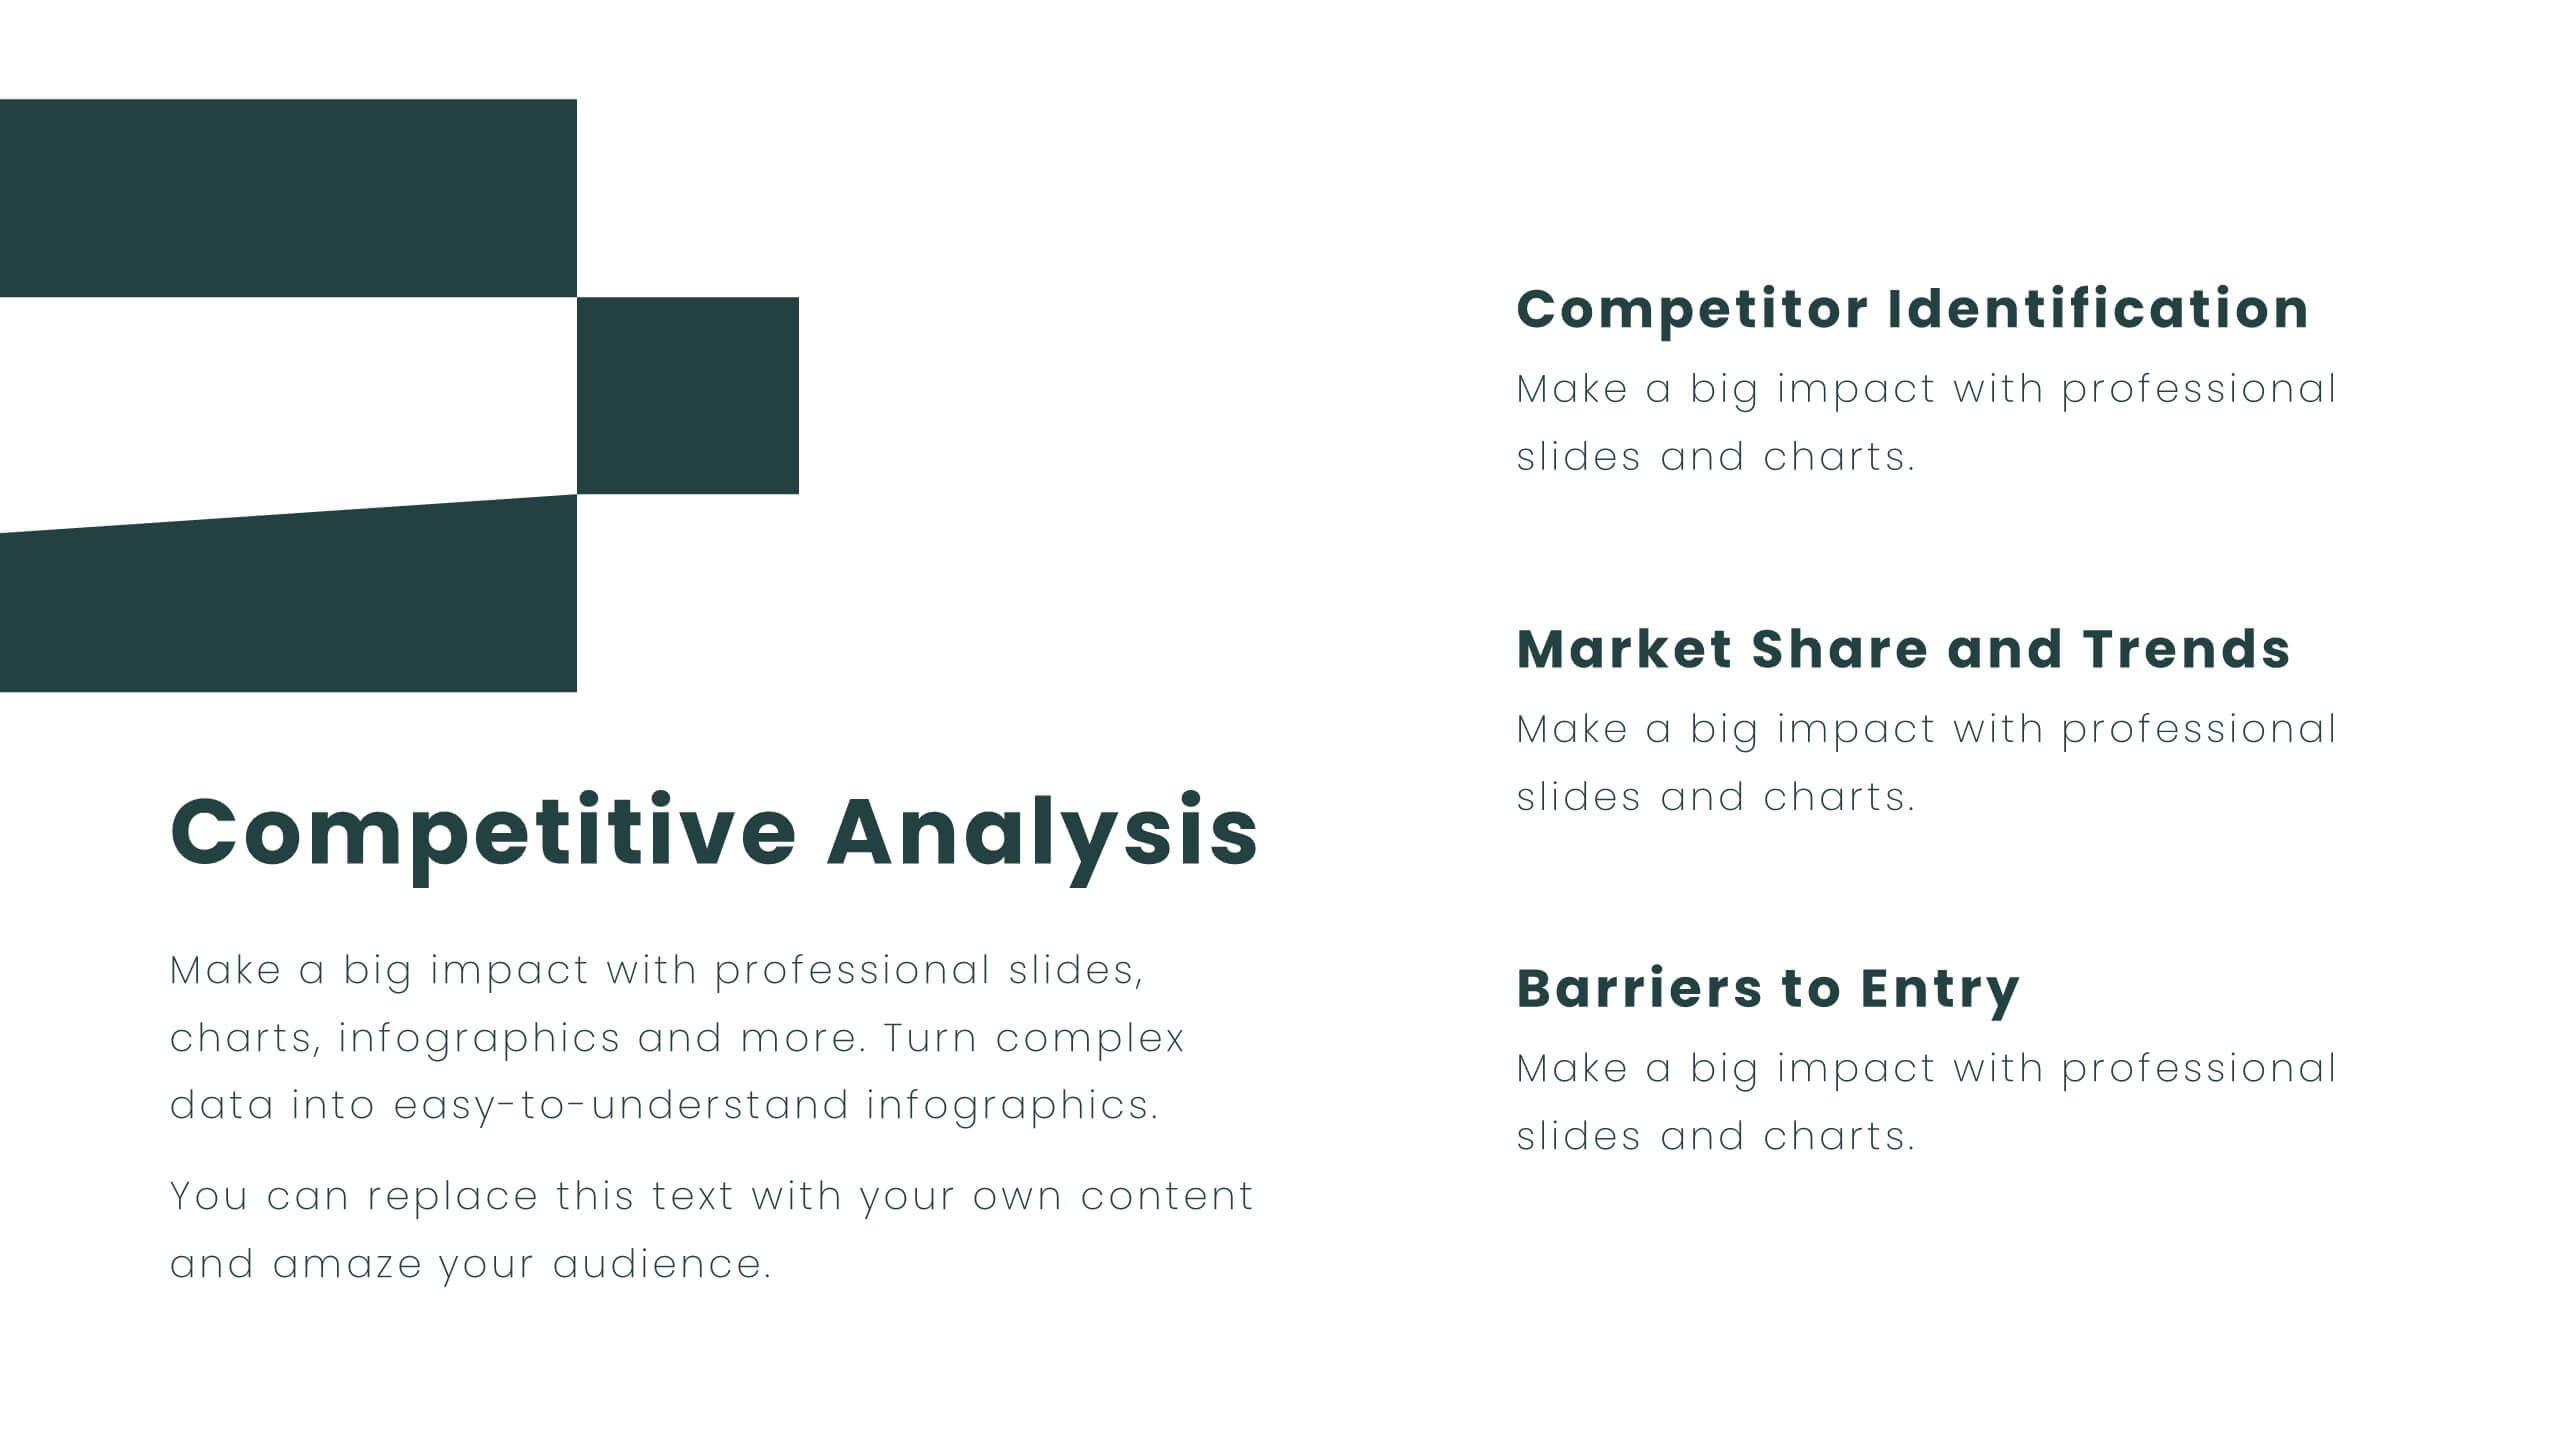
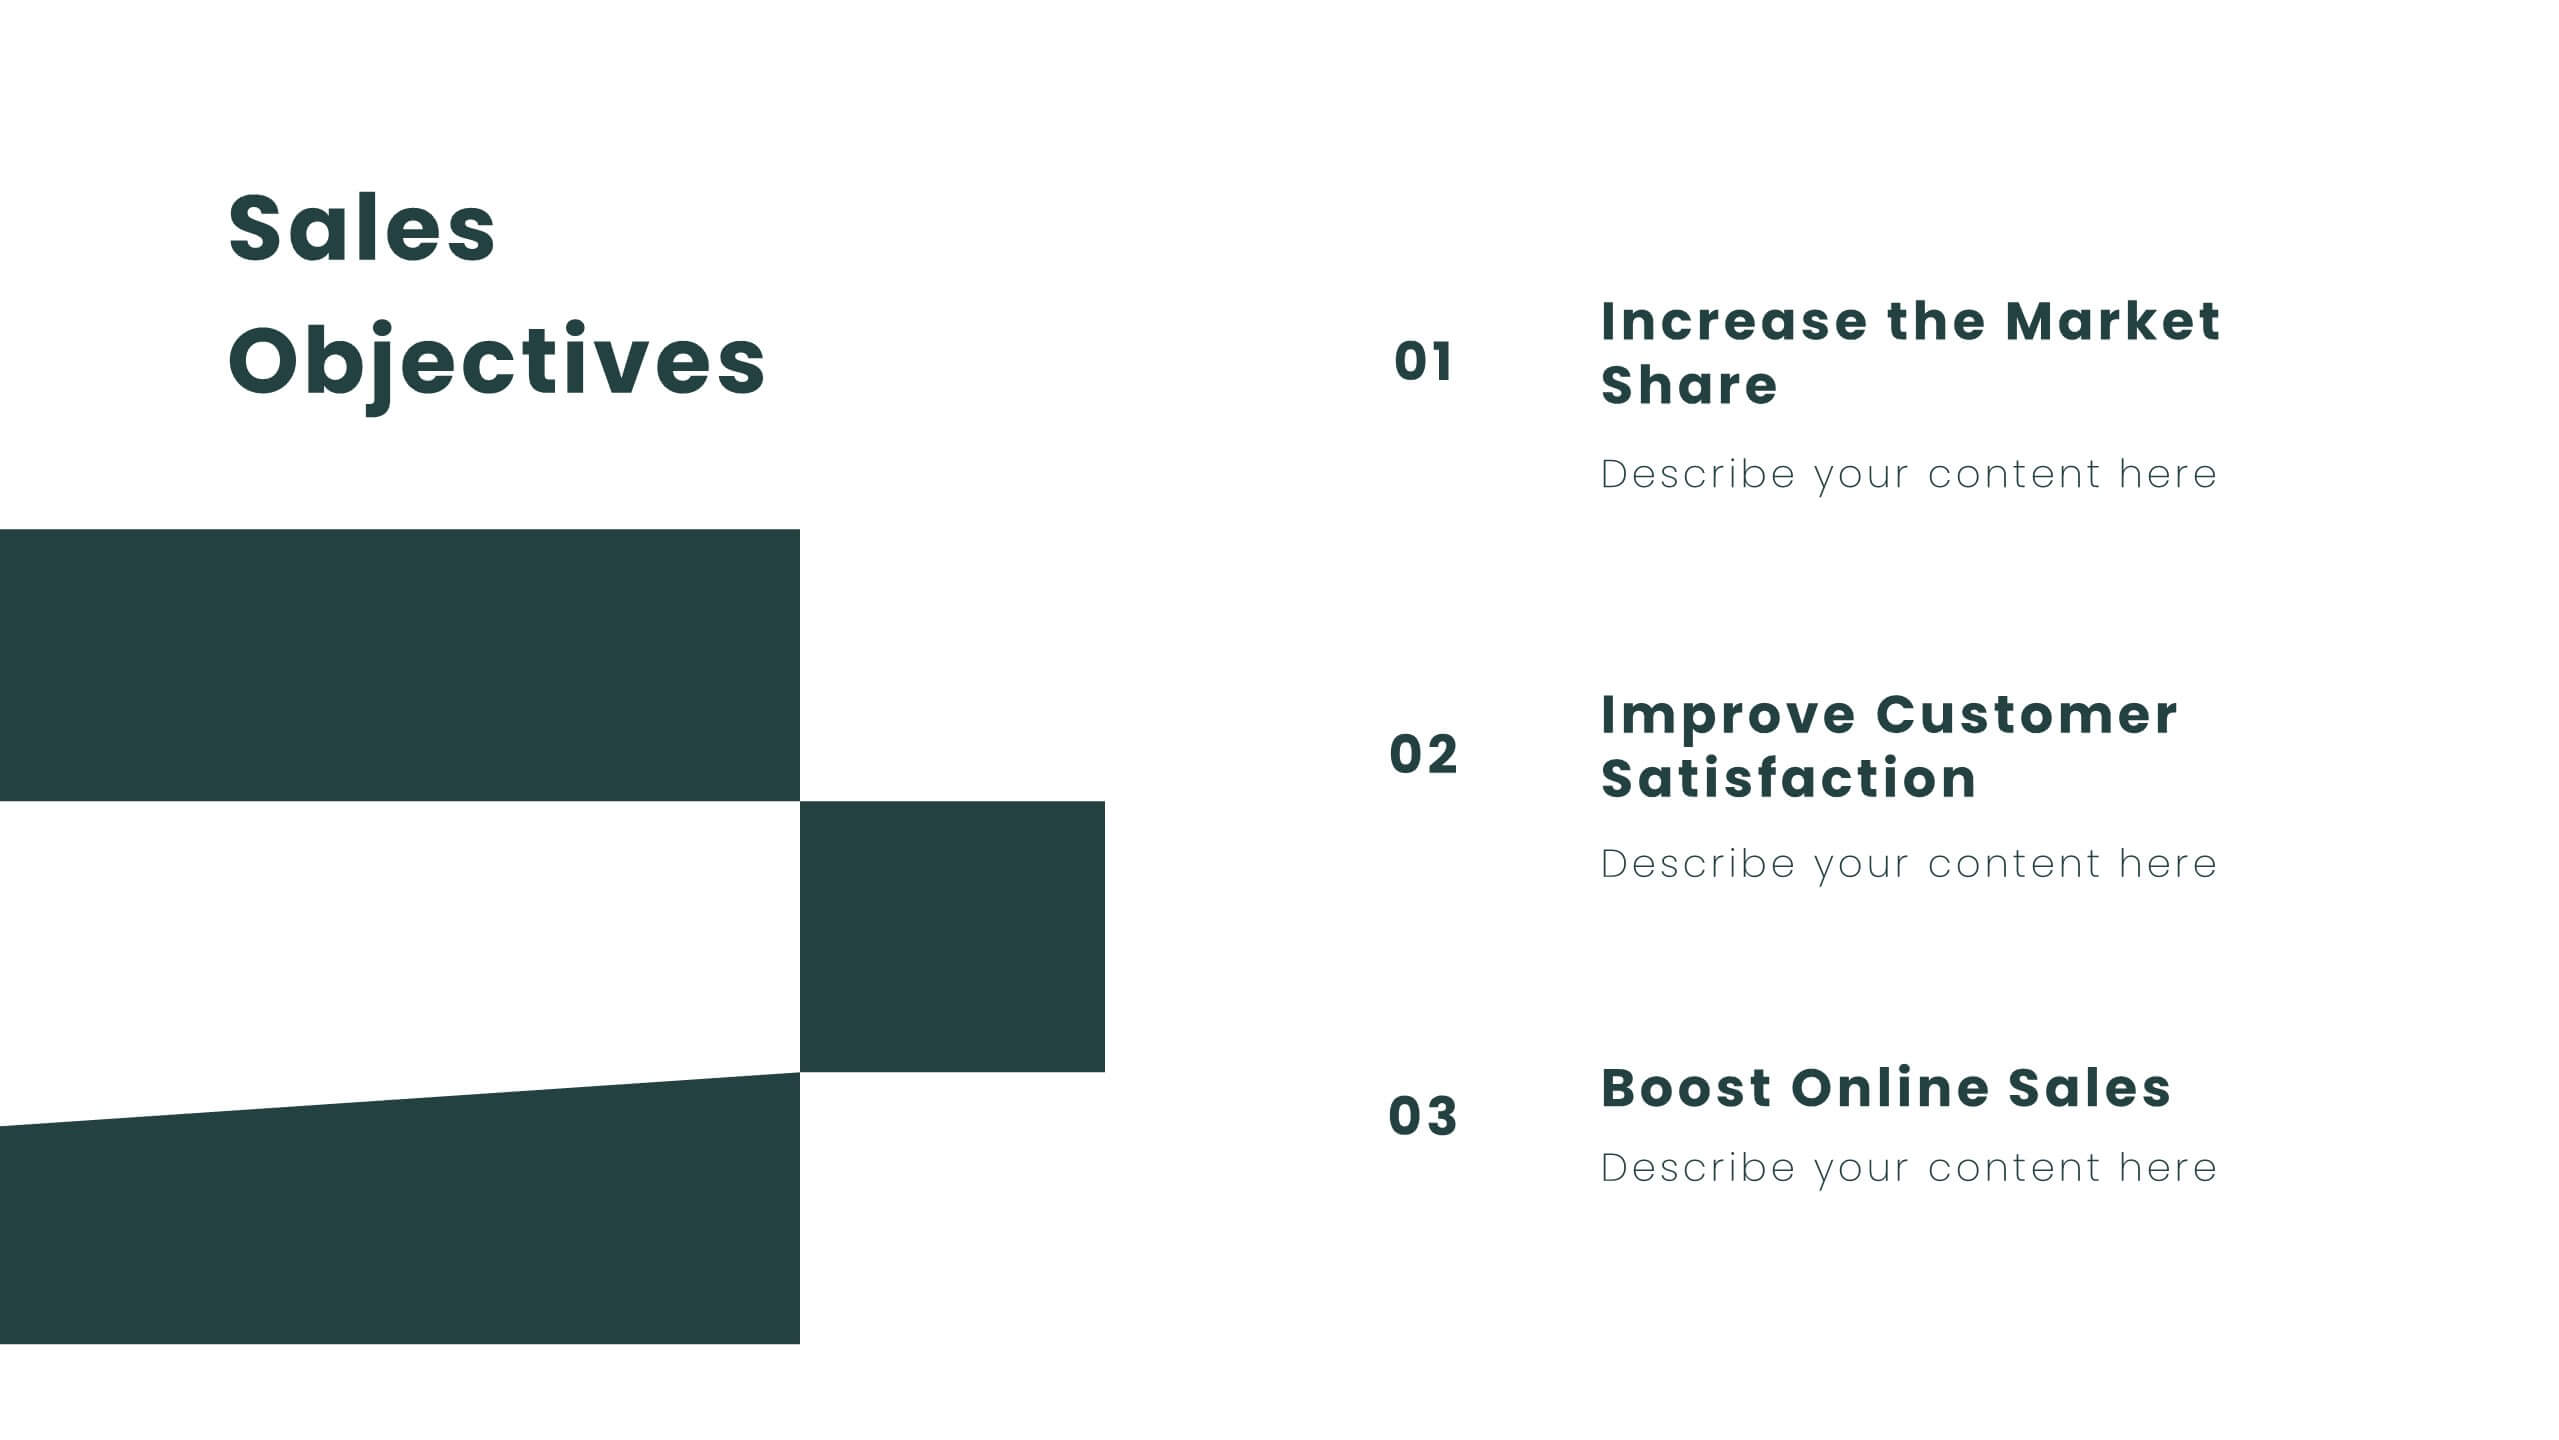
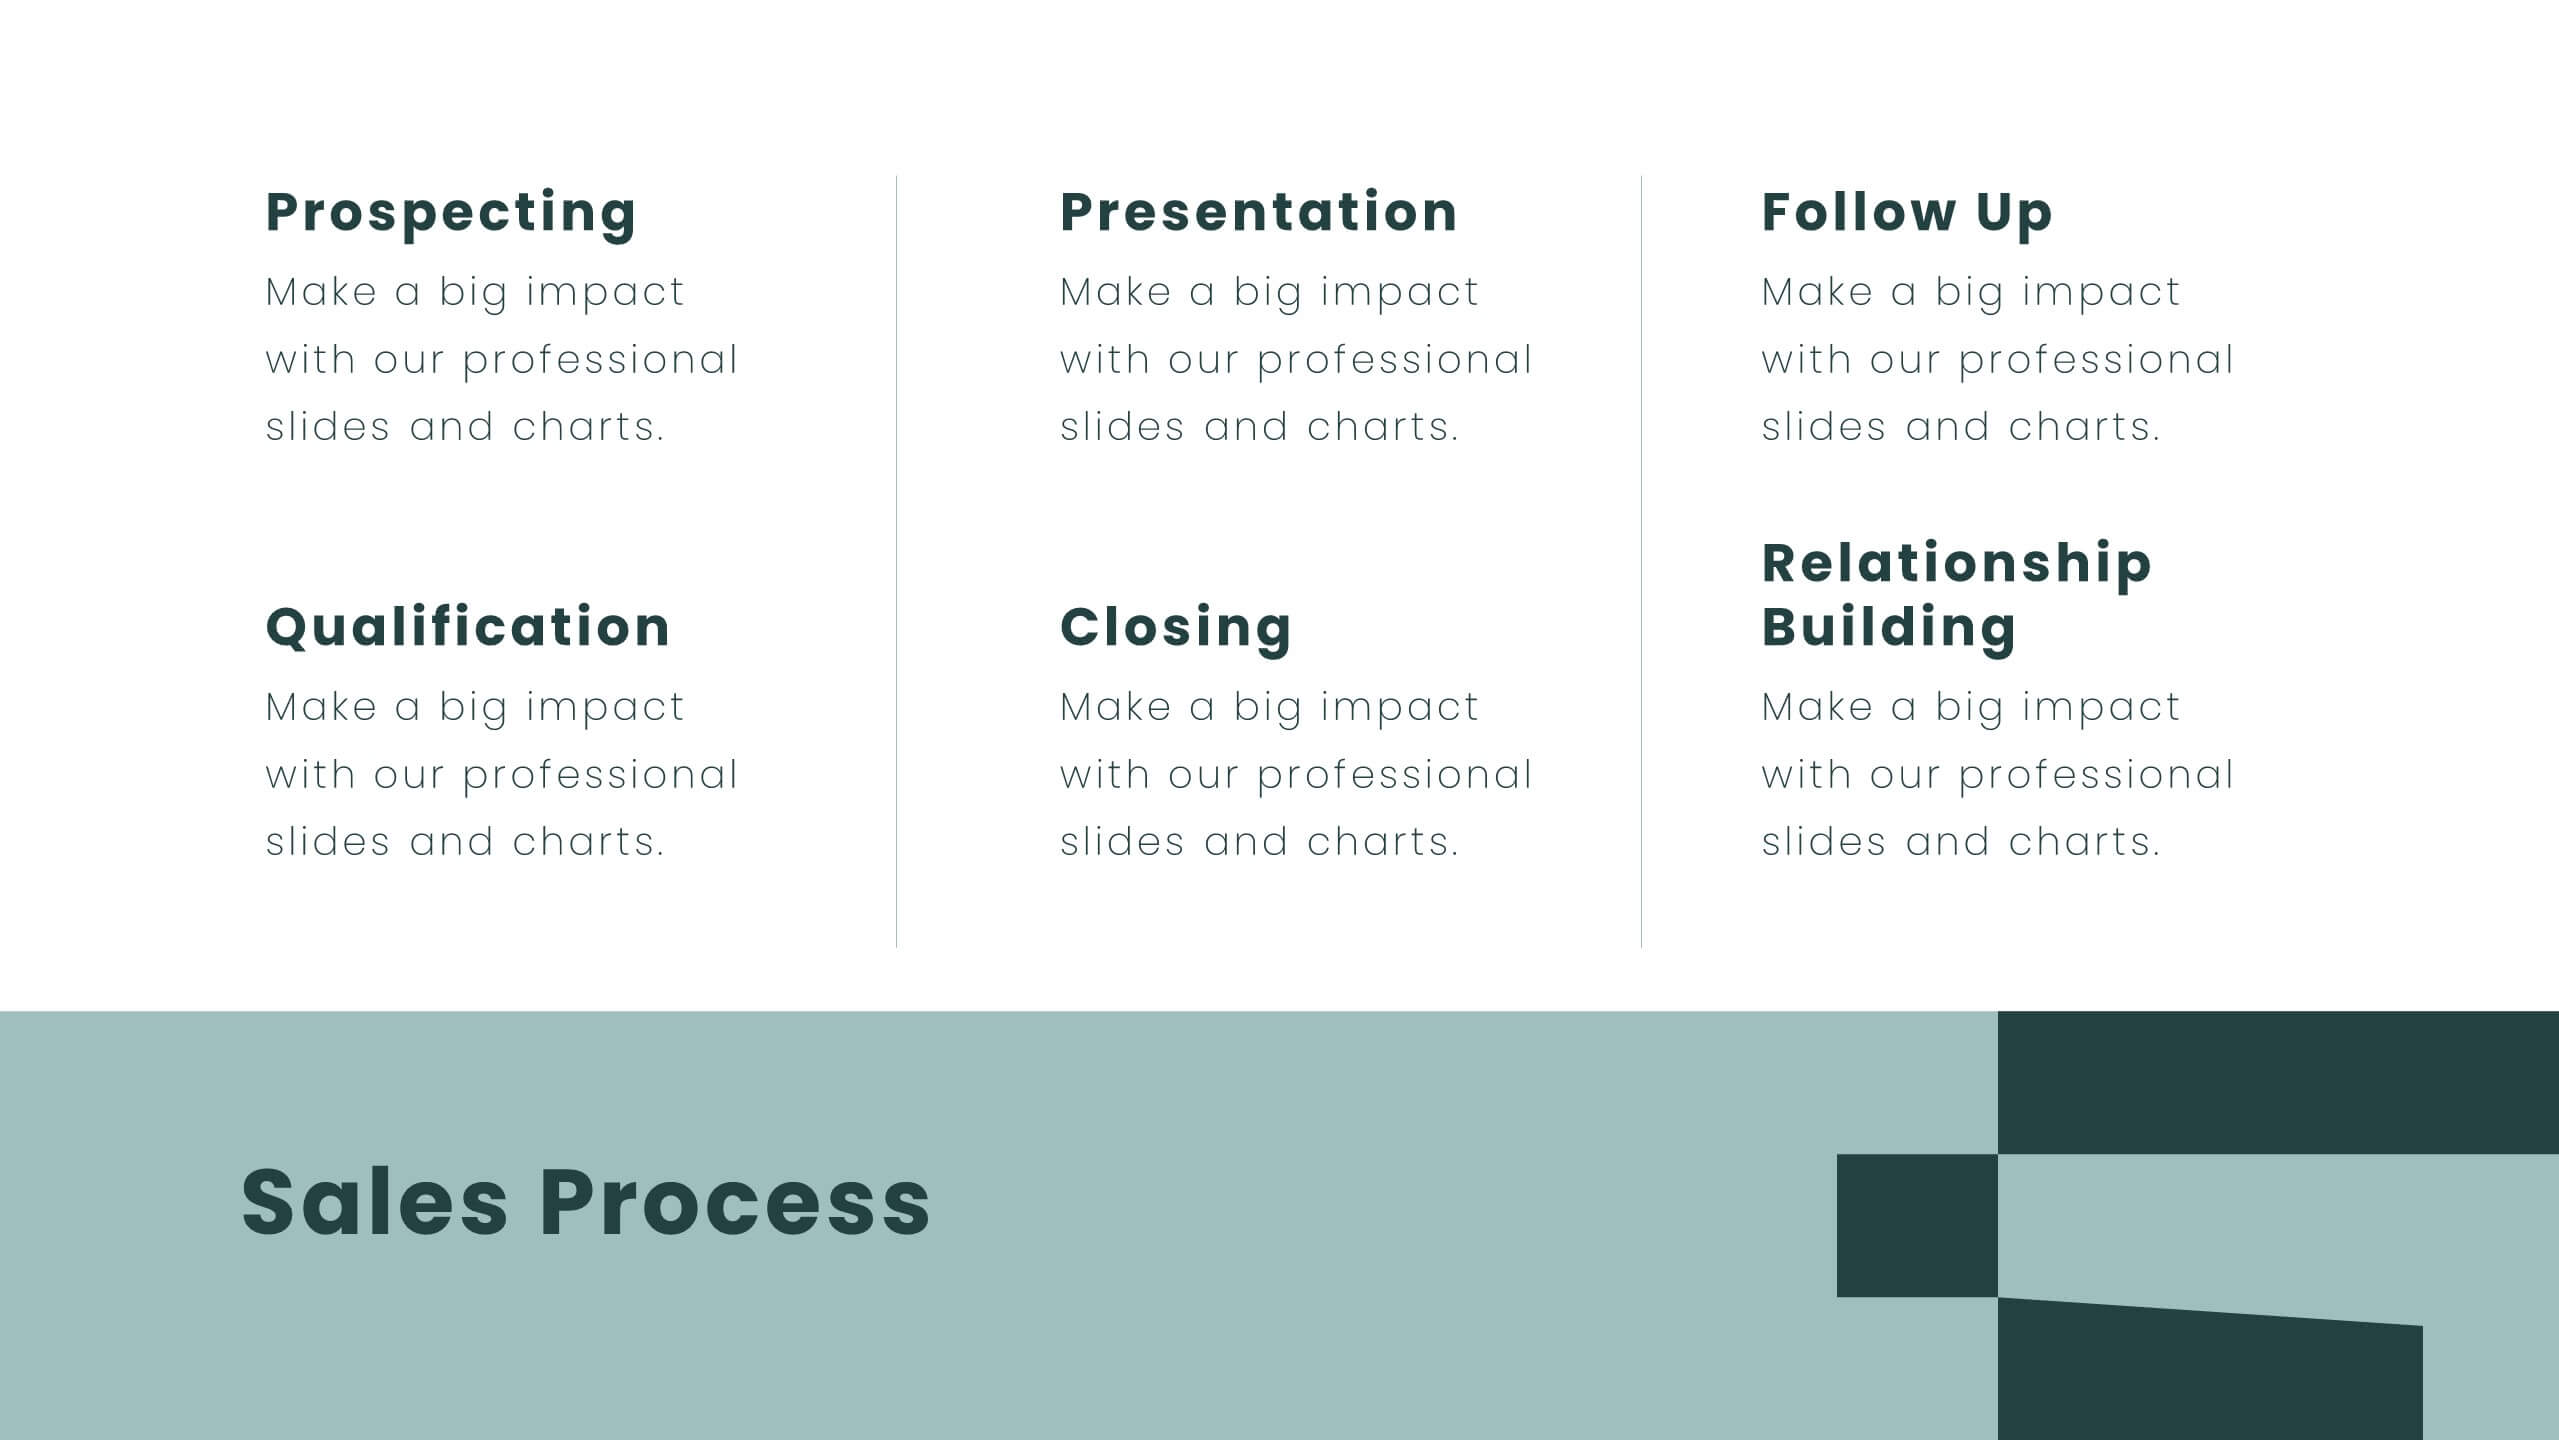
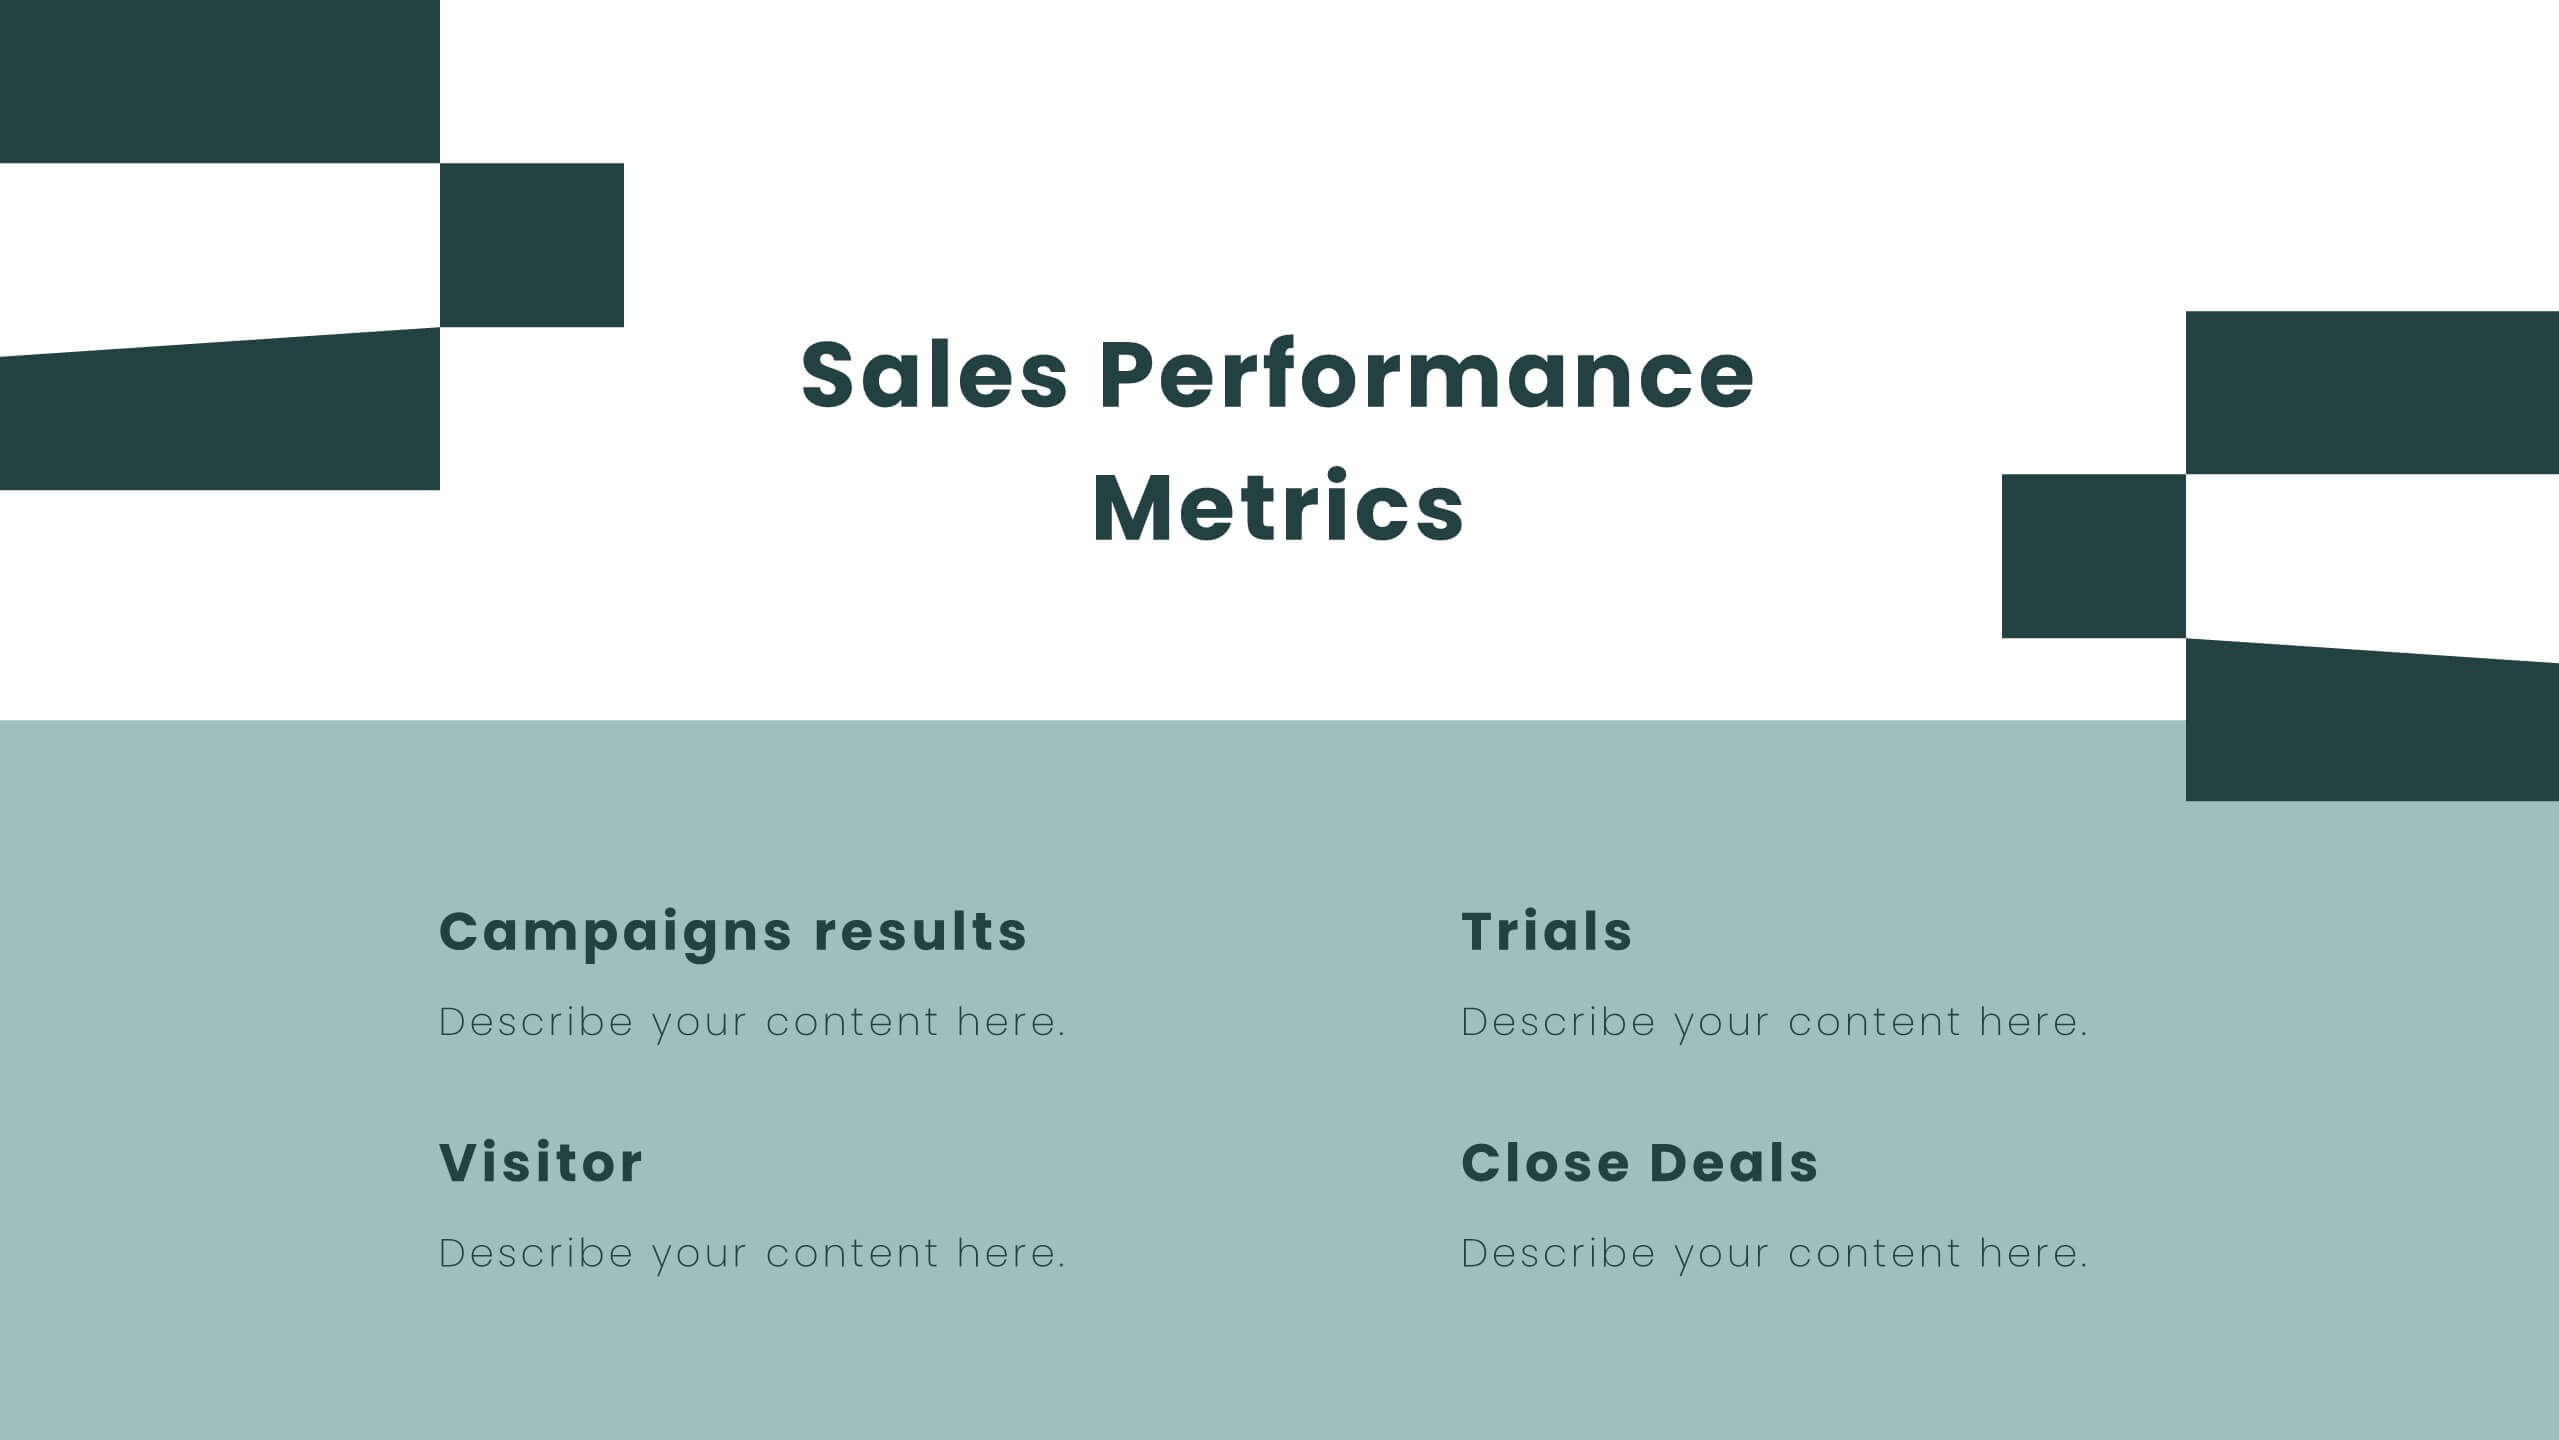
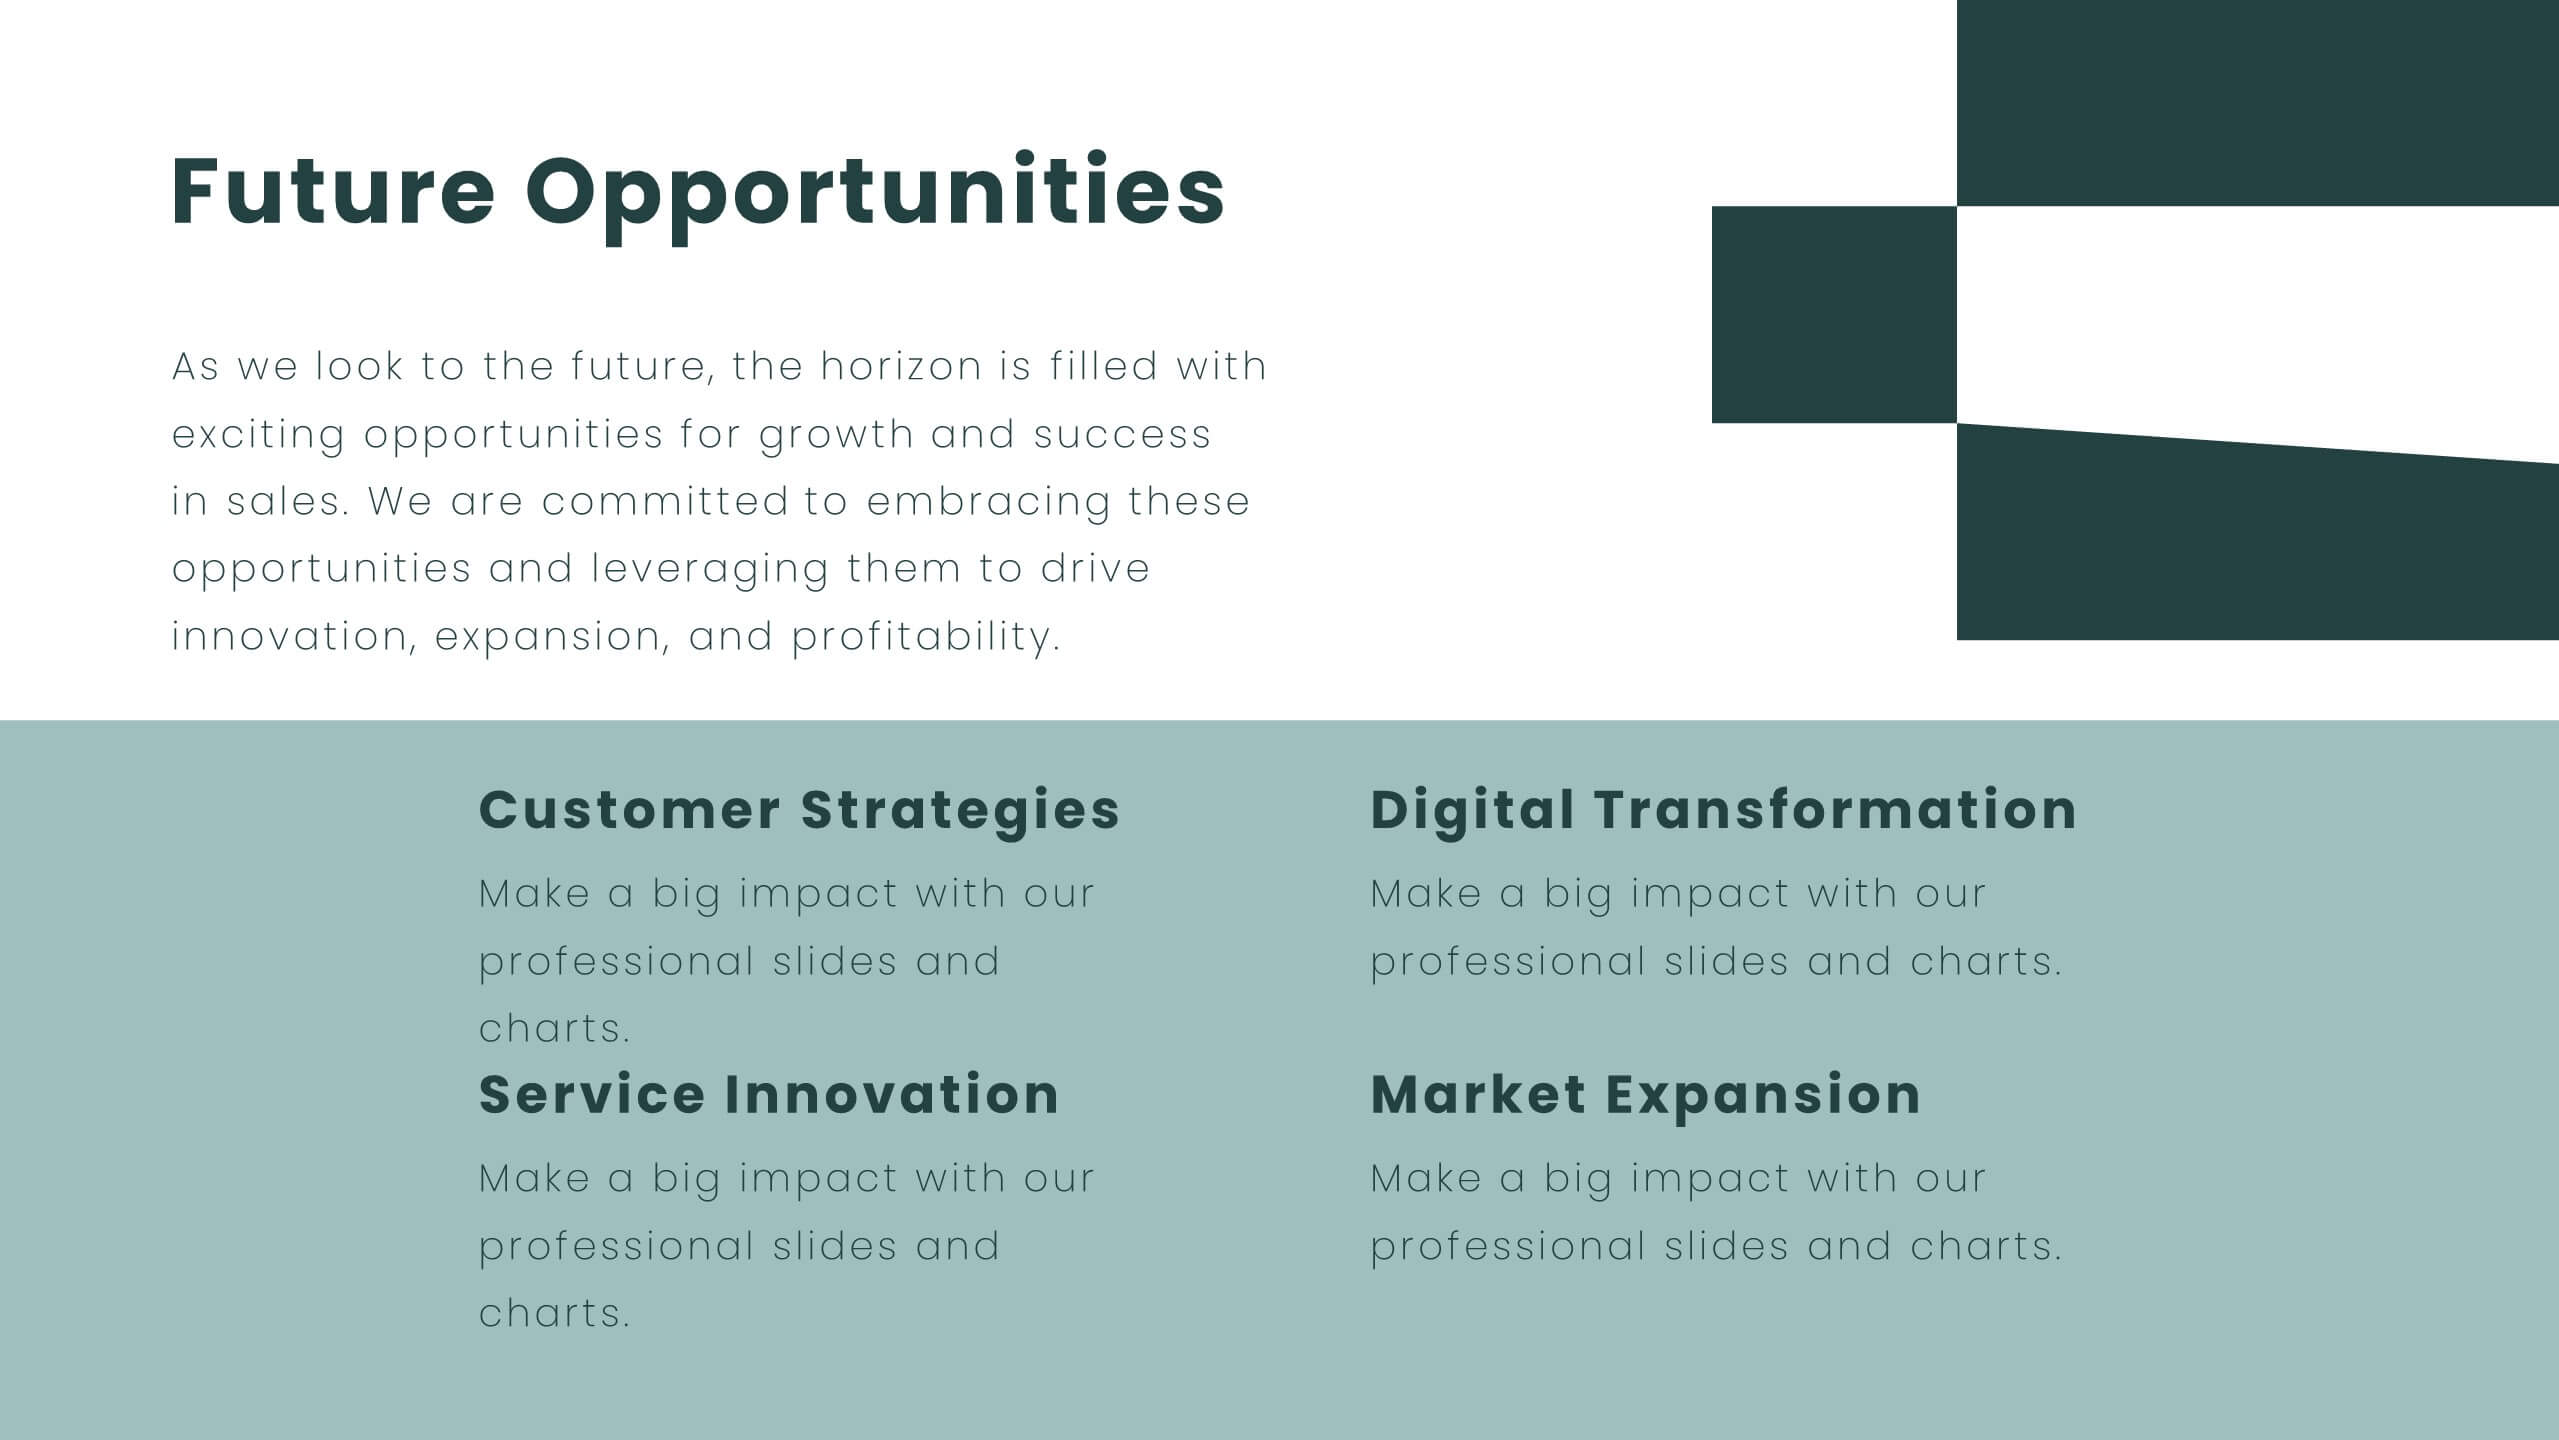
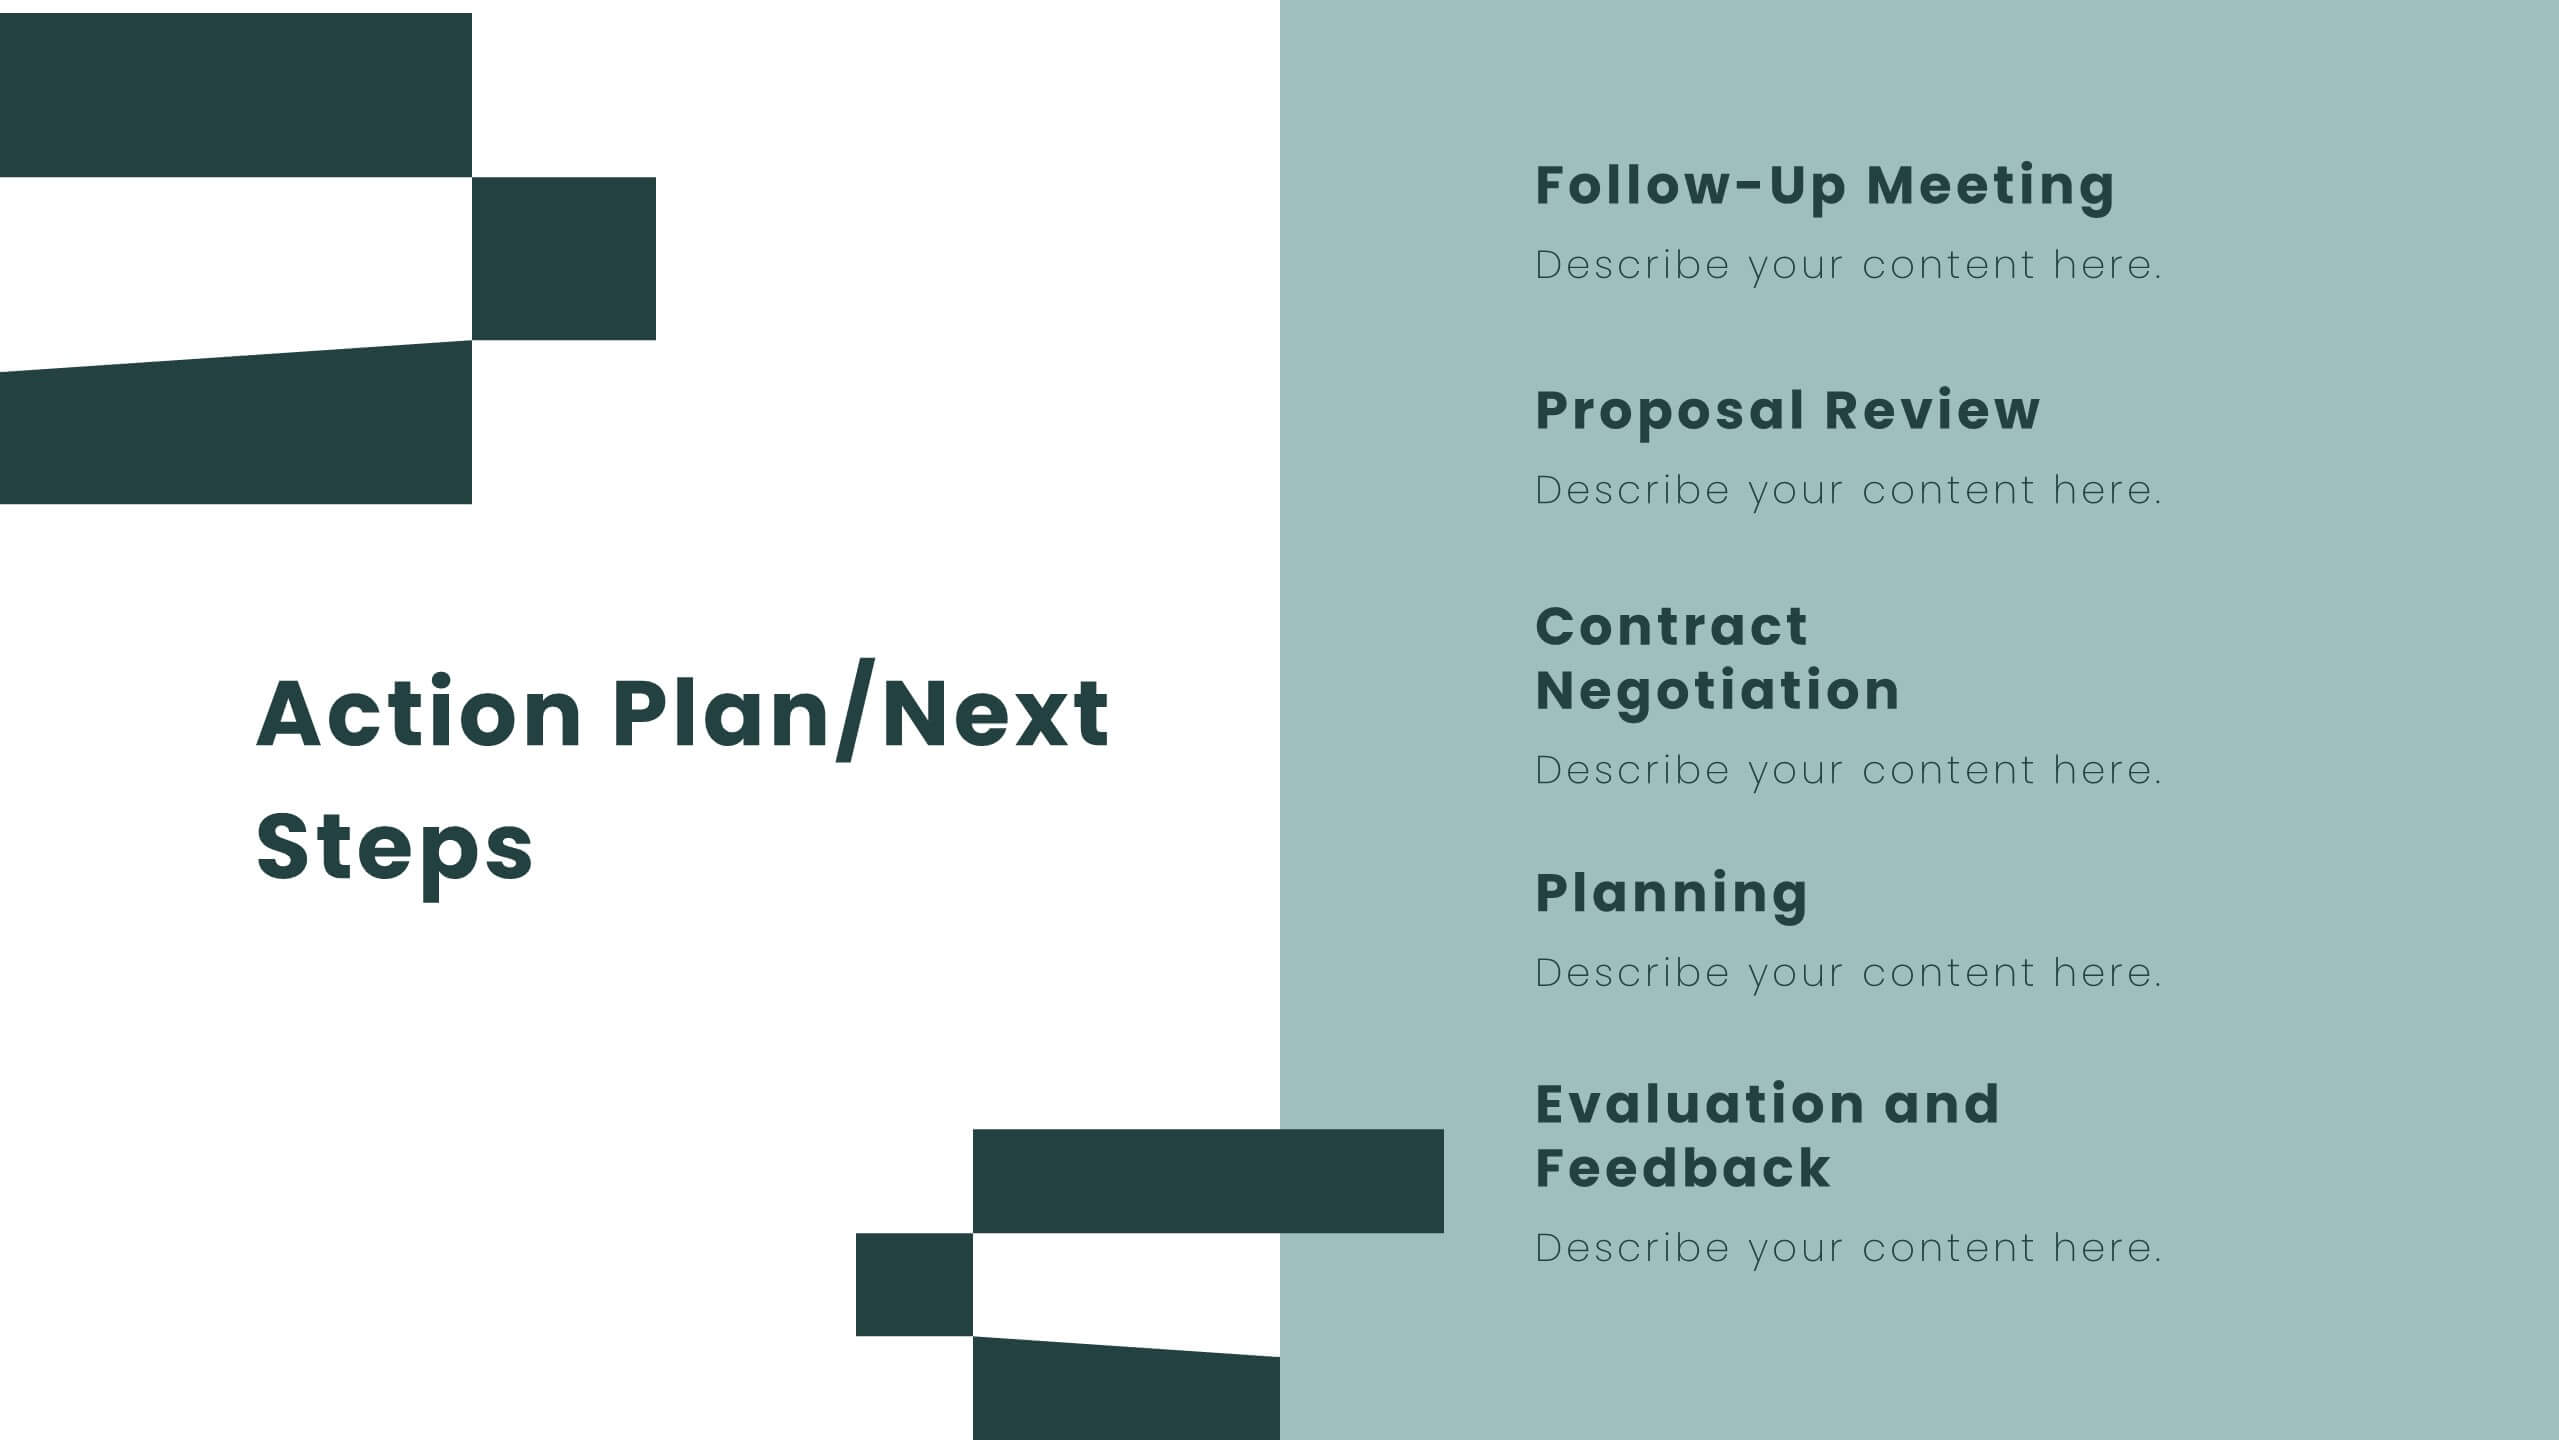
Radiant Sales Proposal Presentation
Elevate your pitch with this polished sales proposal template! Perfect for presenting company overviews, product/service details, and pricing strategies, it includes slides for competitive analysis and customer testimonials. Impress your audience with clear visuals and structured content. Compatible with PowerPoint, Keynote, and Google Slides for seamless presentations on any platform.


8 diapositivas
Lean Business Model Canvas Framework Presentation
Visualize your entire business strategy on a single slide with this Lean Business Model Canvas. Ideal for startups or strategic planning, each editable block represents a key area: value propositions, customer segments, revenue, and more. Streamlined and clear, it's perfect for team alignment or investor-ready business model pitches.


10 diapositivas
Business Growth and Market Statistics Presentation
Showcase key business growth trends and market insights with the "Business Growth and Market Statistics" presentation templates. These visuals are crafted to enhance clarity in communicating growth drivers, market dynamics, and performance metrics effectively. Ideal for corporate presentations, they're compatible with PowerPoint, Keynote, and Google Slides, ensuring a professional look across all platforms.


6 diapositivas
Revenue Growth Sales Slide Presentation
Showcase your business success with this Revenue Growth Sales Slide Presentation. The upward-curved arrow design highlights five key milestones, each with customizable titles, icons, and color accents. Perfect for illustrating sales performance, growth metrics, or financial forecasts. Easy to edit in PowerPoint, Keynote, or Google Slides—ideal for sales teams, analysts, and executives.


5 diapositivas
Business Process Workflow Presentation
Make your business processes crystal clear with this streamlined, modern layout. Designed to visualize every stage from start to success, this presentation helps communicate progress, efficiency, and key actions with precision. Perfect for business planning or reporting, it’s fully compatible with PowerPoint, Keynote, and Google Slides for easy customization.


20 diapositivas
Spectrum Graphic Design Project Plan Presentation
The Graphic Design Project Plan Presentation Template includes 20 clean and modern slides, tailored for creative professionals. It guides you through key design stages like audience targeting, design brief, elements, moodboards, prototypes, and project timelines. Featuring bold typography, engaging visuals, and a sleek black-and-yellow color palette, this template ensures clarity and style. Compatible with PowerPoint, Keynote, and Google Slides, it's fully editable to fit any design project.
5 diapositivas
Key Milestone Tracker for Projects Presentation
Track project progress and celebrate wins with the Key Milestone Tracker for Projects Presentation. This template features a vertical flow of trophy icons embedded in hexagons, each representing a major milestone. Ideal for showcasing achievements, timelines, or key phases in a project lifecycle. Fully customizable and compatible with PowerPoint, Keynote, and Google Slides.


6 diapositivas
Six Sigma DMAIC Method Presentation
Bring clarity and momentum to your improvement plan with this dynamic presentation, designed to visually guide teams through each stage of a structured problem-solving process. It helps you present goals, insights, and actions with confidence while keeping the workflow clear and engaging. Fully compatible with PowerPoint, Keynote, and Google Slides.


7 diapositivas
Africa Population Infographic Presentation
An Africa Map infographic is a visual representation of the African continent, highlight its geography, population, culture, history, and other relevant information. This template provides a quick and easy way to understand complex information about the continent and make data more accessible and engaging to your audience. Use this template to include information about Africa's major cities, landmarks, natural resources, and cultural traditions. This template can be easily customized and modified to suit your specific needs, edit and highlight specific countries, regions, or data points.


23 diapositivas
Cosmira Digital Strategy Presentation
This Digital Strategy Presentation provides a comprehensive framework for outlining business objectives, competitive analysis, and growth opportunities. It includes key sections such as SWOT analysis, performance metrics, and implementation plans. Ideal for businesses and marketers, the slides are fully editable and compatible with PowerPoint, Keynote, and Google Slides.


7 diapositivas
Iceberg Model Infographic Presentation
Iceberg diagrams are versatile, multi-purpose infographics that can be used to show all the factors that will affect your company. It is a great way to visualize information and organize it into one place. With this template, you’ll have the perfect way to analyze your vision and drive growth. The iceberg is used to divide and give detailed information that can be valuable in planning your strategy. Analyze, evaluate and provide data on a specific product or service. This eye-catching template is compatible with PowerPoint, Keynote and Google Slides and includes customizable photo layouts.


6 diapositivas
Stages of Product Life Cycle Infographics
Visualize the stages of a product's life cycle with our customizable infographic template. This template is fully compatible with popular presentation software like PowerPoint, Keynote, and Google Slides, allowing you to easily customize it to illustrate and communicate the key phases of a product's life cycle. The Stages of Product Life Cycle infographic template offers a visually engaging platform to depict the various stages, including introduction, growth, maturity, and decline. Whether you're a product manager, marketer, business owner, or student, this template provides a user-friendly canvas to create informative presentations and educational materials. Enhance your understanding of product life cycles with this SEO-optimized infographic template, thoughtfully designed for clarity and ease of use. Customize it to showcase the characteristics, strategies, and challenges associated with each stage, helping you make informed decisions about your products and their market positioning. Start crafting your personalized infographic today to explore the dynamic nature of the product life cycle.


5 diapositivas
Law and Criminal Justice Infographics
Law and Criminal Justice are two interconnected fields that encompass the study, enforcement, and administration of laws and regulations within a society. These vertical infographic templates provide an overview of key concepts, statistics, and information related to the field of law and criminal justice. It is designed to educate and inform the audience about various aspects of the legal system and the criminal justice process. These infographics will allow you to provide a comprehensive overview of the law and criminal justice system. Easily customizable and compatible with Powerpoint, Keynote, and Google Slides.


6 diapositivas
12-Month Business Timeline Presentation
Jump into a year of planning with a crisp, colorful layout that makes every month feel organized and actionable. This presentation helps you map goals, deadlines, and initiatives across all four quarters, offering a clear structure for business planning and progress tracking. Fully compatible with PowerPoint, Keynote, and Google Slides.


20 diapositivas
Cascade Detailed Project Execution Plan Presentation
Embark on your next big project with confidence using the Cascade Project Plan template! This visually stunning and meticulously designed template is perfect for laying out the roadmap for any project, whether it's launching a new product or managing a complex initiative. The template features sections for project overview, scope of work, budget breakdown, and risk management, ensuring every aspect of your project is thoroughly covered. Its clean and modern design allows you to present your ideas with clarity, while the customizable slides offer the flexibility to tailor the presentation to your specific needs. With dedicated slides for stakeholder analysis, resource allocation, and timeline milestones, this template helps you keep all parties informed and aligned. Compatible with PowerPoint, Keynote, and Google Slides, the Cascade Project Plan template is your ultimate tool for professional and effective project management presentations. Get ready to impress your team and stakeholders with a well-organized and impactful presentation!


5 diapositivas
Online Education Training Presentation
Present your digital learning programs with this Online Education Training Presentation. The visual layout highlights a central computer screen connected to key e-learning components, making it perfect for explaining course structures, virtual classroom tools, or distance learning workflows. Designed for trainers, educators, or edtech professionals. Fully editable in PowerPoint, Keynote, and Google Slides.


5 diapositivas
AIDA Digital Marketing Infographics
Immerse yourself in the dynamic world of digital marketing with our AIDA digital marketing infographics. This template, drenched in striking cream, red, and blue hues, adopts a vertical design, perfect for professionals, marketers, and educators looking to elucidate the renowned AIDA model (Attention, Interest, Desire, Action). Each section is enriched with creative graphics, icons, and image placeholders, simplifying complex marketing strategies into digestible visual narratives. It's the quintessential tool for captivating presentations, compelling marketing pitches, or educational materials in digital marketing workshops.