


Features
- 6 Unique slides
- Fully editable and easy to edit in Microsoft Powerpoint, Keynote and Google Slides
- 16:9 widescreen layout
- Clean and professional designs
- Export to JPG, PDF or send by email


Do you have any questions?
Recommend


8 slides
Breast Cancer Research and Support Presentation
Dive into the pivotal world of healthcare with the Breast Cancer Research and Support template. This presentation emphasizes the critical aspects of breast cancer research and community support, providing a deep exploration of both scientific advancements and compassionate outreach. Suitable for PowerPoint, Keynote, and Google Slides, it effectively highlights statistical data, support resources, and key information with easy-to-understand graphics and dedicated spaces for comprehensive details, ideal for educational sessions and health advocacy meetings.


22 slides
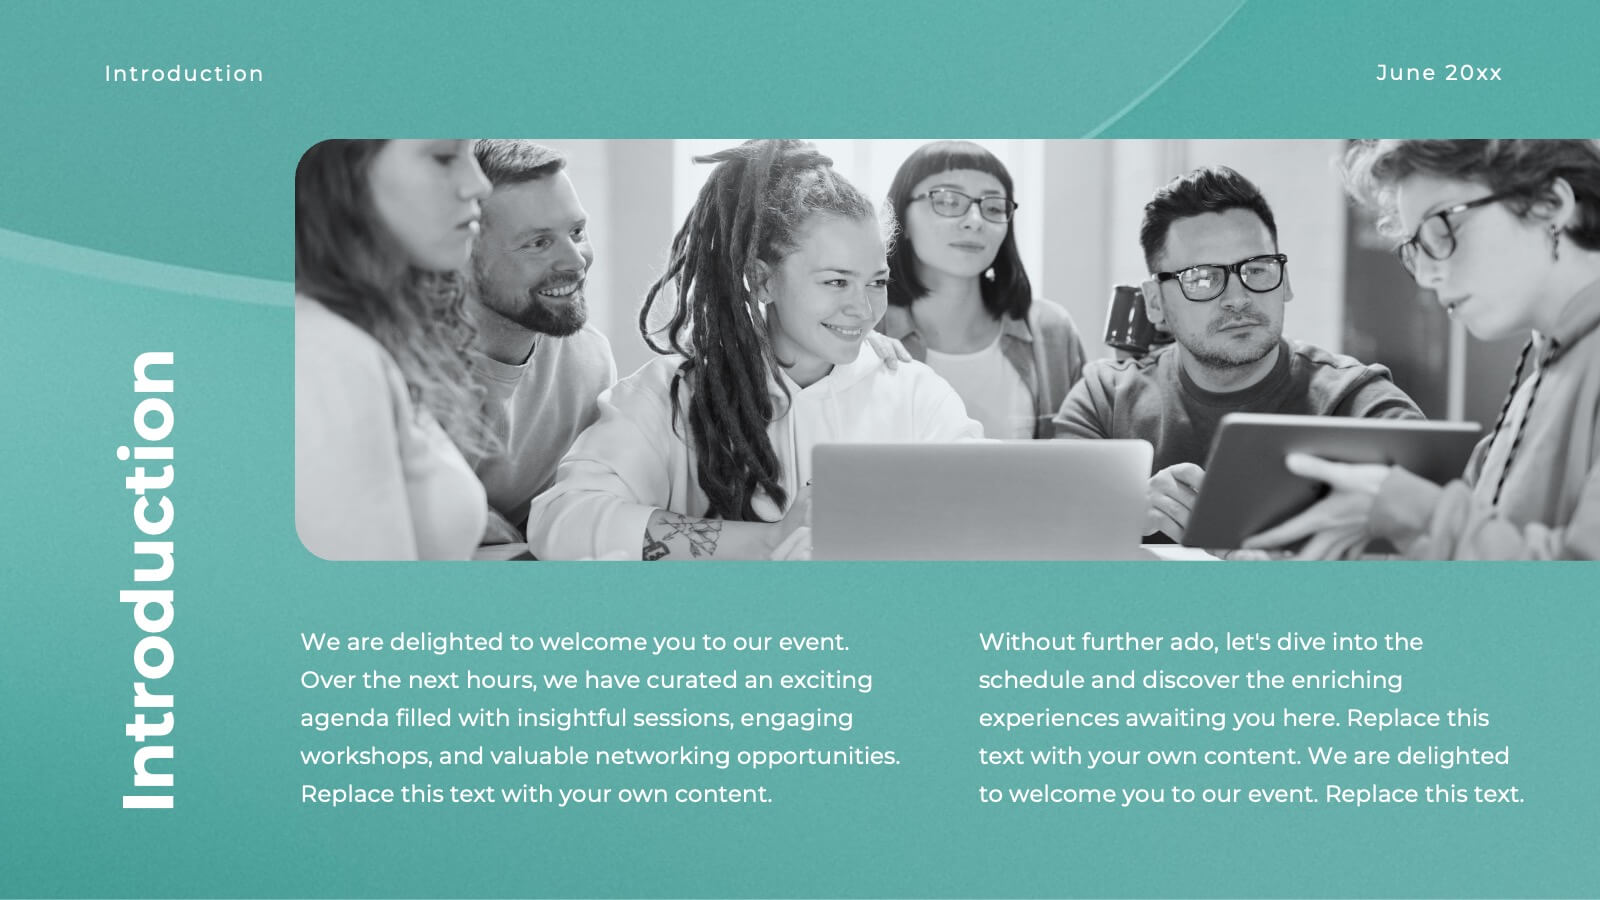
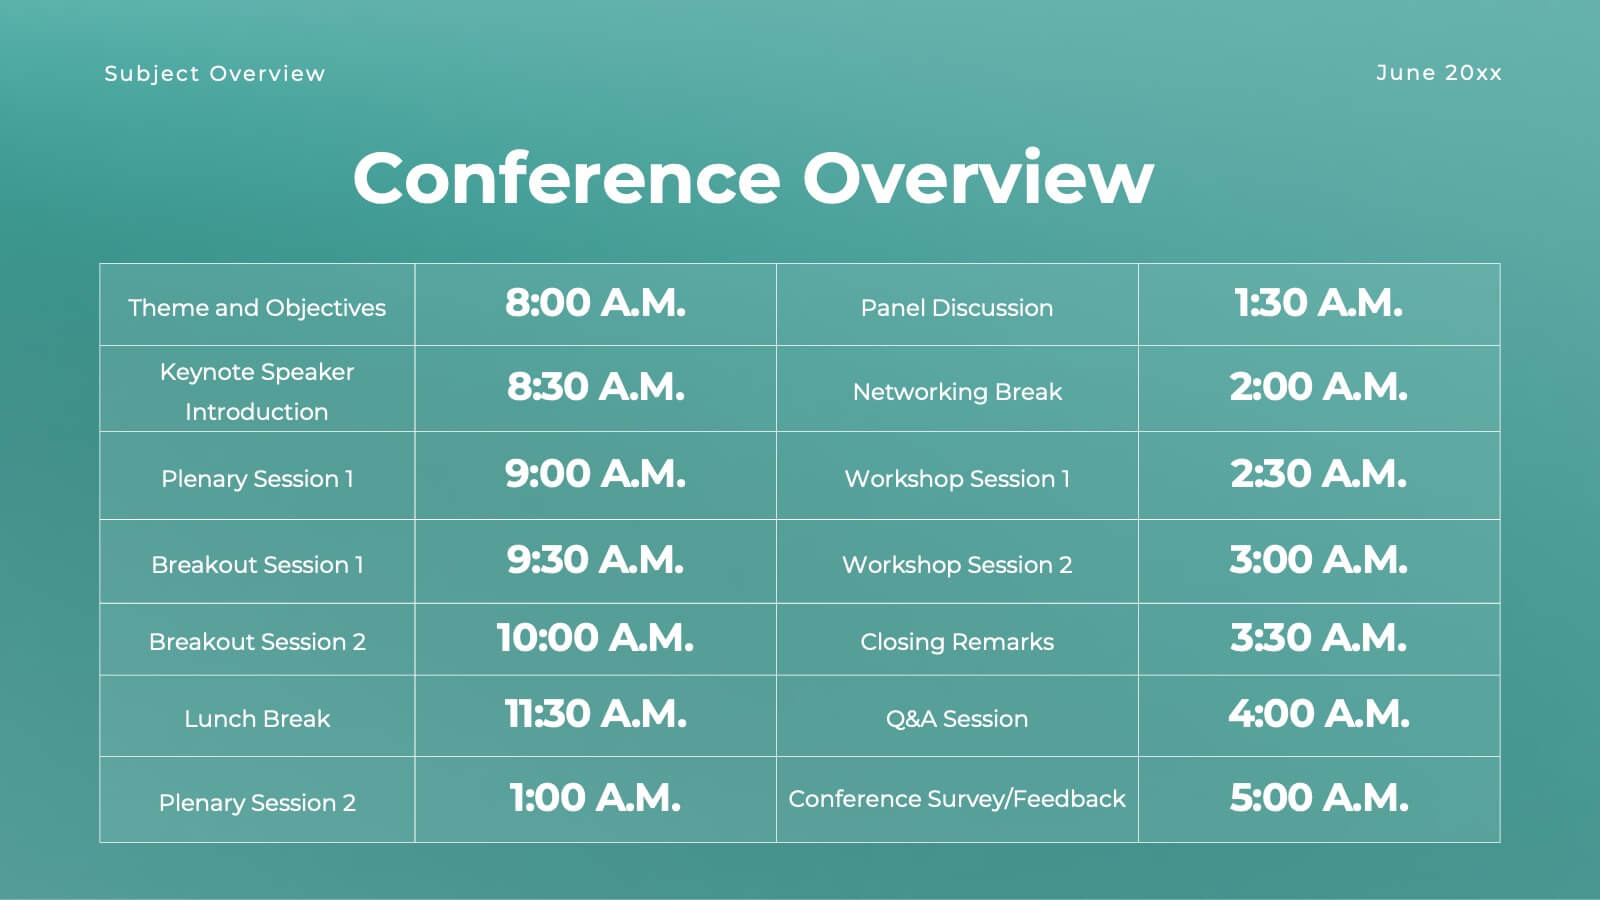
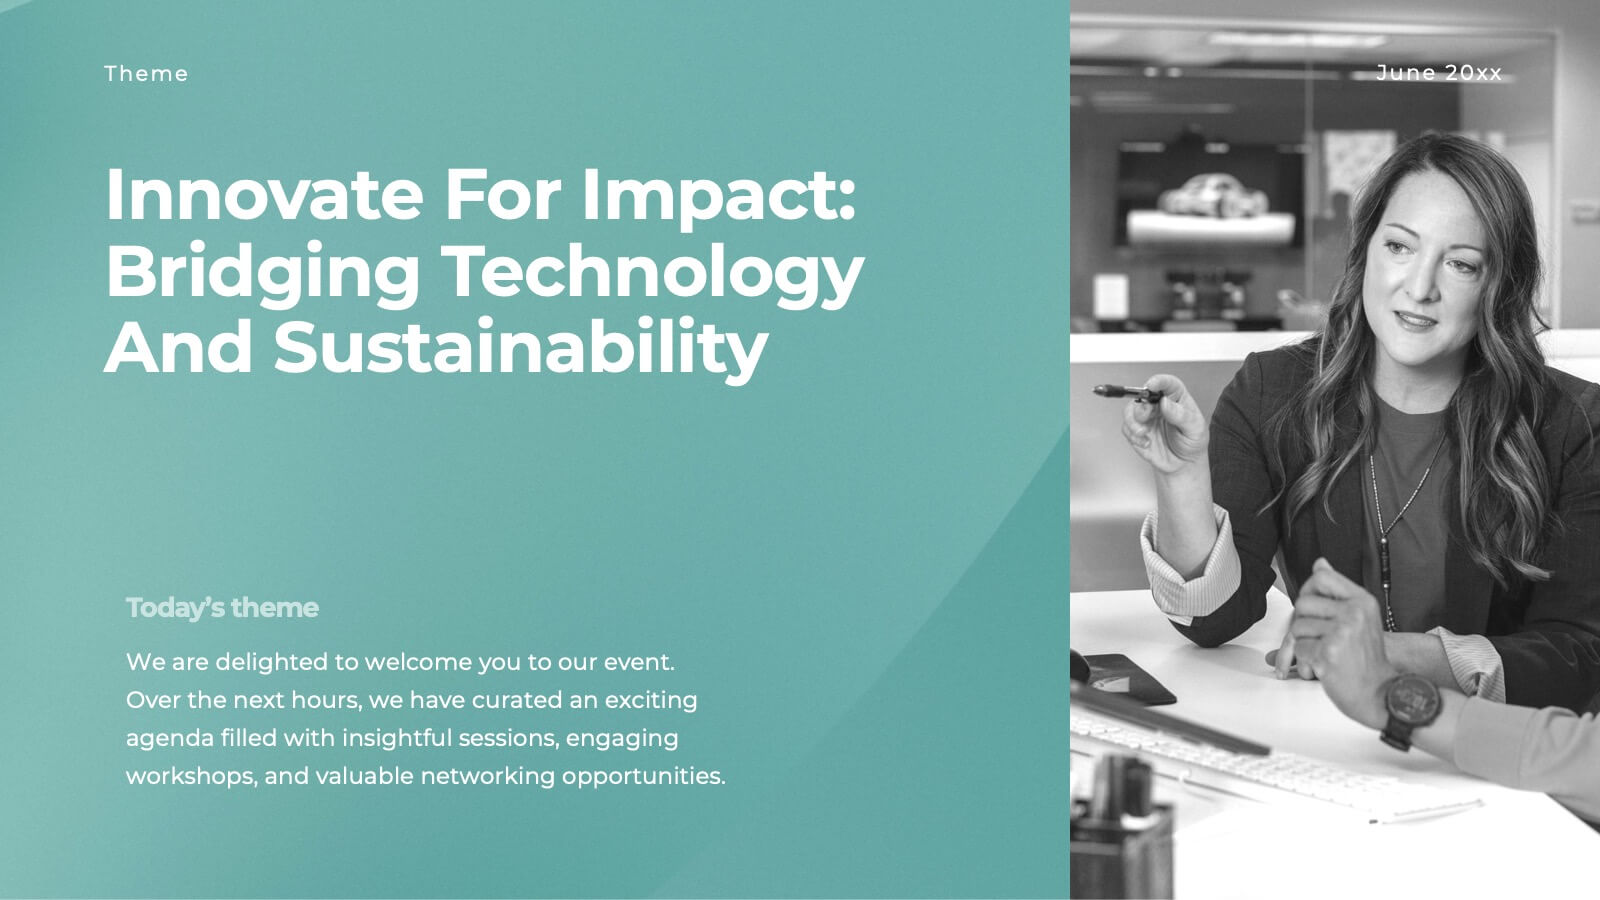
Halo Small Business Pitch Deck Presentation
Streamline your business presentations with this versatile pitch deck template! Ideal for conferences and meetings, it includes slides for objectives, session details, keynote speakers, and panel discussions. Keep your audience engaged with professional design and clear, structured content. Compatible with PowerPoint, Keynote, and Google Slides for seamless presentations on any platform.


6 slides
Problem Analysis Infographic
These slides provide a structured and aesthetically pleasing approach for detailing problem analysis within a project or organizational context. Each slide incorporates various design elements that guide the viewer through the steps or layers of the problem, allowing for a comprehensive understanding and discussion. The use of soft color palettes and clear text placement ensures that the information is easily digestible. The diverse layouts cater to different aspects of problem analysis, from bullet points to diagrammatic representations, making these templates versatile for various presentation needs. These are ideal for presenting complex information in a straightforward manner to ensure clear communication of issues and strategies within team meetings or presentations to stakeholders. The flexibility of the design also allows for easy customization to suit specific project requirements or branding needs.


5 slides
5-Year Strategic Roadmap Slide Presentation
Take your audience on a dynamic journey with a flowing, milestone-based layout that makes long-term planning feel clear and engaging. This presentation helps you map out goals, priorities, and key initiatives across five years with structure and clarity. Ideal for strategy meetings and planning sessions. Fully compatible with PowerPoint, Keynote, and Google Slides.


6 slides
Information Security Risk Analysis Presentation
Identify weak points before they become real threats. This information security risk analysis template makes it easy to present cybersecurity vulnerabilities, data protection gaps, and action plans in a visual and professional way. Ideal for IT audits or strategy meetings. Fully editable in PowerPoint, Keynote, and Google Slides.


5 slides
Construction Sector and Careers Infographics
Construction Infographics provide information and data related to the construction industry. This template is a visually appealing and informative design that allows you to present key information about the construction industry and various career opportunities within it. This template provides a comprehensive platform to showcase the different aspects of the industry and the diverse career paths available. Compatible with Powerpoint, Keynote, and Google Slides, ensuring easy customization and flexibility. The infographics feature construction-themed illustrations and icons, to captures the attention of your audience and add visual interest.


26 slides
Azahar Presentation Template
Azahar is a perfect modern template with a clean and professional feel. This theme can help your business connect with clients through an easy to understand template. Azahar was designed by professionals to help businesses connect with their audience. It has a modern, chic aesthetic and very detailed look. The colors are fresh which help keep the look clean and easy to read. The theme comes packed with features to target your audience and get your message across. Charts, timelines and easy to edit text, this template is perfect for businesses seeking to make an impression on their audience.


4 slides
Internal Meeting Agenda and Notes Presentation
Stay organized and aligned with the Internal Meeting Agenda and Notes presentation template. Designed for clarity and productivity, this layout includes dedicated sections for meeting topics, notes, action items (to-do list), brainstorming, and extra comments. Ideal for team check-ins, project syncs, and internal reviews. Fully editable and compatible with PowerPoint, Keynote, and Google Slides.


4 slides
US Map with Data Points Presentation
Bring your data to life with a dynamic nationwide view that makes trends instantly clear. This presentation helps you showcase key metrics, highlight regional insights, and compare results across states using clean, modern data markers. It’s perfect for reports, strategy updates, and analytics. Fully compatible with PowerPoint, Keynote, and Google Slides.


5 slides
Political Campaign Strategies Infographics
A political campaign refers to the organized efforts of individuals or groups to promote a particular candidate, political party, or specific political agenda during an election or to raise awareness and support for a specific issue. These infographic templates are designed to showcase various strategies and techniques used in political campaigns. This is perfect for politicians, campaign managers, or anyone involved in the political arena who wants to present their campaign strategies. Its customizable layout and eye-catching design enable politicians to communicate their campaign, engage with their audience, and rally support for their goals.


6 slides
Organizational Mind Mapping Slide Presentation
Bright ideas deserve a space to grow, and this presentation turns complex thoughts into a clean, organized visual map. It helps teams outline processes, connect concepts, and structure information with clarity and flow. Perfect for planning or strategy sessions. Fully compatible with PowerPoint, Keynote, and Google Slides.


5 slides
Client Engagement Journey Touchpoints
Map out every stage of client interaction with the Client Engagement Journey Touchpoints Presentation. This visual slide template highlights four key customer touchpoints, with a central user icon to emphasize the client-centric approach. Ideal for showcasing brand awareness, first contact, engagement strategies, and conversion steps. Easily customizable in PowerPoint, Keynote, and Google Slides.


20 slides
Sphene Sales Proposal Presentation
Take your sales pitch to the next level with this elegant and structured presentation template! Featuring sections on sales objectives, process, pricing strategies, and performance metrics, this template is ideal for impressing potential clients and closing deals. It’s easy to customize and works seamlessly with PowerPoint, Keynote, and Google Slides for hassle-free presentation creation.


26 slides
Remote Work Best Practices Creative Presentation
Navigate the world of telecommuting with our Remote Work Best Practices presentation template, available for Powerpoint, Google Slides, and Keynote. This template is specially designed for the modern remote work environment, incorporating a blend of professional and engaging visuals that reflect the flexibility and innovation of working from home. The template features customizable slides for outlining communication tools, scheduling, and mental health tips. Whether you're onboarding new staff or refining your company's remote policies, this template will help you present a comprehensive guide to succeeding in the remote work landscape.


3 slides
Persona Mapping for Target Audience Presentation
Get clear on who you're speaking to with this visual persona mapping slide. Ideal for marketing plans, customer research, or segmentation strategies, this layout helps you define and compare target audience types with clean icons and text space. Fully editable and works with PowerPoint, Keynote, and Google Slides.


10 slides
Africa Market Potential and Growth Map Presentation
Unlock business opportunities with the Africa Market Potential and Growth Map template, designed to showcase market analysis and growth trends across different African regions. It features a map highlighting specific countries coupled with adjustable data bars reflecting market potential percentages. This template is ideal for presentations focusing on market trends, investment opportunities, and growth forecasts in Africa.


6 slides
Business Benefits Highlights Presentation
Bring your business advantages to life with a vibrant, structured layout that captures attention instantly. This professional design helps you showcase key strengths, achievements, or milestones with clarity and impact. Ideal for company overviews or reports, it’s fully compatible with PowerPoint, Keynote, and Google Slides for easy customization and presentation.