


Features
- 21 Unique Slides
- Fully editable and easy to edit in Microsoft Powerpoint, Keynote and Google Slides
- 16:9 widescreen layout
- Clean and professional designs
- Export to JPG, PDF or send by email


Do you have any questions?
Recommend
20 slides
Saturn Business Plan Presentation
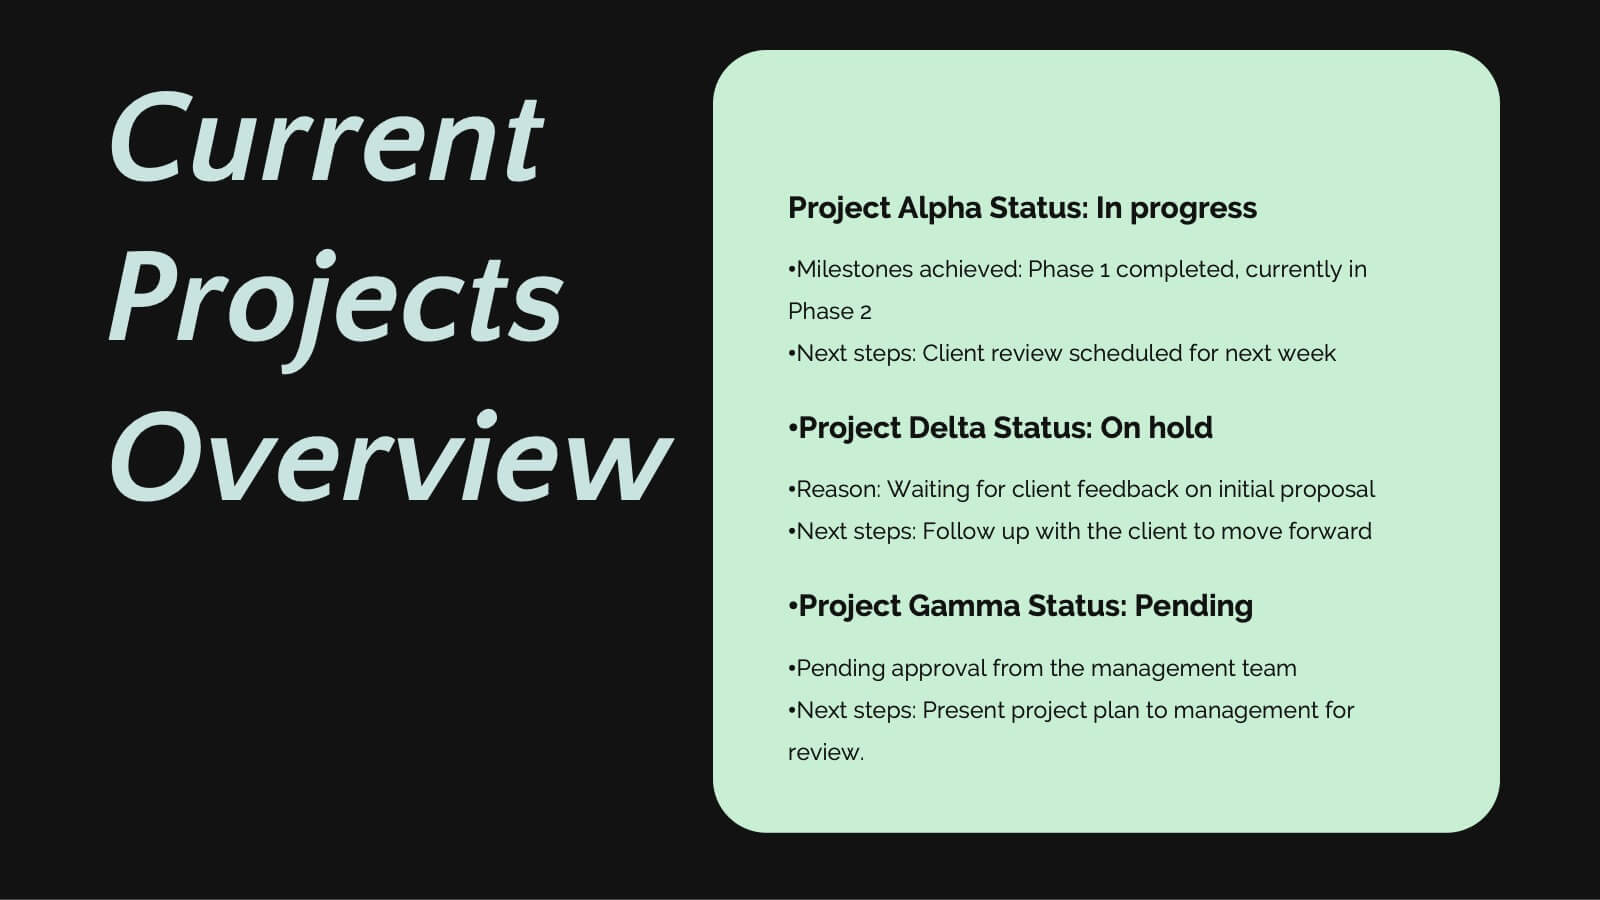
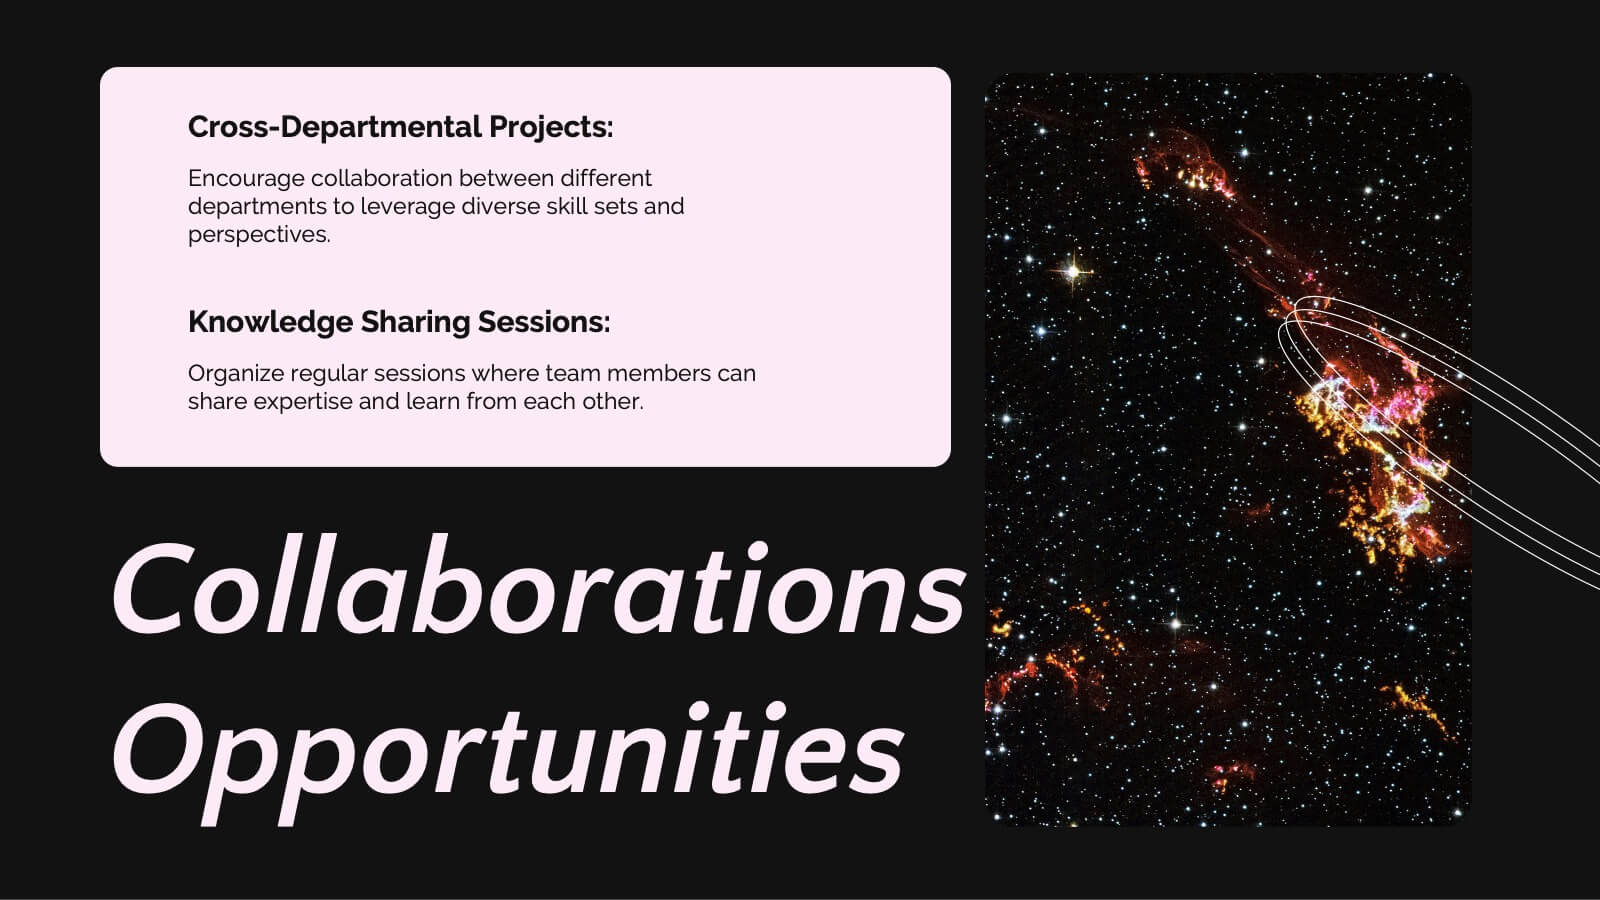
Embark on a journey to present your business plan like never before with this stellar presentation template! Perfect for diving deep into key updates, achievements, collaborations, and future goals, it guides your team through essential business strategies and challenges. Compatible with PowerPoint, Keynote, and Google Slides, it offers seamless flexibility and polished professionalism.


5 slides
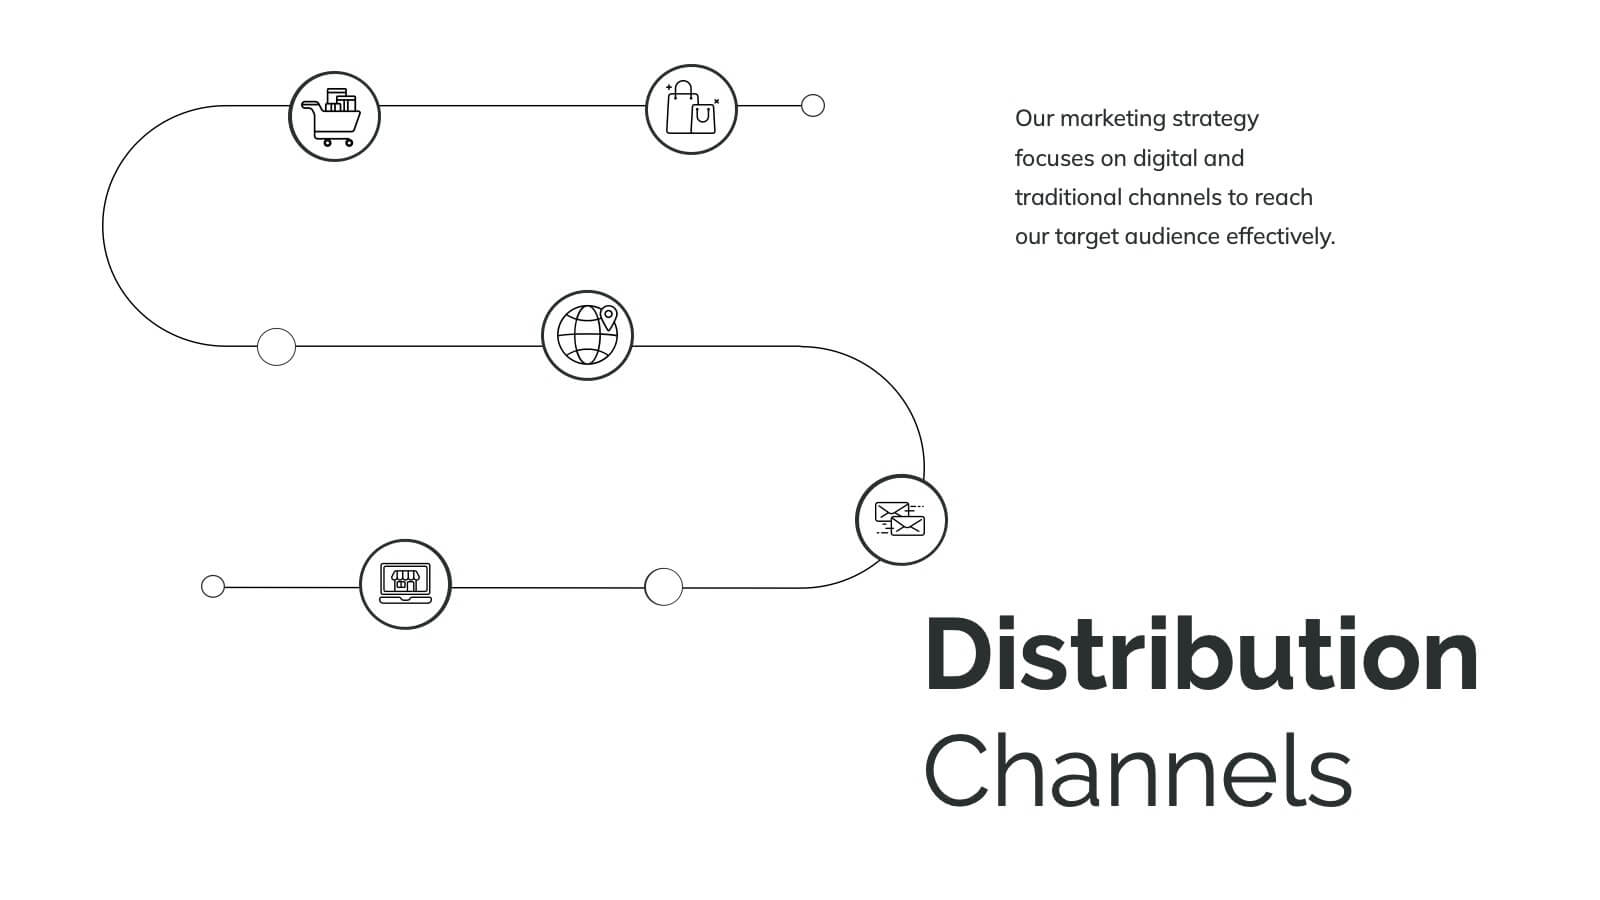
Future Planning and Next Steps Strategy Presentation
Map out your goals with clarity using the Future Planning and Next Steps Strategy Presentation. This slide features a sleek four-step curved timeline with editable icons and labels, ideal for outlining strategic actions or project phases. Easily customize each stage to match your business objectives. Compatible with PowerPoint, Keynote, and Google Slides.


6 slides
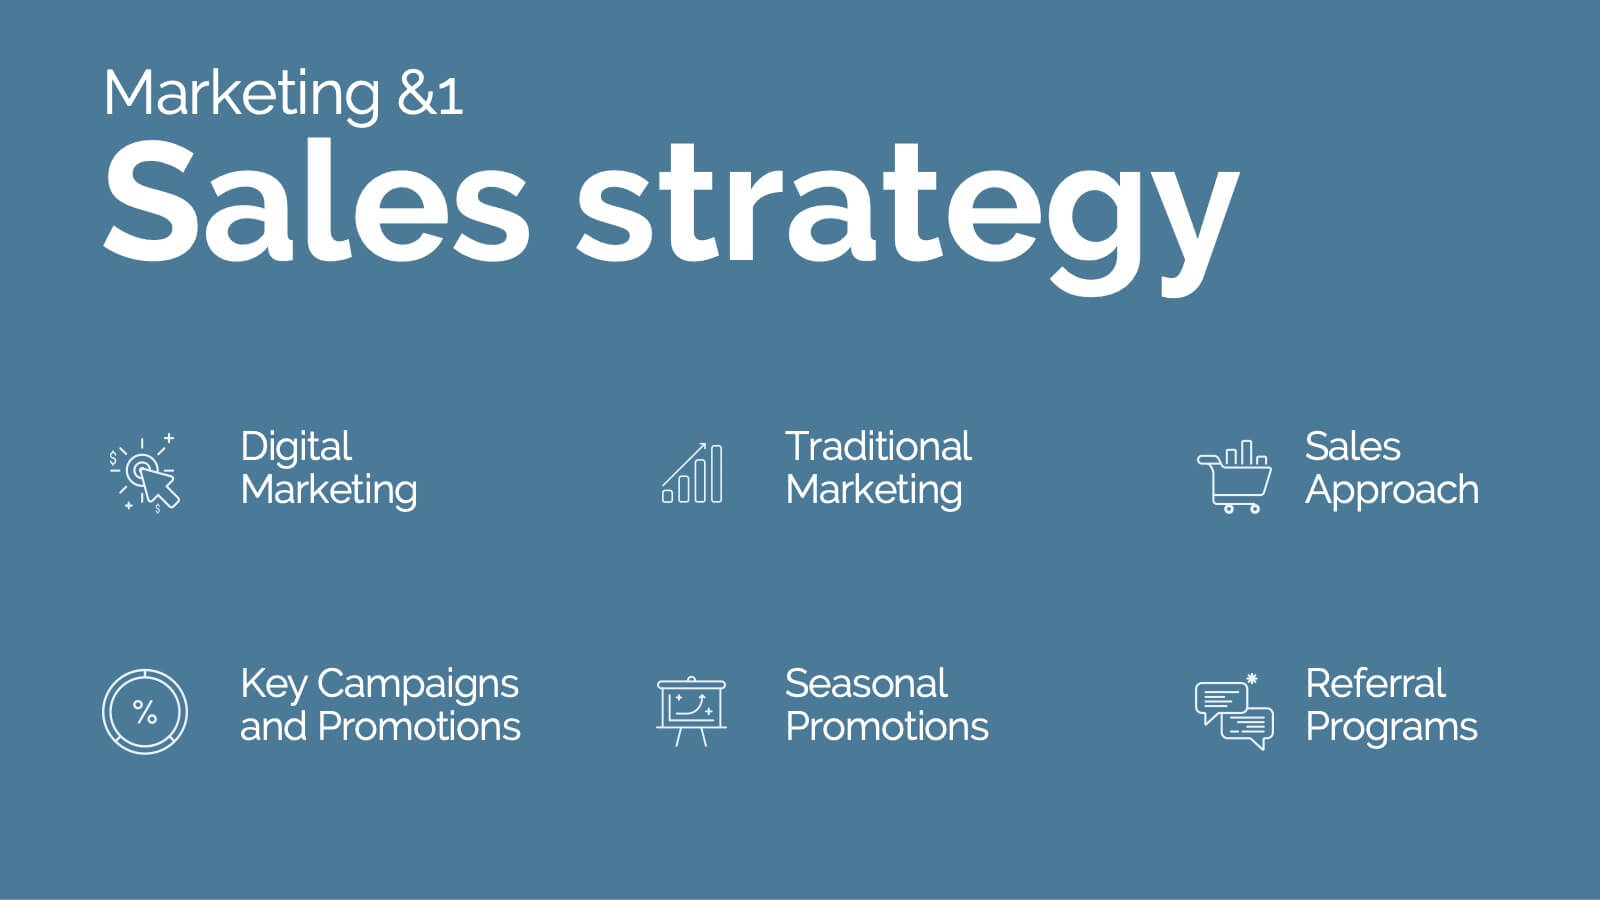
Sales Strategy 30-60-90 Day Plan Presentation
Drive sales success with this structured 30-60-90 day strategy template! Designed to help sales teams and professionals set clear objectives, track progress, and optimize performance, this layout ensures a smooth transition from planning to execution. Fully customizable and compatible with PowerPoint, Keynote, and Google Slides for seamless presentations.


6 slides
Bitcoin and Blockchain Technology Overview Presentation
Break down complex blockchain systems into digestible visuals with this sleek overview slide. Featuring six color-coded icons around a secure lock illustration, it’s ideal for explaining blockchain architecture, bitcoin components, or crypto processes. Fully editable in PowerPoint, Keynote, and Google Slides for seamless customization.


5 slides
Team Role Distribution Matrix Presentation
Clarify responsibilities and improve collaboration with the Team Role Distribution Matrix Presentation. This RACI-style slide helps visualize team accountability across multiple tasks, making it ideal for project management, cross-functional teams, or workflow planning. Each layout option includes clearly labeled roles and color-coded responsibilities: Responsible, Accountable, Consulted, and Informed. Fully editable in Canva, PowerPoint, Keynote, and Google Slides.


4 slides
Product Launch Schedule Timeline Presentation
Showcase your product rollout with this vertical rocket-themed timeline. Ideal for startups, marketing teams, or product managers, it highlights four key stages with icons and editable text. The cloud-based design adds visual flair while maintaining clarity. Fully customizable in PowerPoint, Keynote, and Google Slides to suit your launch plan.


22 slides
Tranquil Project Status Report Presentation
This dynamic project report template delivers key insights with a bold, modern design. From performance metrics to market trends and client feedback, it's crafted for comprehensive yet visually appealing updates. Perfect for team presentations, this template ensures clarity and engagement. Compatible with PowerPoint, Keynote, and Google Slides, it’s ideal for project leaders!


23 slides
Naiad Qualitative Research Findings Presentation
Dive into your data with this refreshing, Naiad-inspired presentation template, perfect for sharing qualitative research findings! Designed to showcase insights, trends, and key conclusions with clarity, this visually appealing layout ensures your research captivates and informs. Make your data flow effortlessly. Compatible with PowerPoint, Keynote, and Google Slides for easy customization.


21 slides
Ruby Startup Funding Proposal Presentation
Get ready to pitch your startup in style with this vibrant and engaging presentation template! Perfect for showcasing your startup’s founding story, business model, market analysis, and financial overview, this template ensures you’ll impress potential investors. Fully customizable and compatible with PowerPoint, Keynote, and Google Slides, it’s ideal for securing funding and support.


6 slides
Legal Policy Overview Presentation
Make your legal and compliance reports look polished and professional with this clean, organized layout. Designed to simplify complex information, it’s ideal for presenting policies, frameworks, and regulations with clarity. Easily customize the content and visuals—fully compatible with PowerPoint, Keynote, and Google Slides for effortless editing and use.


8 slides
Team Statistics and Rankings Presentation
Showcase match performance, rankings, and team metrics with this Team Statistics and Rankings Presentation. Visualize key game stats using editable diagrams, heatmaps, and comparison scores. Perfect for sports analysts, coaches, or recap slides. Compatible with PowerPoint, Keynote, and Google Slides—fully customizable for your team’s specific data and branding needs.


5 slides
Project Risk Management Framework Presentation
Visualize challenges before they arise with this dynamic framework designed to map, assess, and mitigate project risks efficiently. Its circular layout highlights every critical stage, helping you communicate strategies clearly and professionally. Fully editable and compatible with PowerPoint, Keynote, and Google Slides for effortless customization and presentation flexibility.


5 slides
Step-by-Step Flow Diagram Presentation
Bring clarity to every stage of your process with a clean, easy-to-follow visual path that guides your audience step by step. This presentation helps simplify workflows, instructions, and project milestones in a structured, approachable layout. Fully compatible with PowerPoint, Keynote, and Google Slides.


5 slides
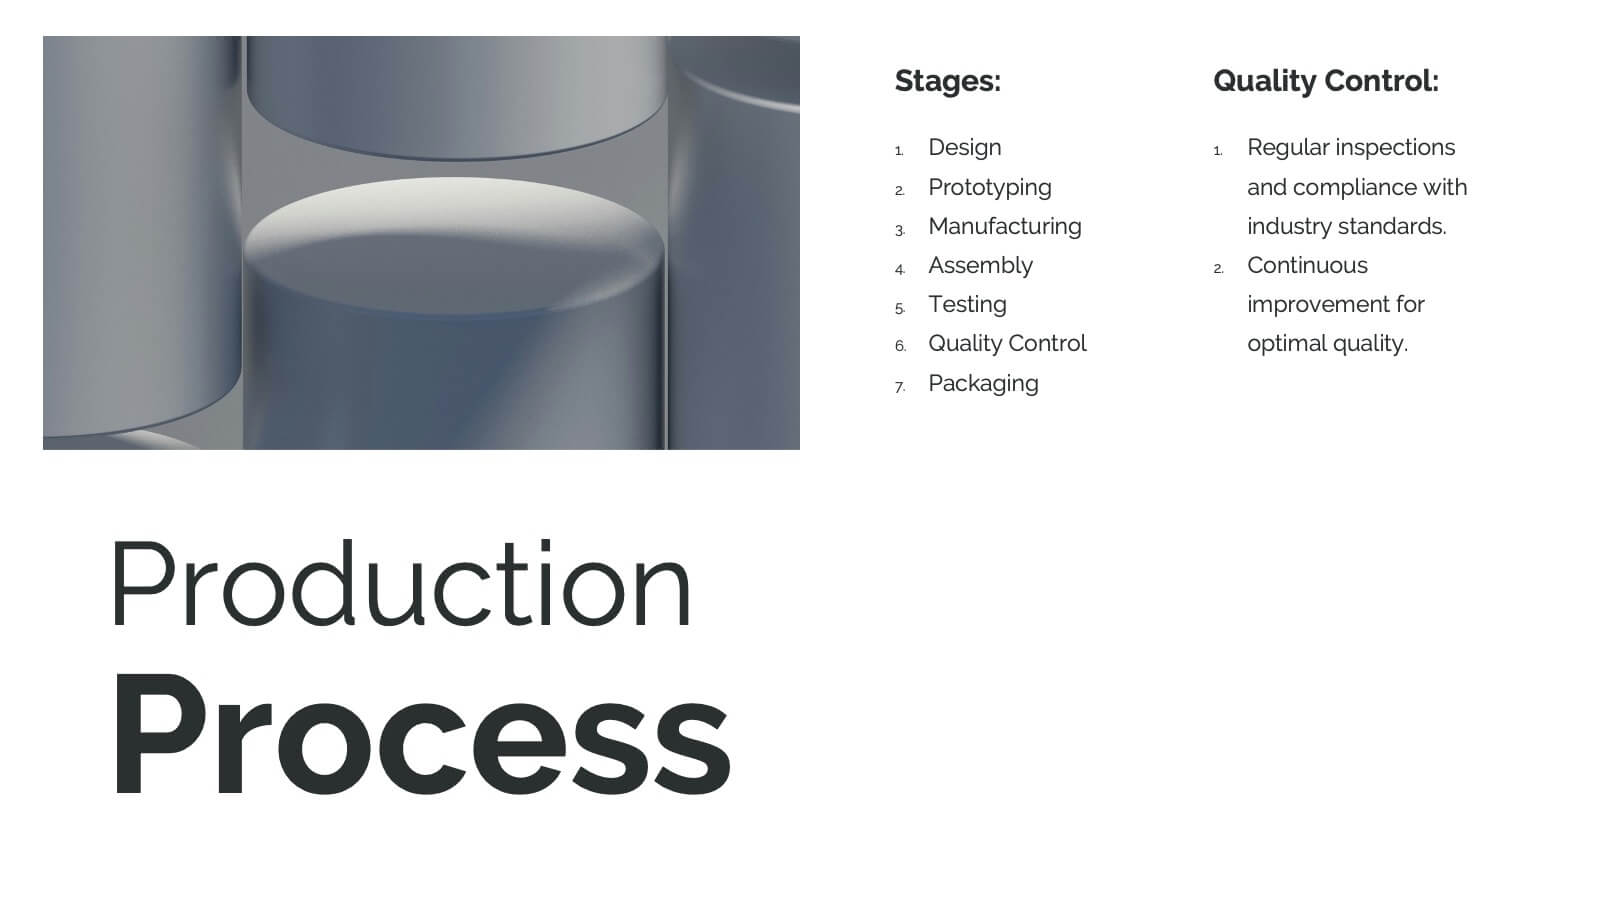
New Product Innovation Plan Presentation
Bring your ideas to market with confidence using this clear and engaging presentation. Designed to showcase every stage of product development, it helps visualize innovation steps, research insights, and launch strategies with impact. Fully editable and compatible with PowerPoint, Keynote, and Google Slides for effortless customization and professional results.


20 slides
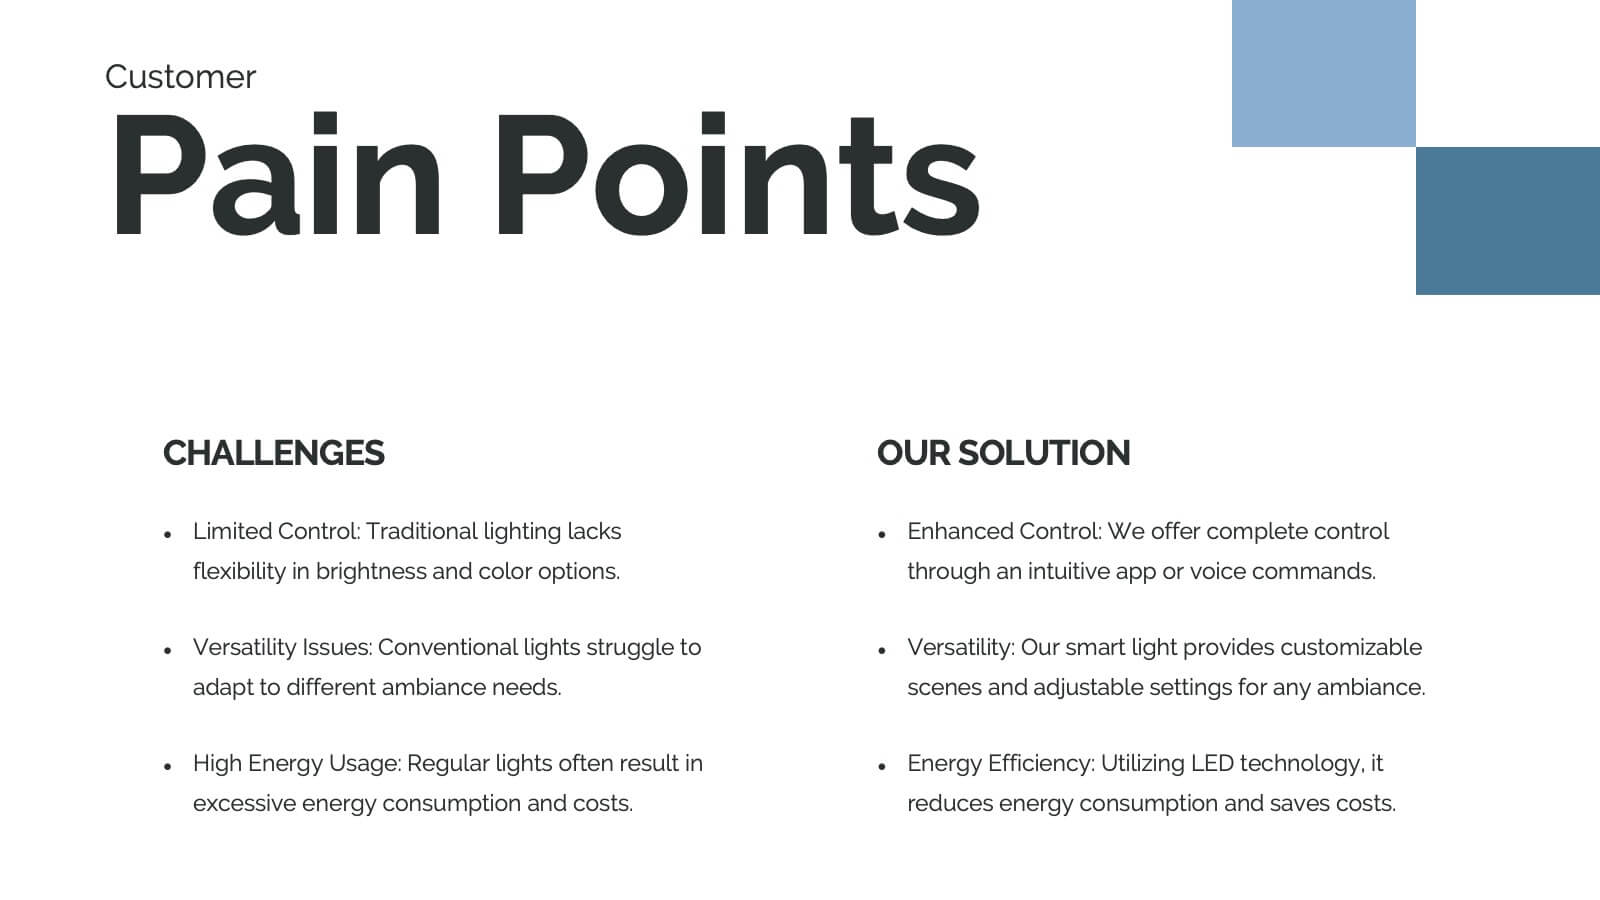
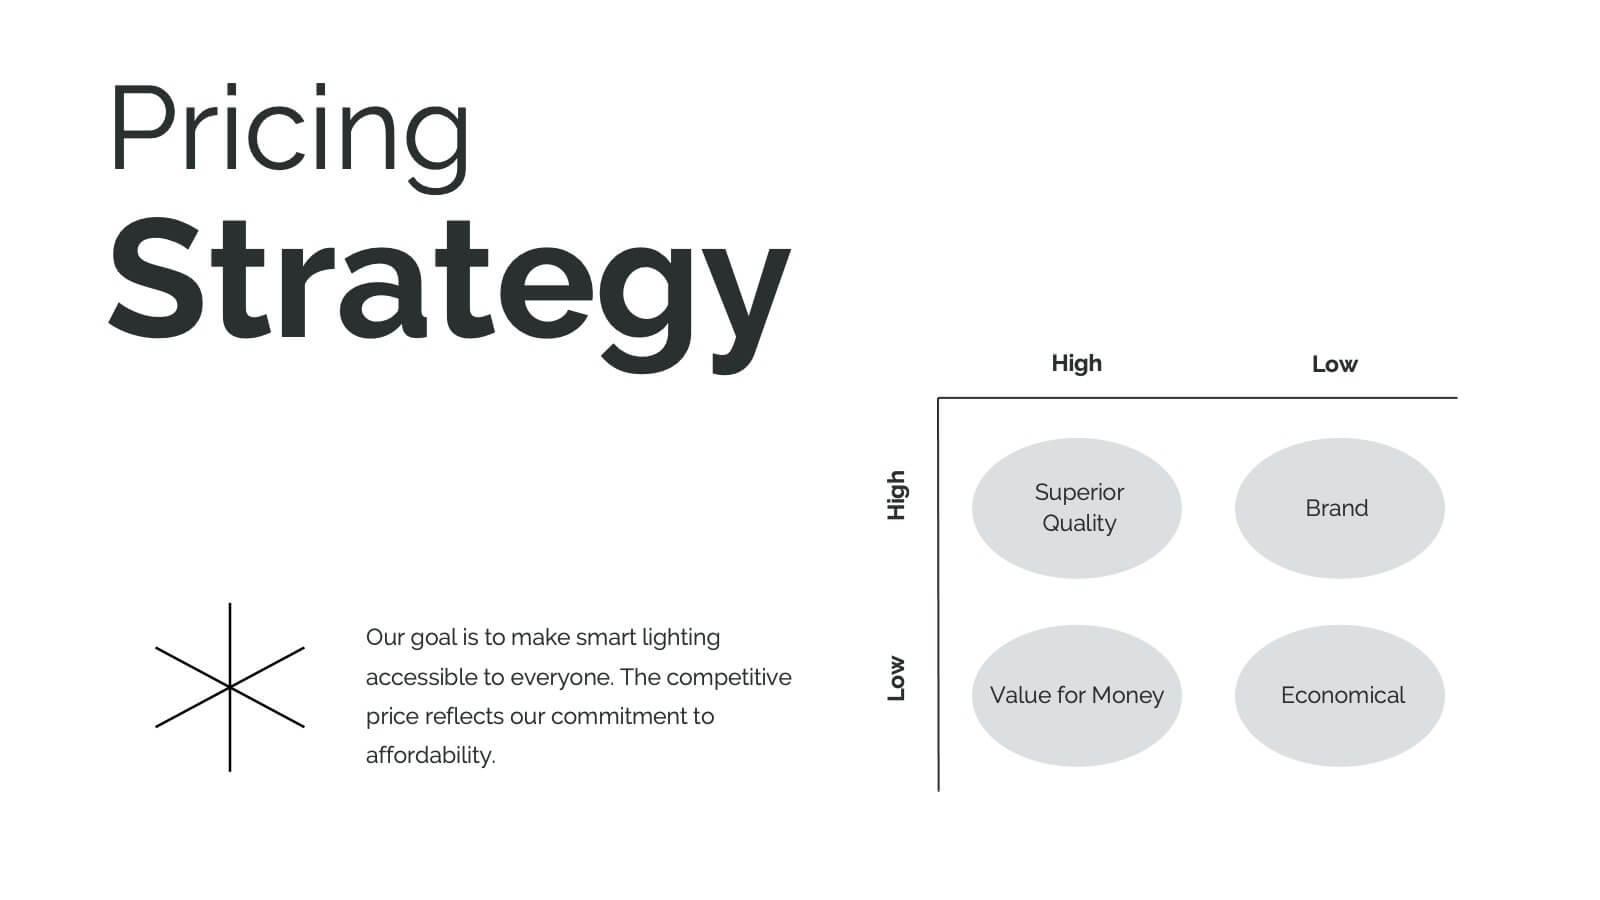
Hydra Product Launch Presentation
Unveiling your latest product has never been easier or more captivating! This comprehensive presentation template covers every aspect of your product's journey—from launch to competitive analysis. Engage your audience with detailed slides on features, target analysis, and pricing strategy. Seamlessly compatible with PowerPoint, Keynote, and Google Slides for maximum flexibility and impact.


5 slides
Team Goals and Alignment Strategy Presentation
Align your team with clarity using the Team Goals and Alignment Strategy Presentation. This slide visually connects individual roles to a central target, making it ideal for showcasing strategic alignment, shared objectives, or team contributions. Fully customizable in Canva, PowerPoint, or Google Slides for seamless team planning.


26 slides
Strategic Partnership Building Presentation
Forge ahead into the world of collaboration with a presentation template designed to underscore the power of strategic partnerships. This suite of slides is the perfect toolkit for professionals seeking to illustrate the synergy between entities and the innovative outcomes of such alliances. The design is both sleek and inviting, with soft curves and a cool color palette that conveys a sense of harmony and cooperation. Highlight your organization's leaders with personalized bio slides, and utilize a range of charts and graphs to demonstrate the mutual benefits and shared objectives of your partnerships. Whether mapping out the journey of a collaboration, detailing the process of integration, or sharing success stories, these slides are created to facilitate clear and impactful communication. The template is thoughtfully adaptable to Keynote, Google Slides, and PowerPoint, ensuring your message of unity and cooperative success resonates across any platform.