


Features
- 6 Unique slides
- Fully editable and easy to edit in Microsoft Powerpoint, Keynote and Google Slides
- 16:9 widescreen layout
- Clean and professional designs
- Export to JPG, PDF or send by email


Do you have any questions?
Recommend


22 slides
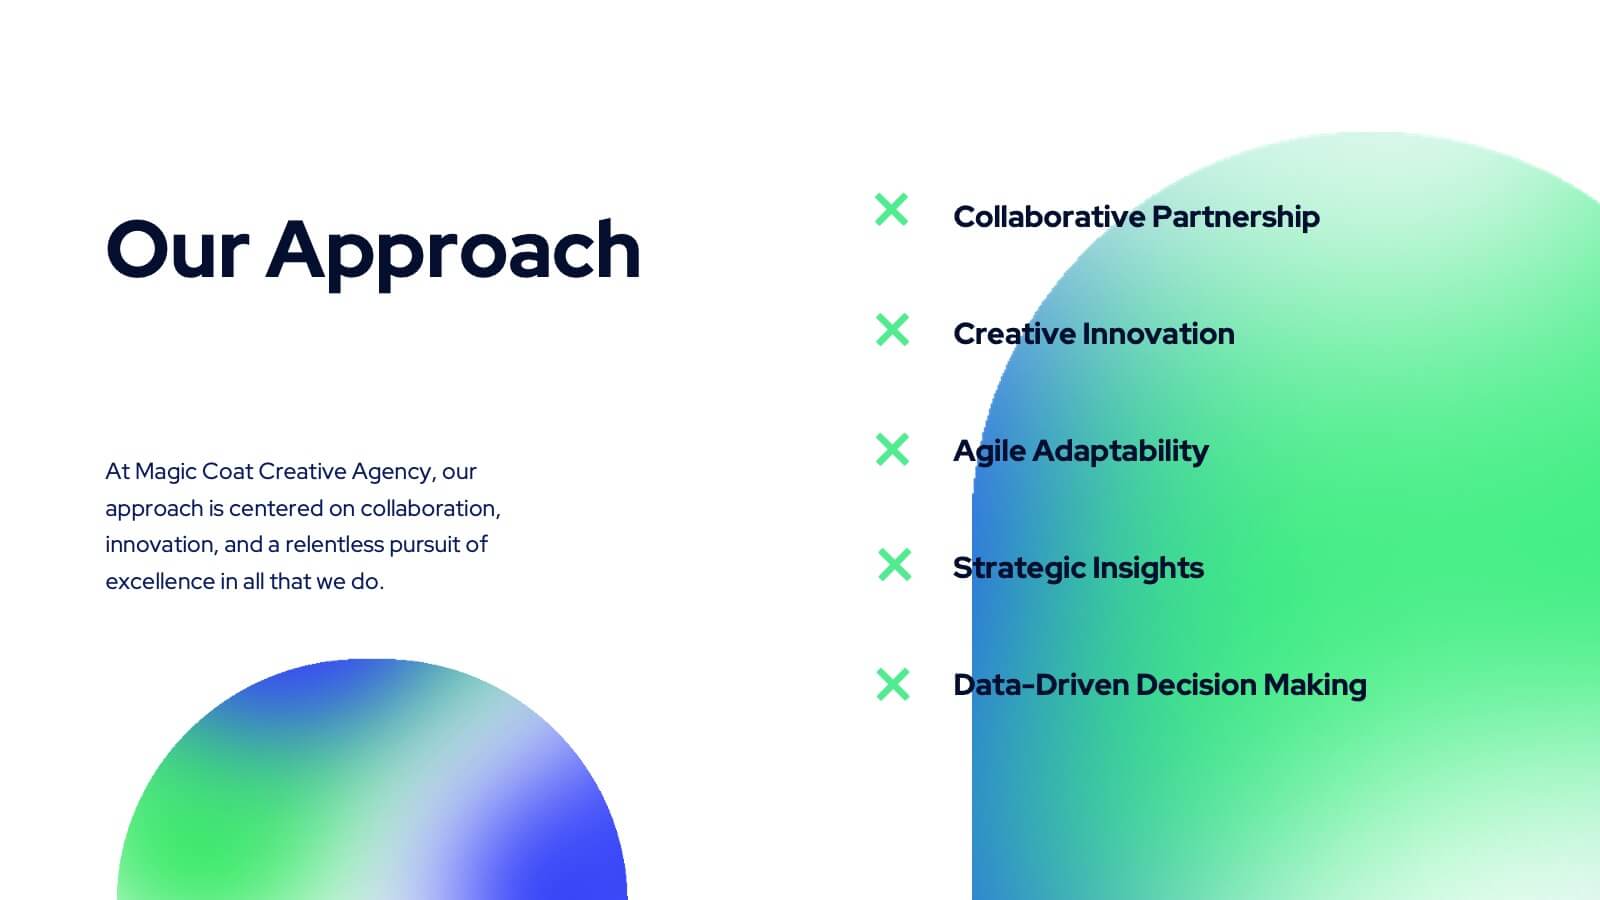
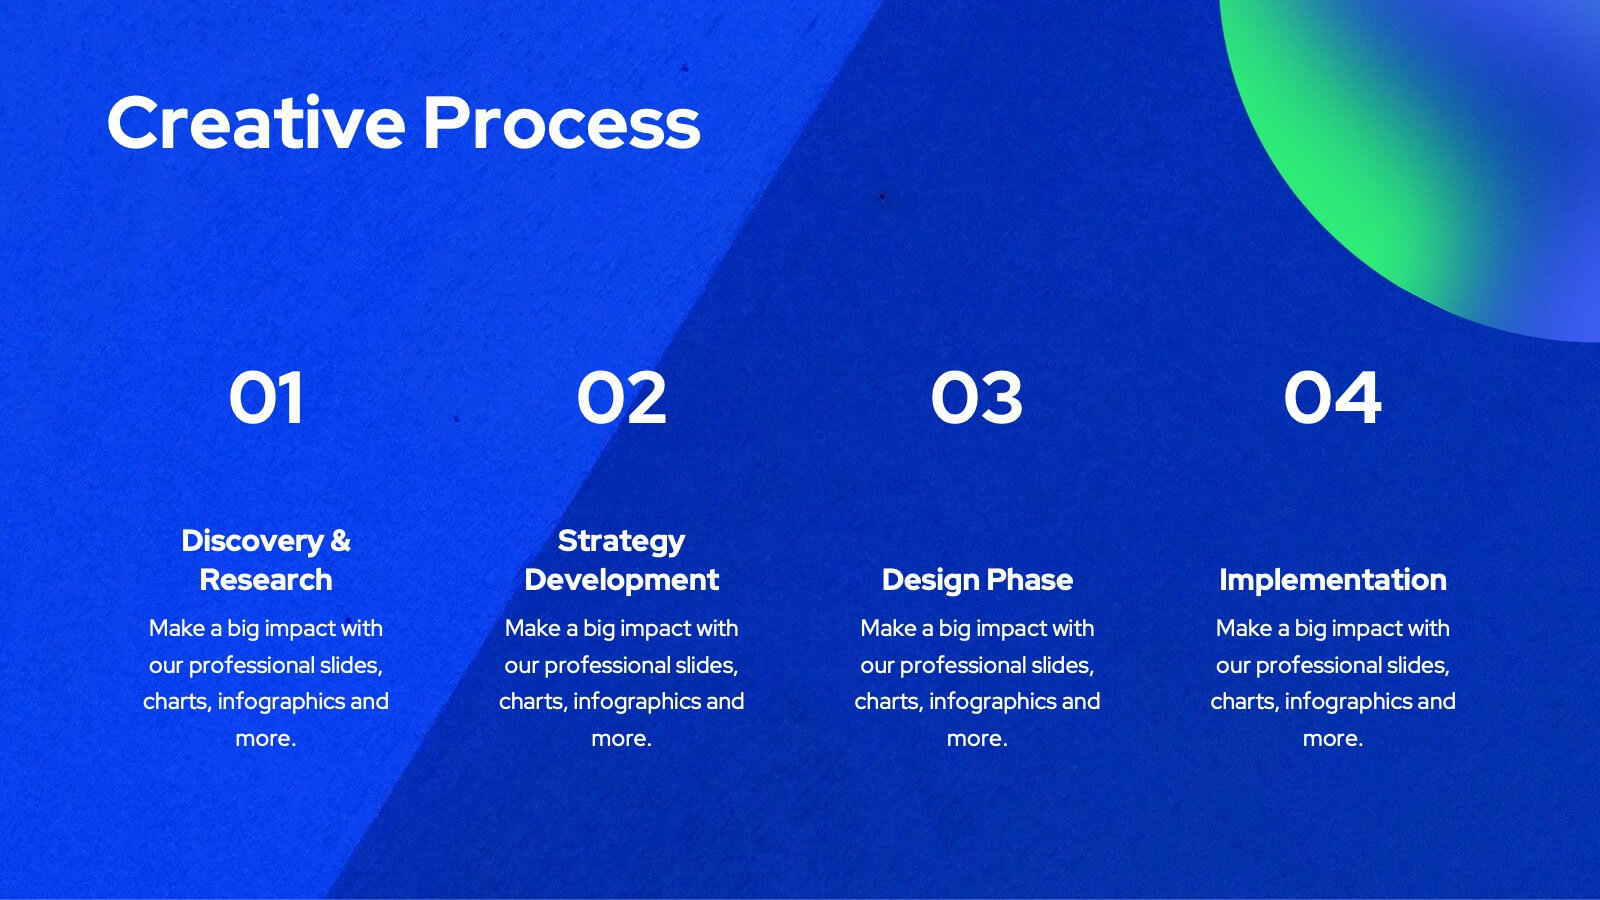
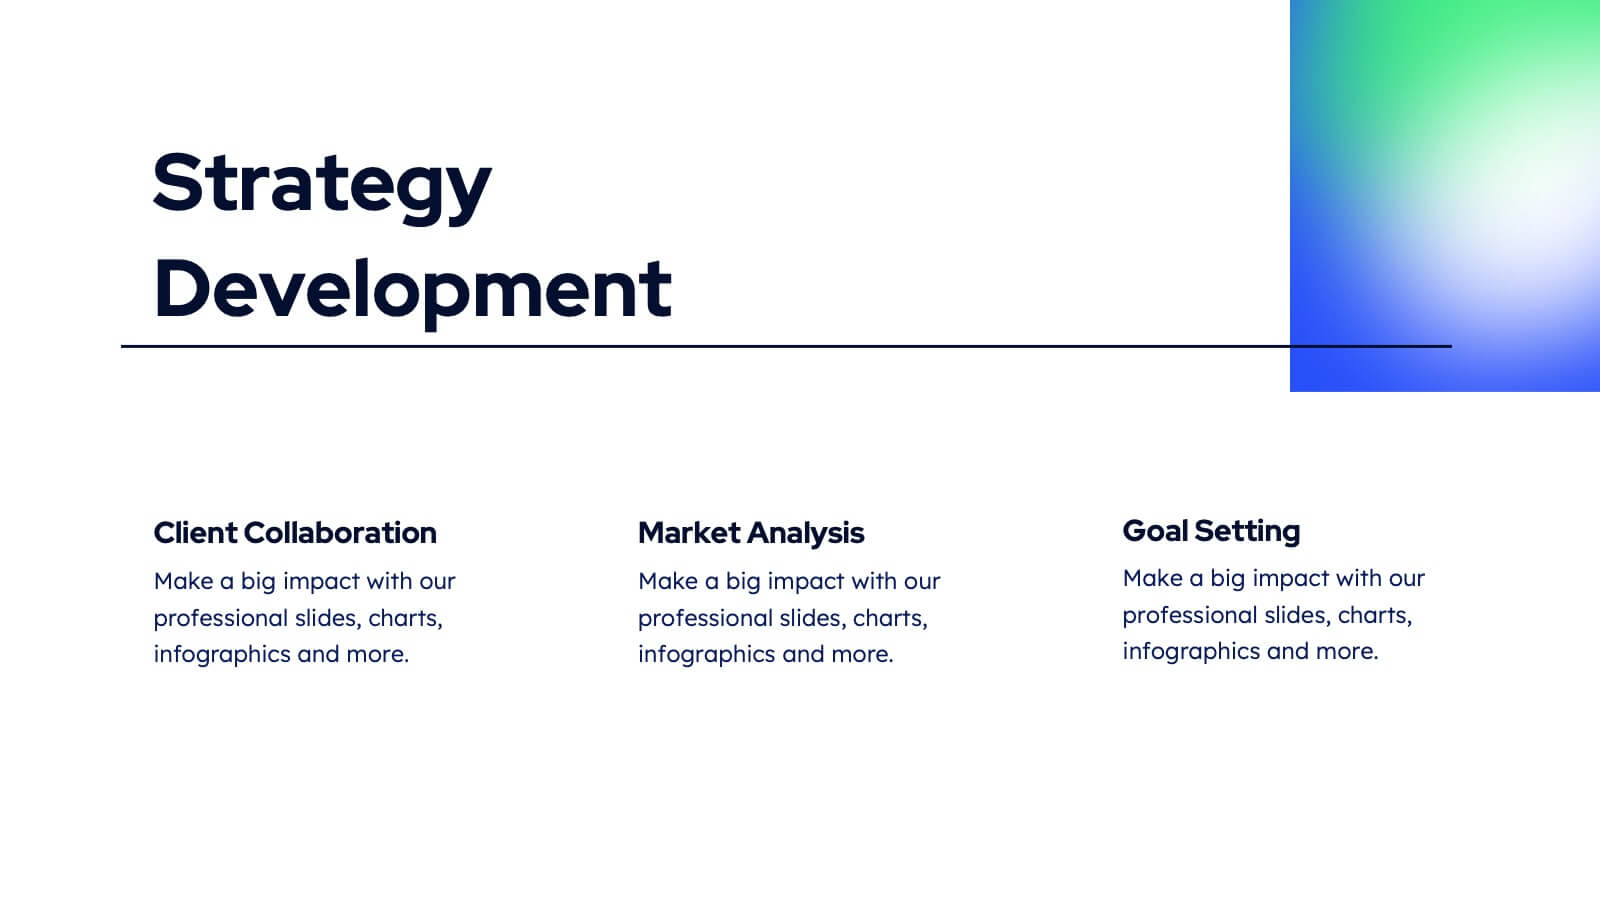
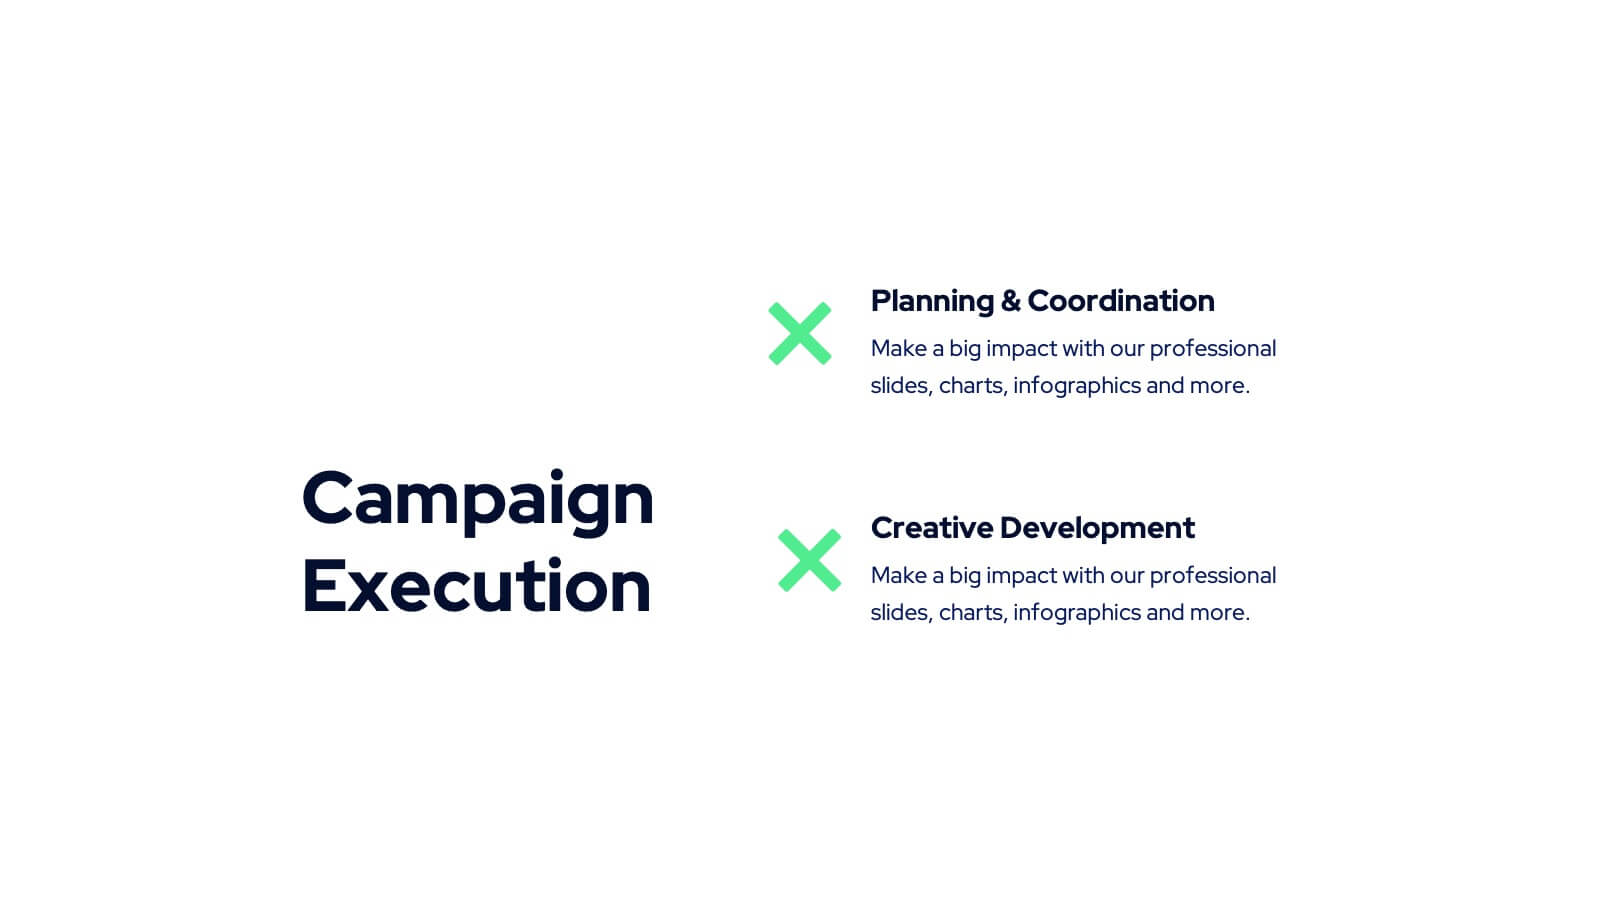
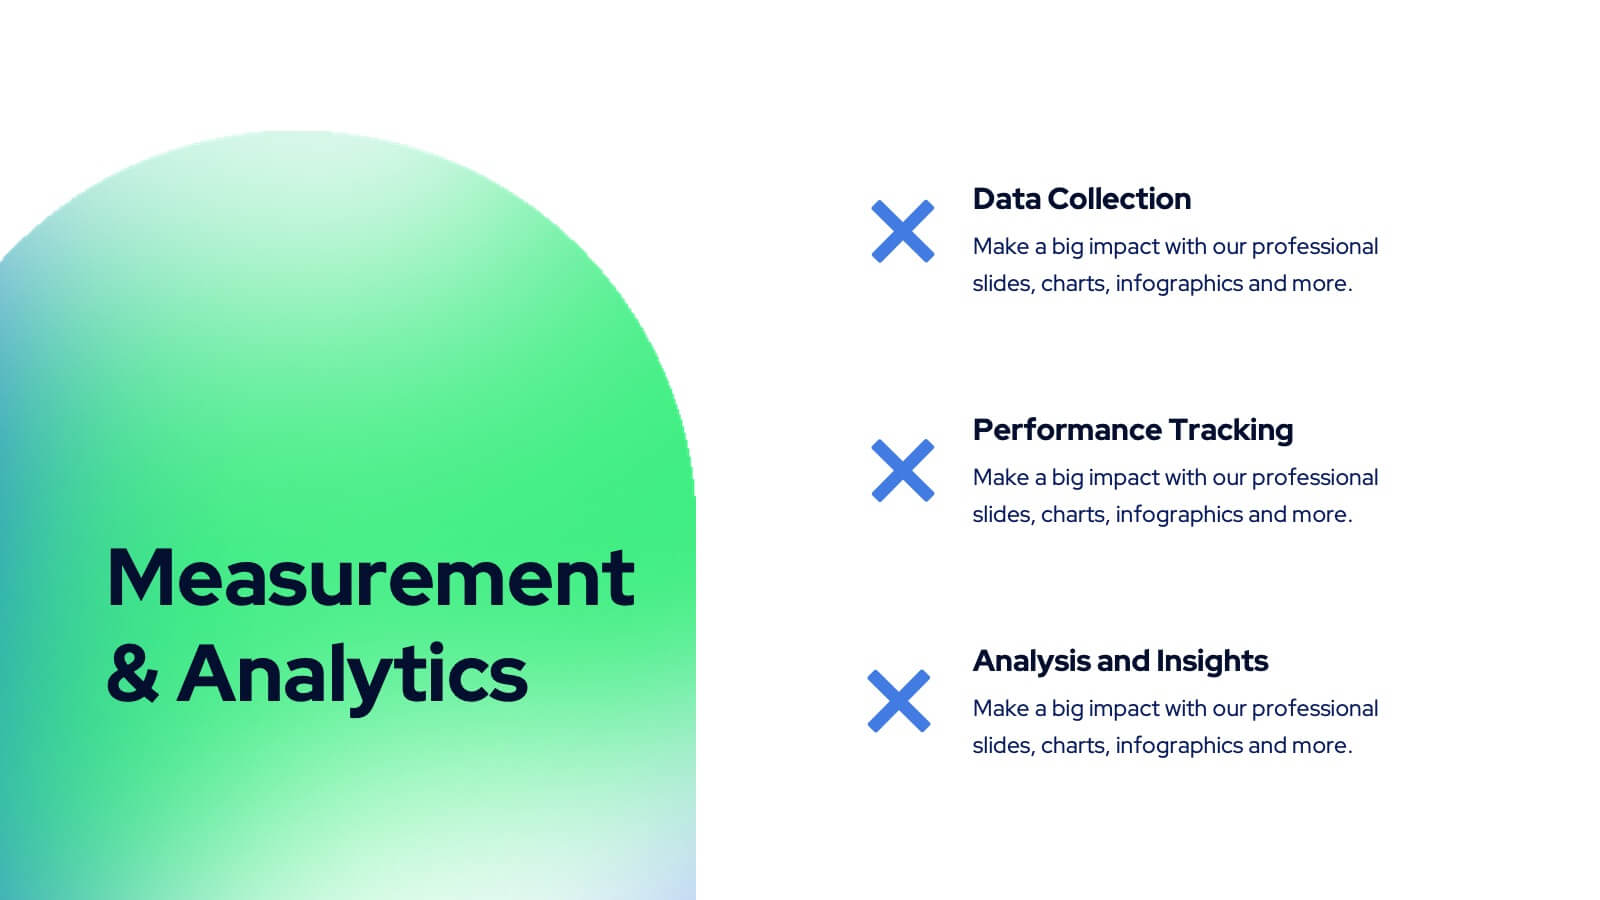
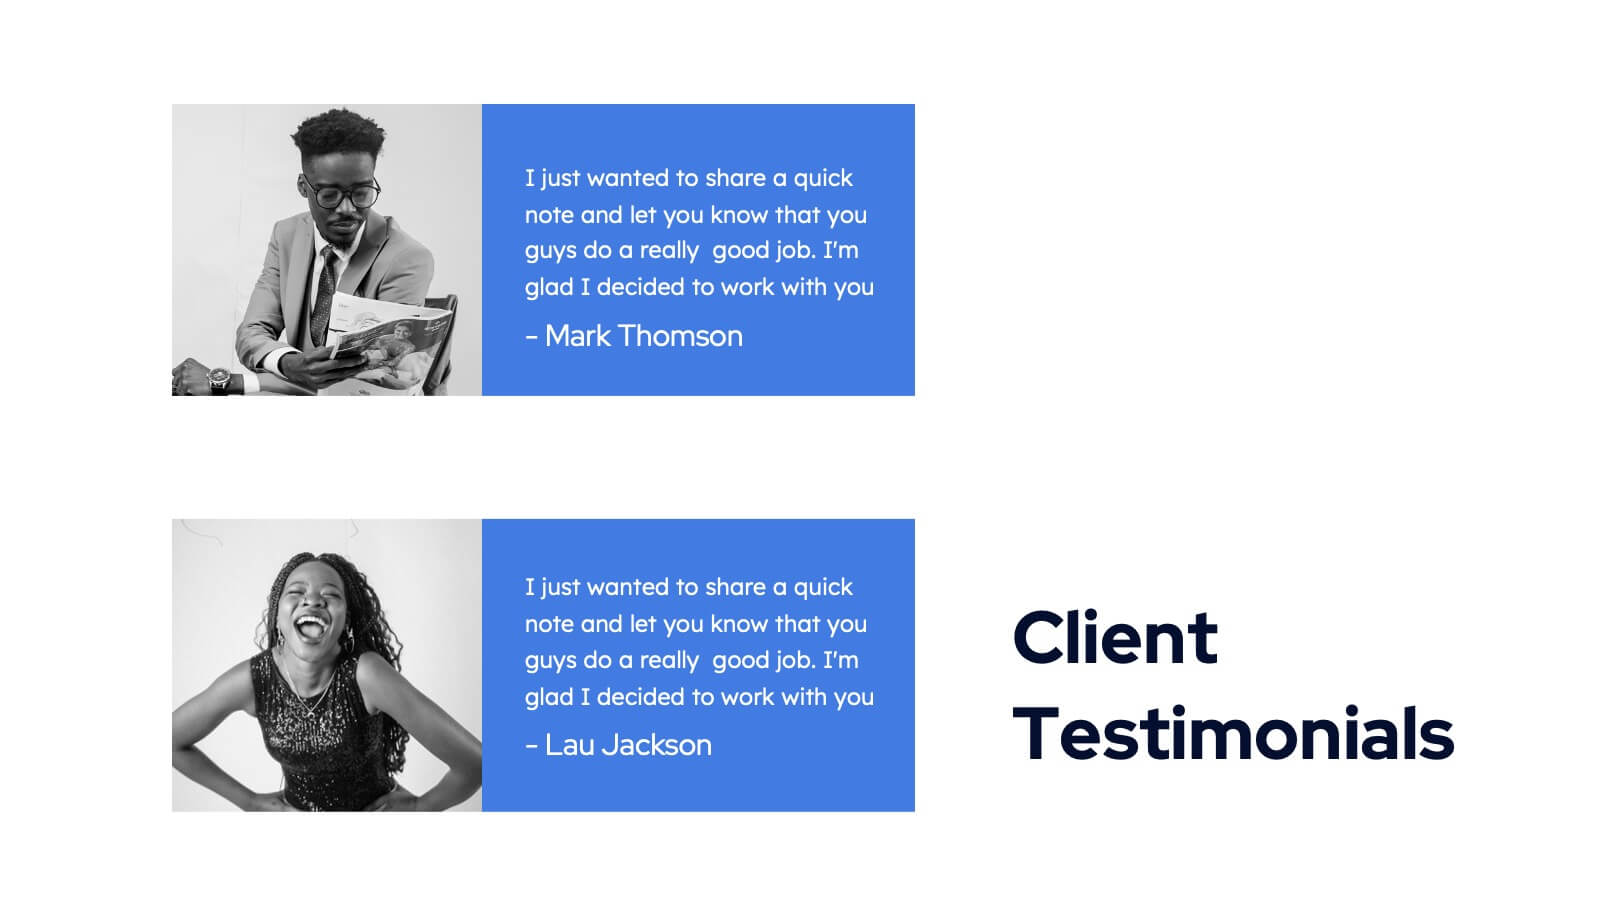
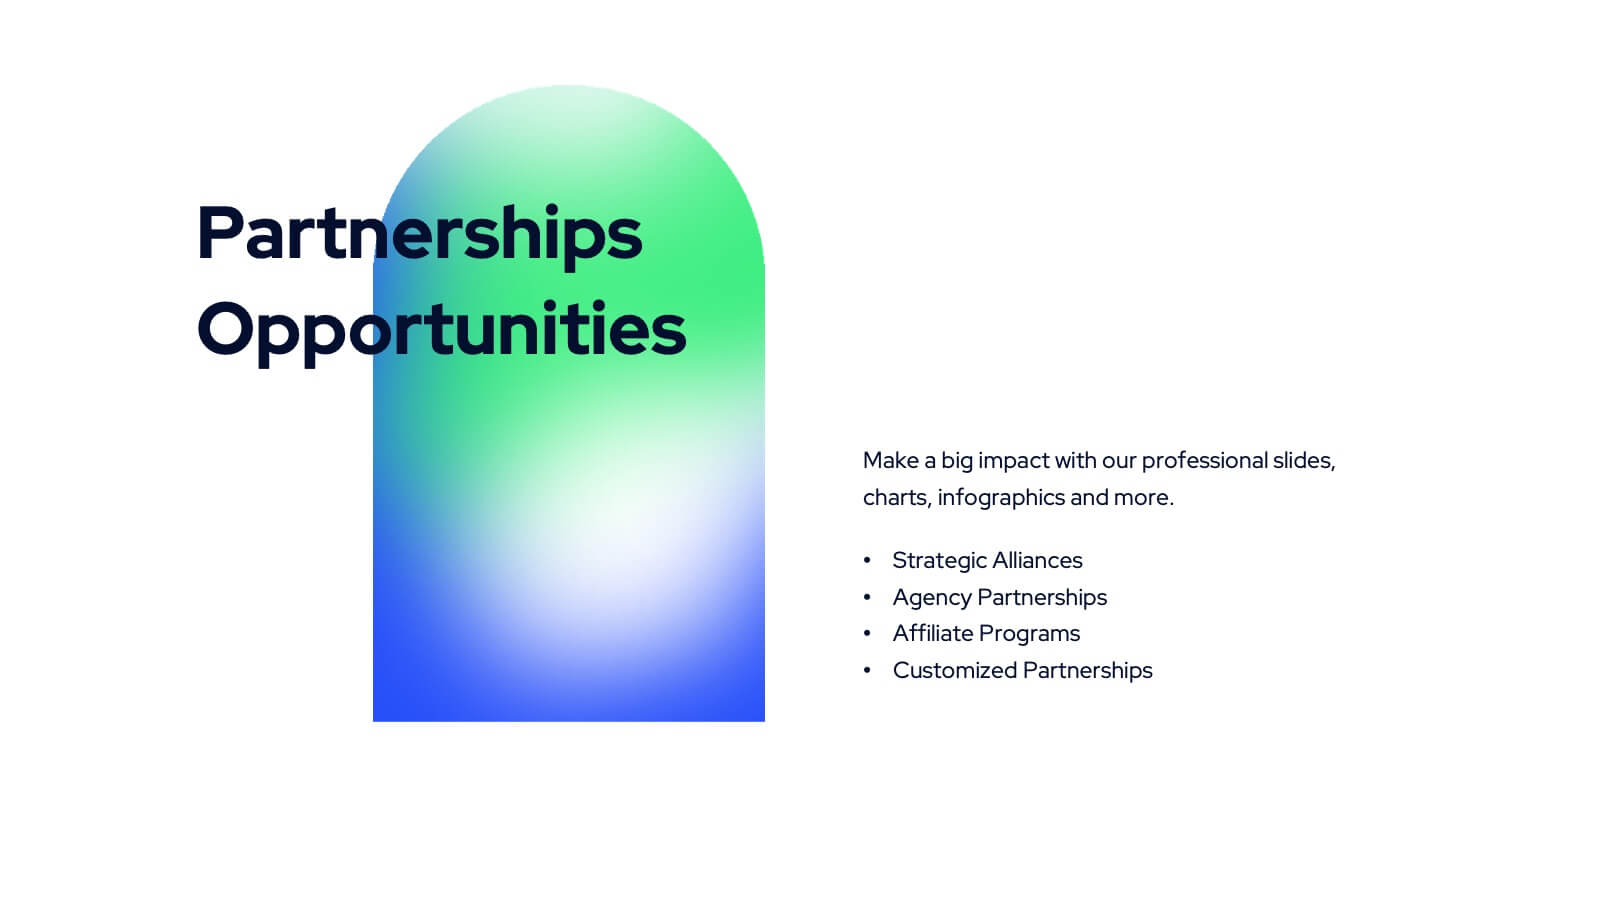
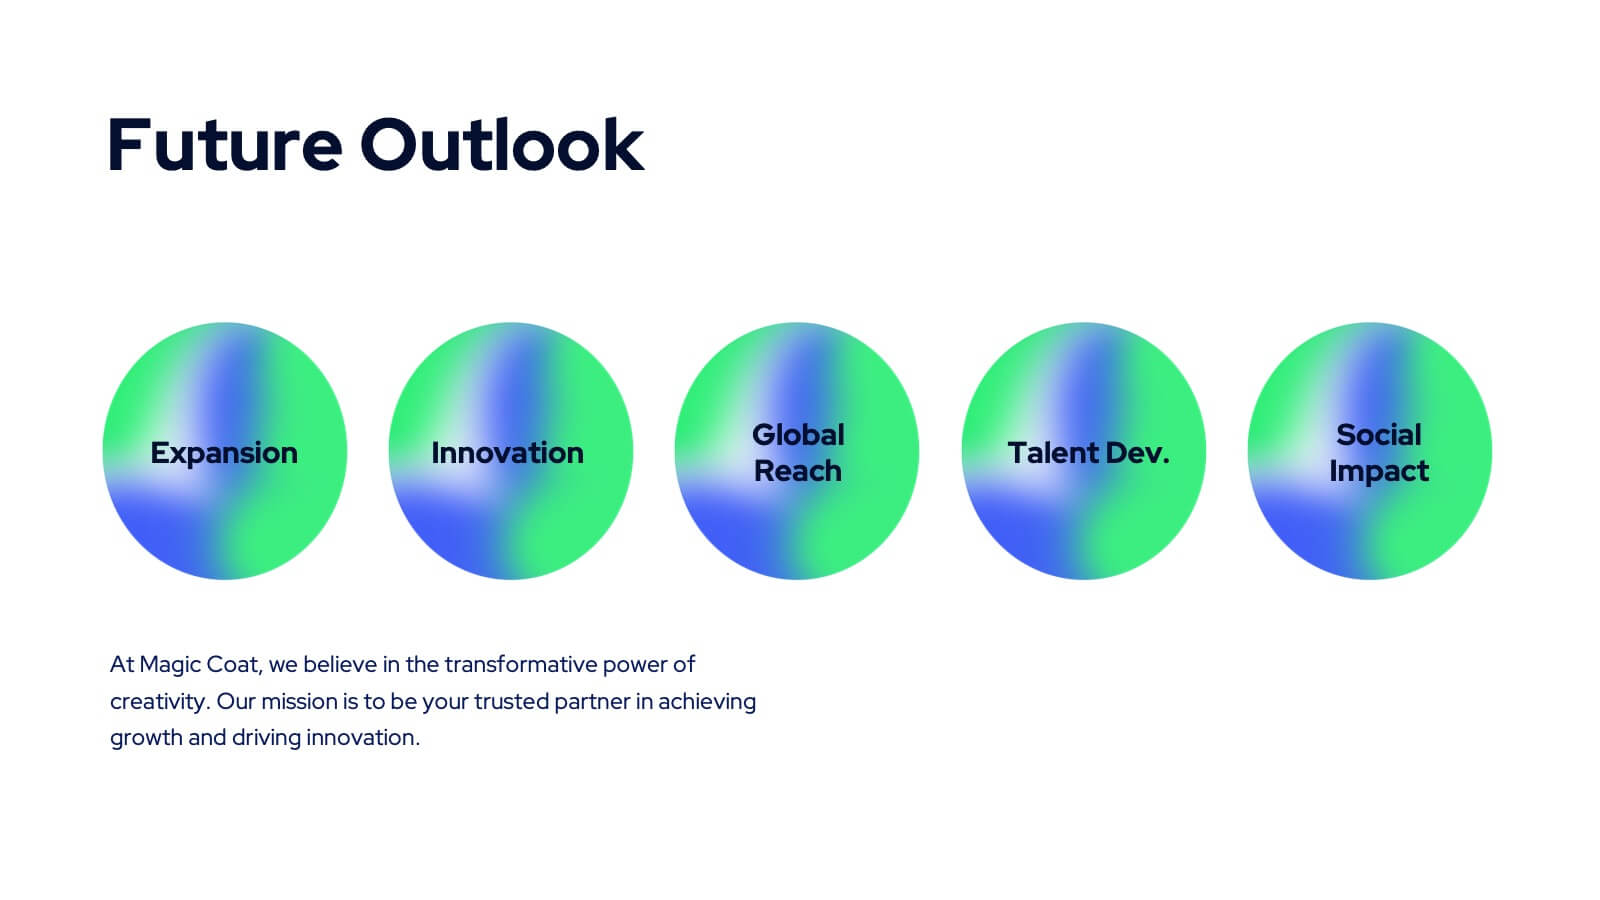
Tanzanite Full-Service Agency Project Plan Presentation
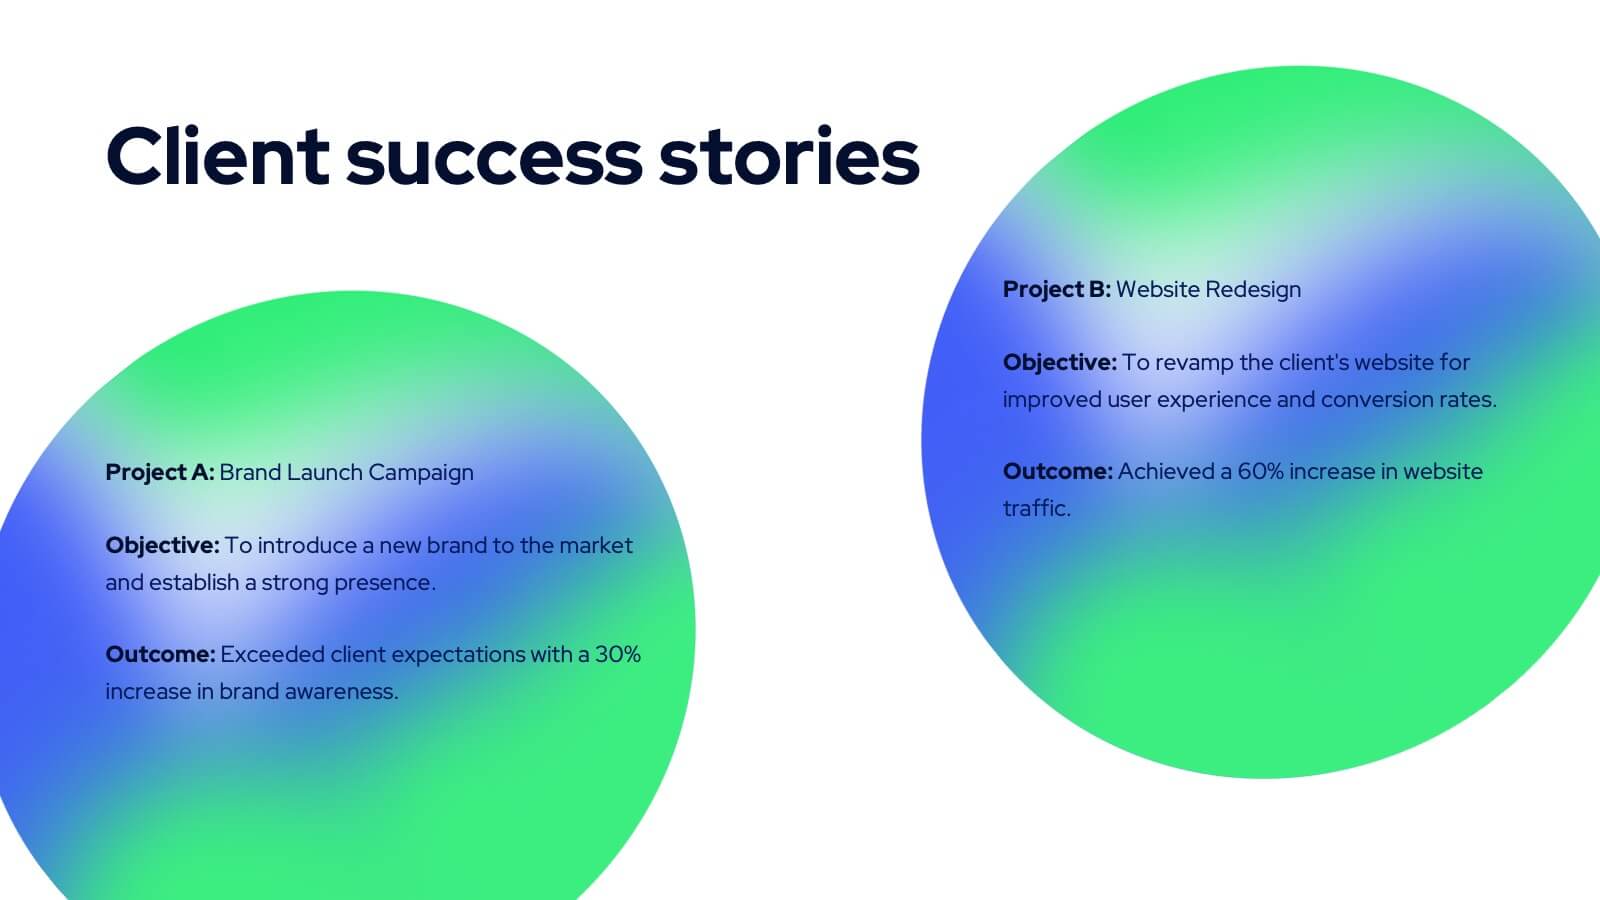
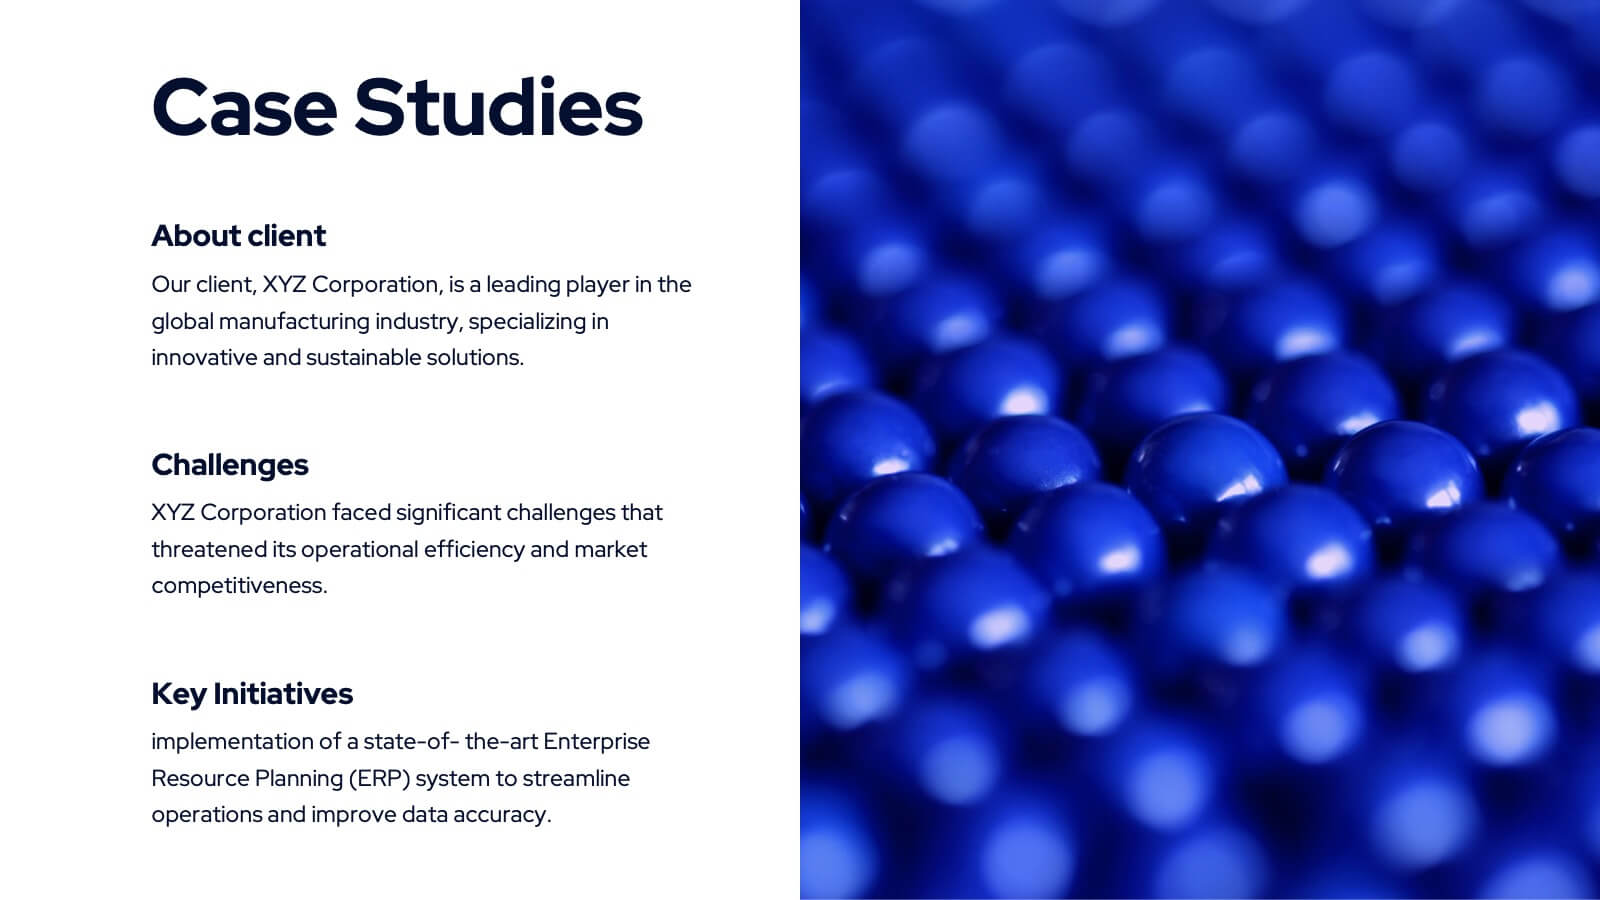
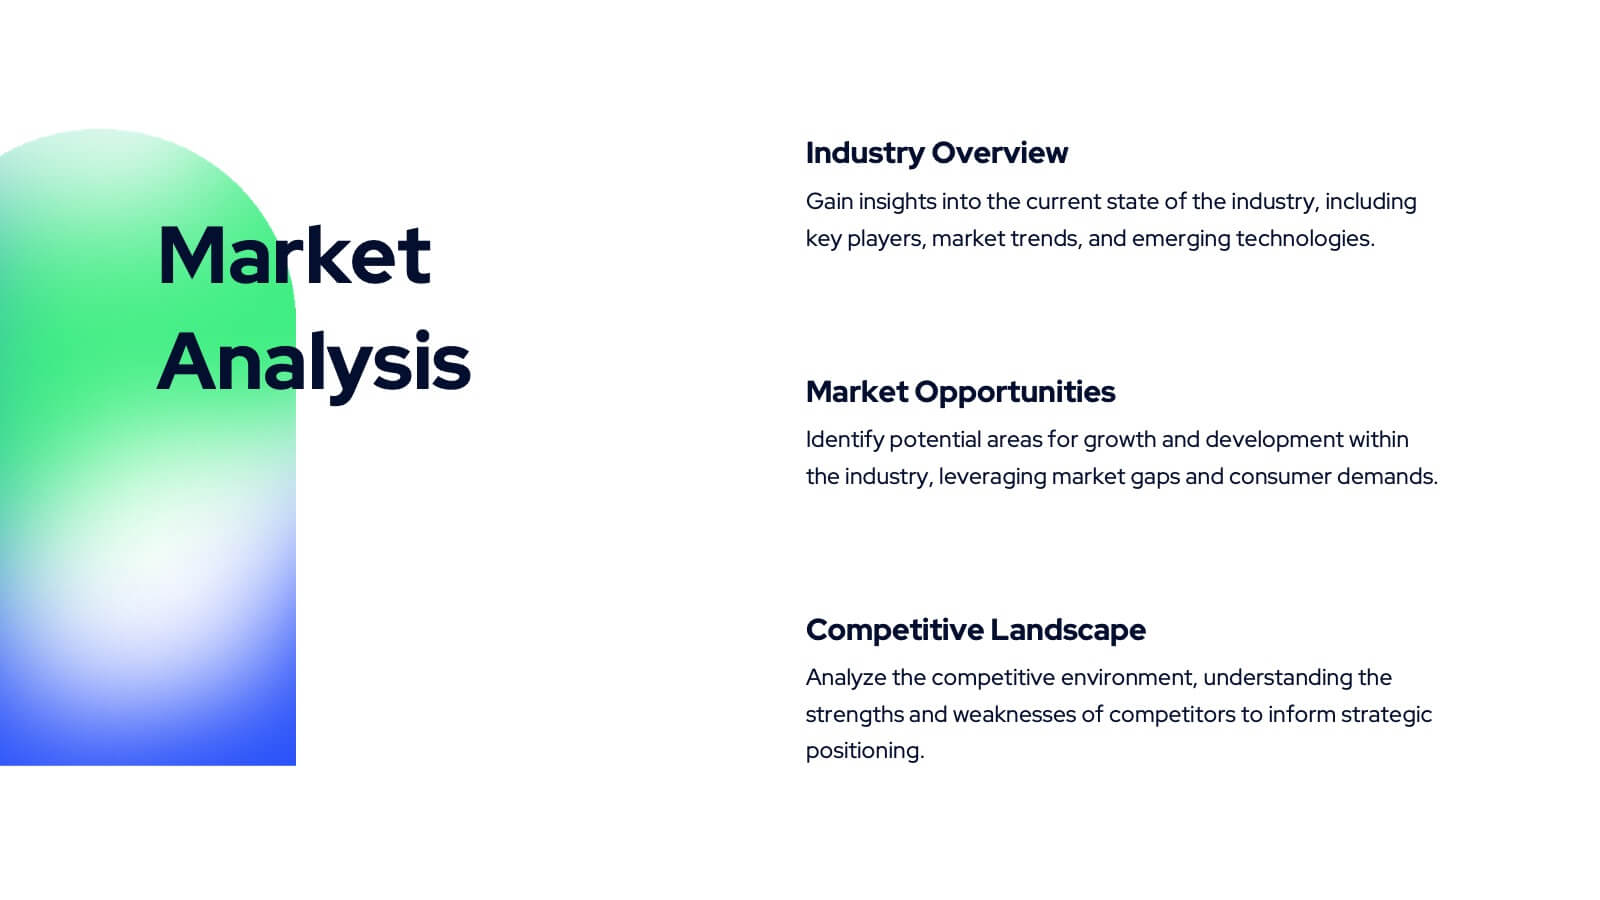
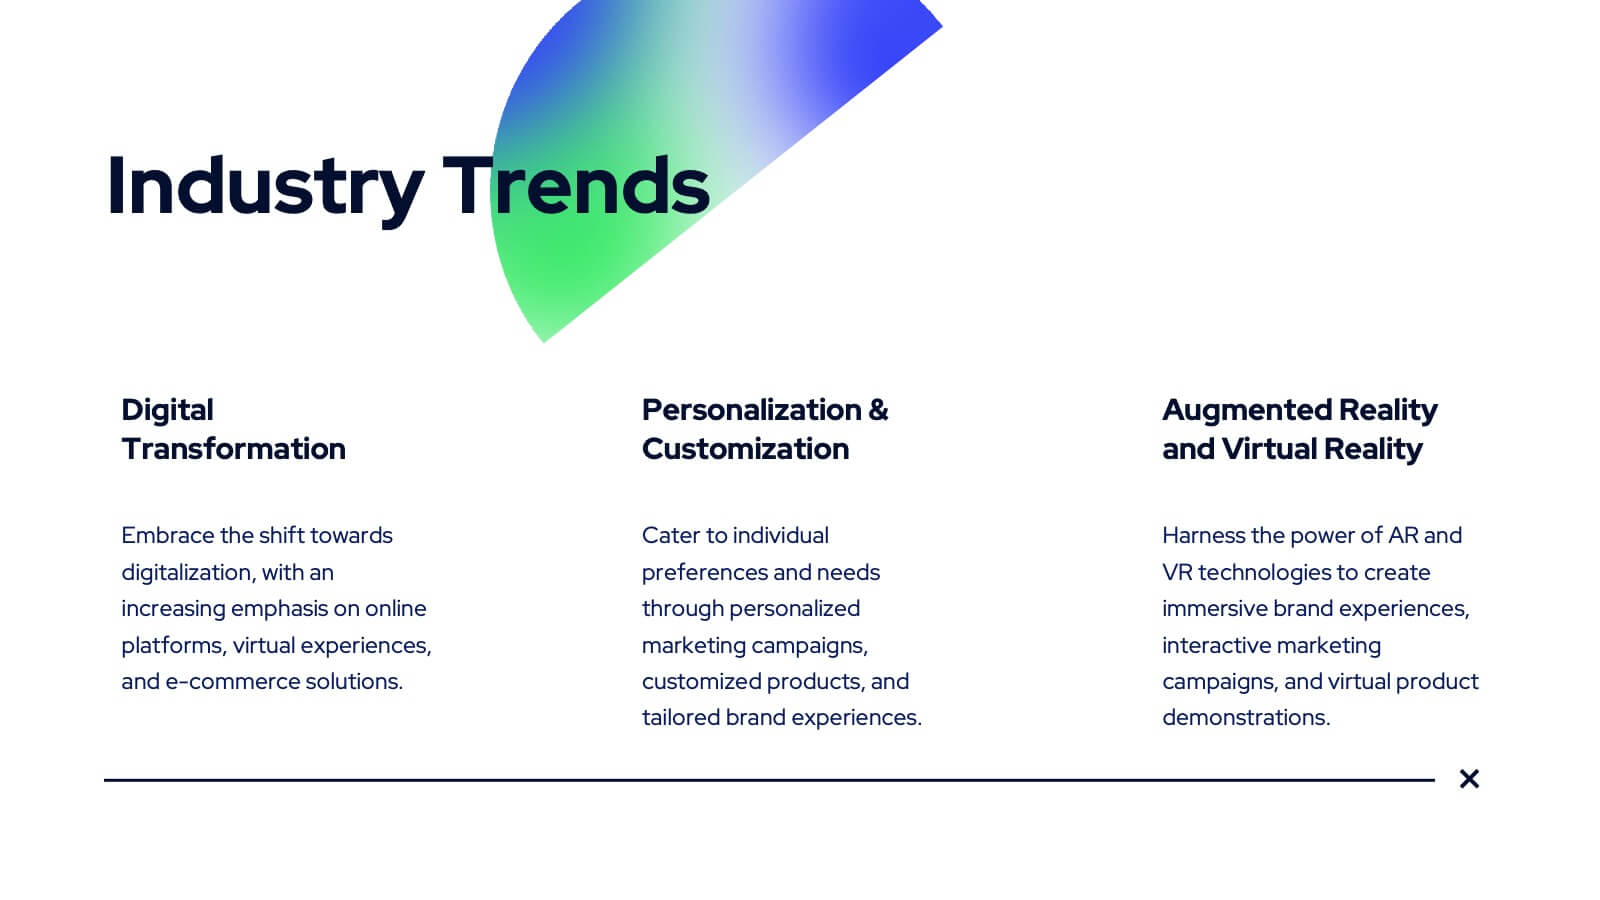
Showcase your agency's strengths with this bold and modern portfolio presentation template! From client success stories and case studies to market analysis and strategy development, this template highlights your expertise and approach. Perfect for agencies looking to present their services, creative processes, and partnerships. Compatible with PowerPoint, Keynote, and Google Slides, making it easy to impress any audience.


6 slides
Machine Learning and Data Science Presentation
Deliver insights with precision using this data-driven presentation template tailored for machine learning, AI, and analytics topics. Featuring a central hub-and-spoke design, this layout allows you to showcase key components like algorithms, tools, processes, or data sources. Each segment includes clean icons and customizable titles for seamless editing. Ideal for data scientists, tech professionals, and academic presentations. Fully editable in PowerPoint, Keynote, and Google Slides.


8 slides
Cost Analysis and Budgeting Presentation
Easily assess financial performance with the Cost Analysis and Budgeting Presentation template. This visually engaging slide helps break down cost structures, budget allocation, and financial comparisons in a clear and professional manner. Ideal for financial analysts, business strategists, and project managers presenting financial data. Fully editable in PowerPoint, Keynote, and Google Slides for effortless customization.


6 slides
RAPID Responsibility Matrix Infographics
Efficiently manage responsibilities and tasks with our RAPID Responsibility Matrix infographic template. This template is fully compatible with popular presentation software such as PowerPoint, Keynote, and Google Slides, allowing you to easily customize it to meet your specific project needs. The RAPID Responsibility Matrix infographic template offers a structured framework for defining roles and responsibilities within your team or organization. Whether you're a project manager, team leader, or simply looking to streamline workflows, this template provides a user-friendly platform to create clear and concise matrices for your projects. Optimize your project management processes with this SEO-optimized RAPID Responsibility Matrix infographic template, thoughtfully designed for clarity and ease of use. Customize it to assign and communicate responsibilities effectively, ensuring smooth collaboration and project success. Start crafting your personalized infographic today!


5 slides
Behavioral Psychology Insights Presentation
Dive deep into the human mind with our 'Behavioral Psychology Insights' presentation template. Perfect for educators and professionals, this template offers a structured way to present complex psychological concepts visually. Ideal for delivering engaging presentations on human behavior, it is compatible with PowerPoint, Keynote, and Google Slides.


4 slides
Green Business Sustainability Report Presentation
Communicate your sustainability efforts effectively with the Green Business Sustainability Report Presentation template. This visually engaging slide deck is designed to showcase eco-friendly business initiatives, corporate responsibility strategies, and environmental impact assessments. With an organic, nature-inspired design and a clear, structured layout, this template is perfect for sustainability consultants, corporate leaders, and environmental advocates. Fully editable and compatible with PowerPoint, Keynote, and Google Slides for seamless customization and presentation.


7 slides
Thank You Card Infographic
Celebrate the art of gratitude with this sophisticated collection, perfectly blending contemporary design with a personal touch. Each layout is crafted with aesthetic finesse, featuring subtle color palettes, elegant typography, and thoughtful placement of visual elements that enhance the warmth of your message. Offering a variety of designs from minimalist to richly textured backgrounds, this collection provides a unique backdrop for expressing thanks. Customize these cards for any occasion, whether it's professional gratitude towards colleagues and clients, or personal appreciation for friends and family. Ideal for both digital expressions and printed notes, this set ensures your message of thanks is received with the sentiment it’s intended. It’s a wonderful way to convey appreciation and leave a memorable impression on its recipients.


5 slides
Project Status Update and Timeline Presentation
Keep your team aligned with this clean, easy-to-read status update template. Featuring progress bars, monthly Gantt chart visuals, and icons for each task, it’s perfect for tracking milestones, team updates, and project phases. Fully editable in PowerPoint, Keynote, and Google Slides.


6 slides
Mind Map Ideas Infographic
A Mind Map is a visual representation of ideas, concepts, and relationships, often created around a central topic or theme. This infographic mind map template offer a versatile and effective method for organizing, analyzing, and visualizing information, making them valuable tools for learning, problem-solving, and creative exploration. The structure of this template consists of the central idea or topic placed at the center of the map. This template provides a structured way to showcase and organize ideas using the mind mapping technique. Compatible with Powerpoint, Keynote, and Google Slides.


26 slides
Corporate Finance Presentation
The "Corporate Finance" template is your financial compass for presentations that require a mix of precision and clarity. Tailored for use on PowerPoint, Keynote, and Google Slides, it is perfect for demystifying the world of corporate finance. Commence with the "Wealth strategies designed for your unique journey" slide to capture the tailored approach of your financial services. The "Table of Contents" neatly outlines the topics such as investment strategies, risk management, and financial forecasting. Introduce the minds behind the numbers with "Meet Our CEO" and "Meet Our Team" slides. Utilize the "Three Option Slide" to present different financial models, and the "Chart Slide" to depict financial performance. The "Bringing a new perception of investing" slide can redefine investment approaches, while "Feel good with Earning, Feel free to call us." invites engagement. Every slide offers the opportunity to infuse data-driven insights with compelling visuals, ensuring that your "Corporate Finance" presentation not only informs but also impresses your corporate audience.


6 slides
Problem-Solving with Design Thinking Presentation
Master complex challenges with the Problem-Solving with Design Thinking presentation. This structured layout helps visualize ideas, collaboration, and strategic solutions through an intuitive, professional design. Ideal for workshops, business innovation, and strategic planning. Fully customizable and compatible with PowerPoint, Keynote, and Google Slides for a seamless experience.


5 slides
Human Resources Department Infographics
The Human Resources (HR) department is an integral part of an organization, responsible for managing and developing the organization's human capital. These informative infographics aim to provide a comprehensive overview of the functions, roles, and importance of the HR department in managing the organization's workforce. Whether used in HR conferences, employee orientations, or internal communications, this template helps convey crucial information in a visually appealing manner, enhancing understanding for the HR department's role in managing and developing the organization's most valuable asset - its people.


5 slides
Responsibility Assignment Using RACI Model Presentation
Visualize role clarity with the Responsibility Assignment Using RACI Model Presentation. This template helps define team responsibilities across four key roles—Responsible, Accountable, Consulted, and Informed—in a simple and clean radial layout. Ideal for aligning teams, assigning tasks, and preventing confusion. Fully customizable in PowerPoint, Canva, and Google Slides.


5 slides
Comparison Table for Feature Mapping Presentation
Compare your product features with ease using this Comparison Table for Feature Mapping presentation. Ideal for highlighting similarities and differences across multiple offerings, this layout uses clean visuals and color-coded elements to show feature availability per product. Perfect for product teams, marketing, or internal decision-making. Compatible with PowerPoint, Canva, and Google Slides.


5 slides
Enterprise Risk Management Framework Presentation
Visualize your organization’s risk strategy with the Enterprise Risk Management Framework Presentation. This slide outlines four core steps—Set Objective, Identify Risks, Assess Risks, and Risk Response—using a clear, directional design. Perfect for risk assessments, board updates, or audit reviews. Fully editable in PowerPoint, Google Slides, and Canva.


5 slides
Skills Gap Assessment Presentation
Spot talent strengths and uncover hidden weaknesses with a clean, visual layout that makes workforce insights easy to understand. This presentation helps teams evaluate current abilities, identify missing competencies, and plan targeted development. Ideal for HR, training, and leadership reviews. Fully compatible with PowerPoint, Keynote, and Google Slides.


6 slides
Country Highlight Map North America Presentation
Showcase your regional focus with a clean, data-driven map that highlights key areas across the United States. Perfect for presenting business coverage, demographic data, or strategic expansion points, this layout keeps visuals sharp and organized. Fully compatible with PowerPoint, Keynote, and Google Slides for effortless customization and presentation.