


Features
- 6 Unique slides
- Fully editable and easy to edit in Microsoft Powerpoint, Keynote and Google Slides
- 16:9 widescreen layout
- Clean and professional designs
- Export to JPG, PDF or send by email


Do you have any questions?
Recommend


22 slides
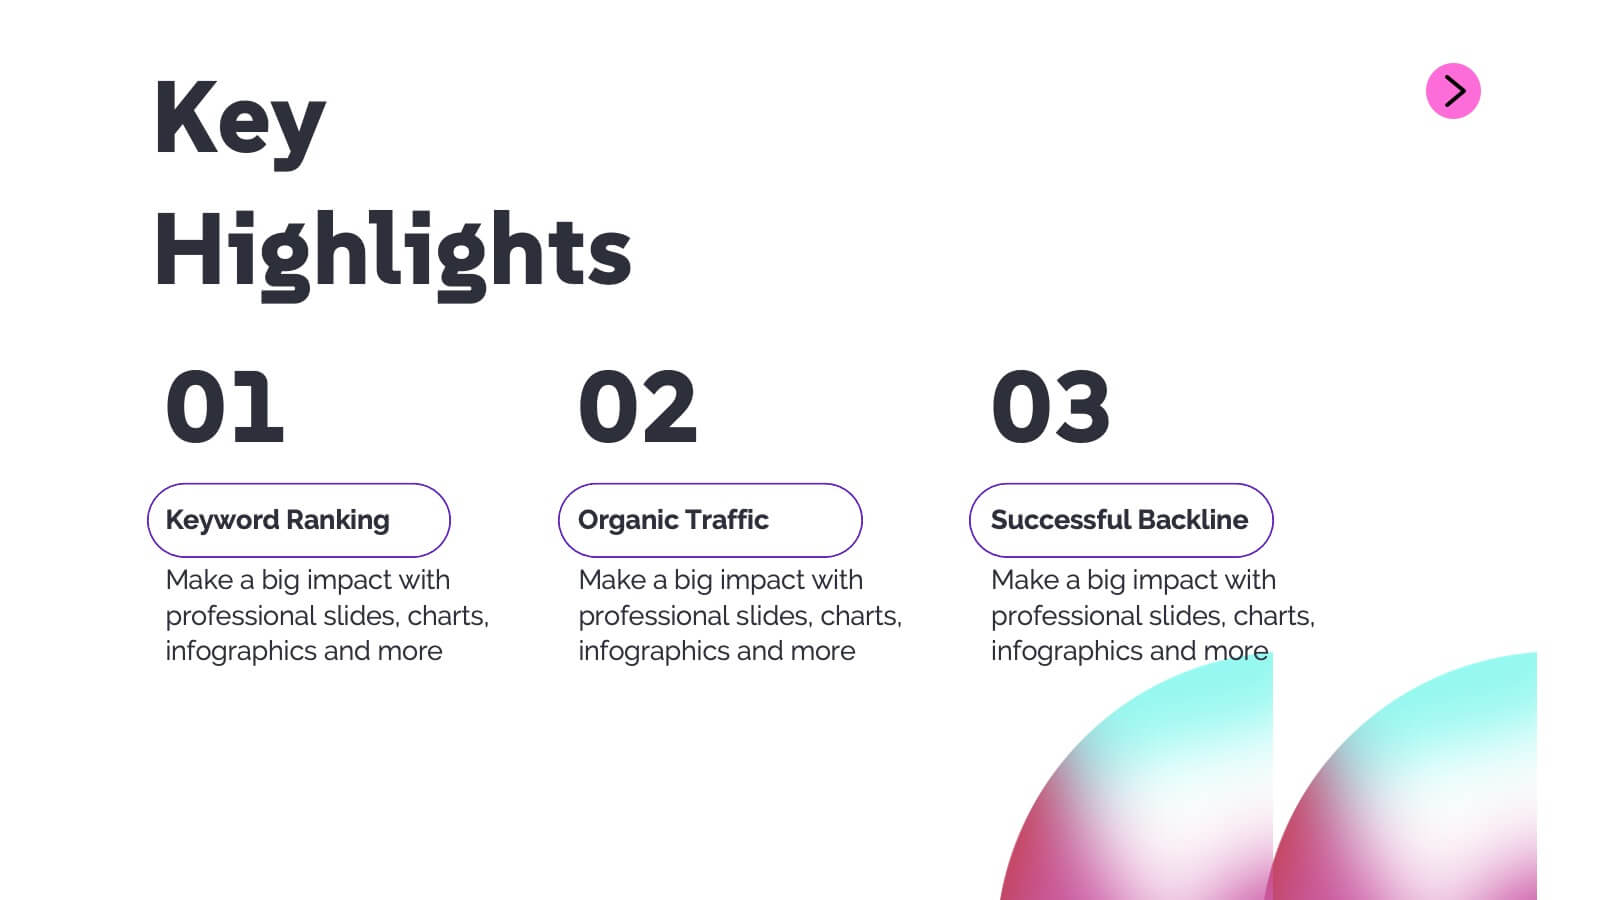
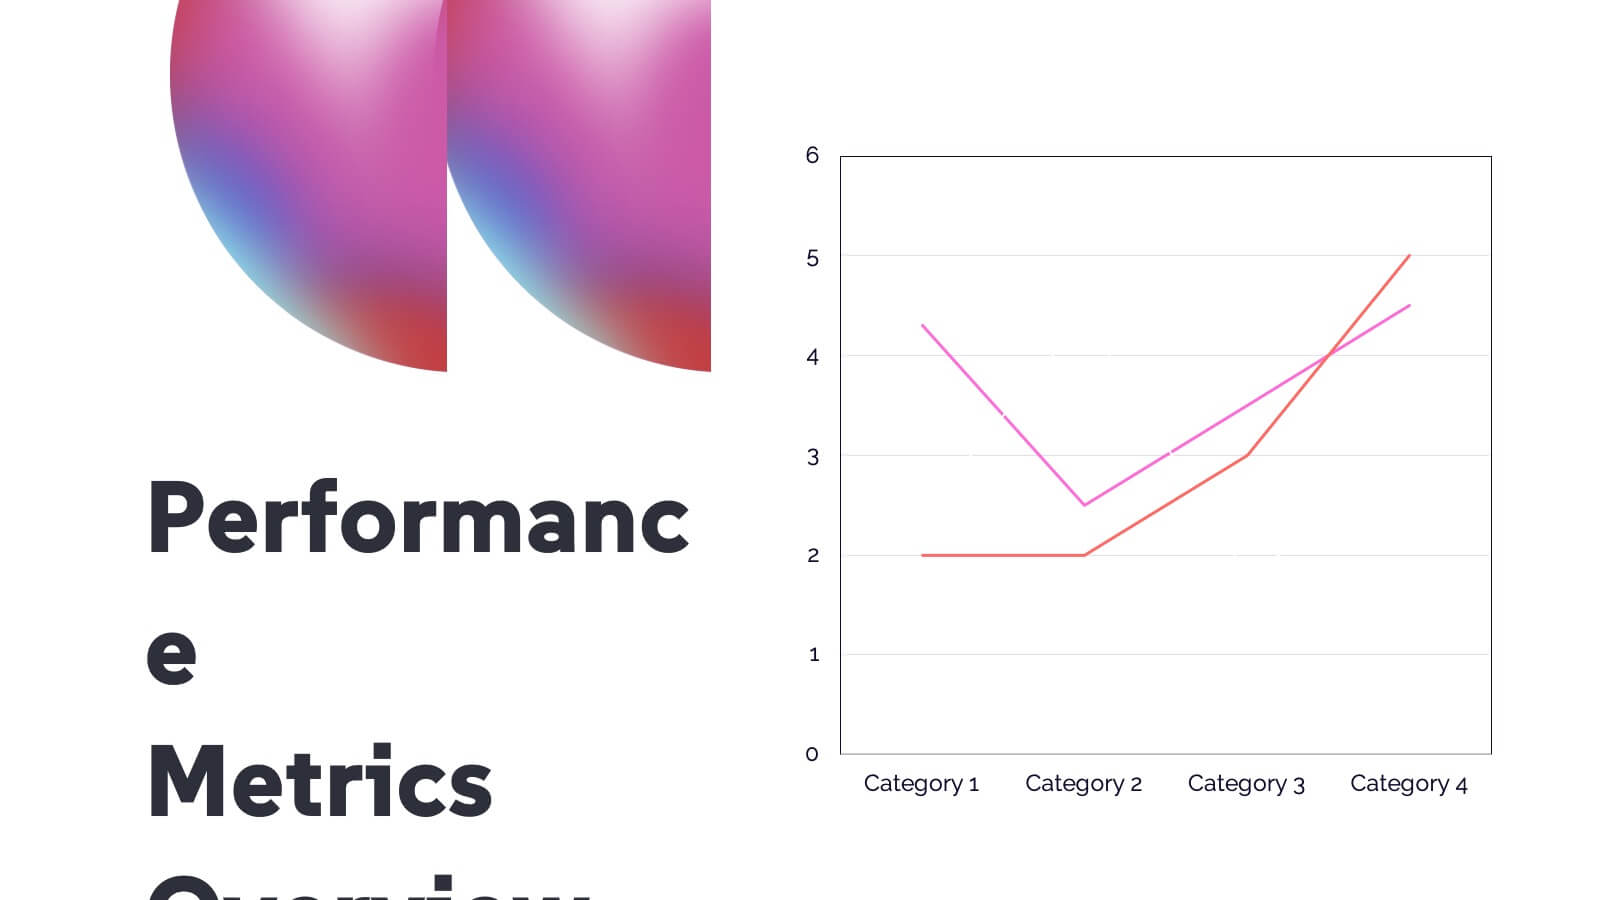
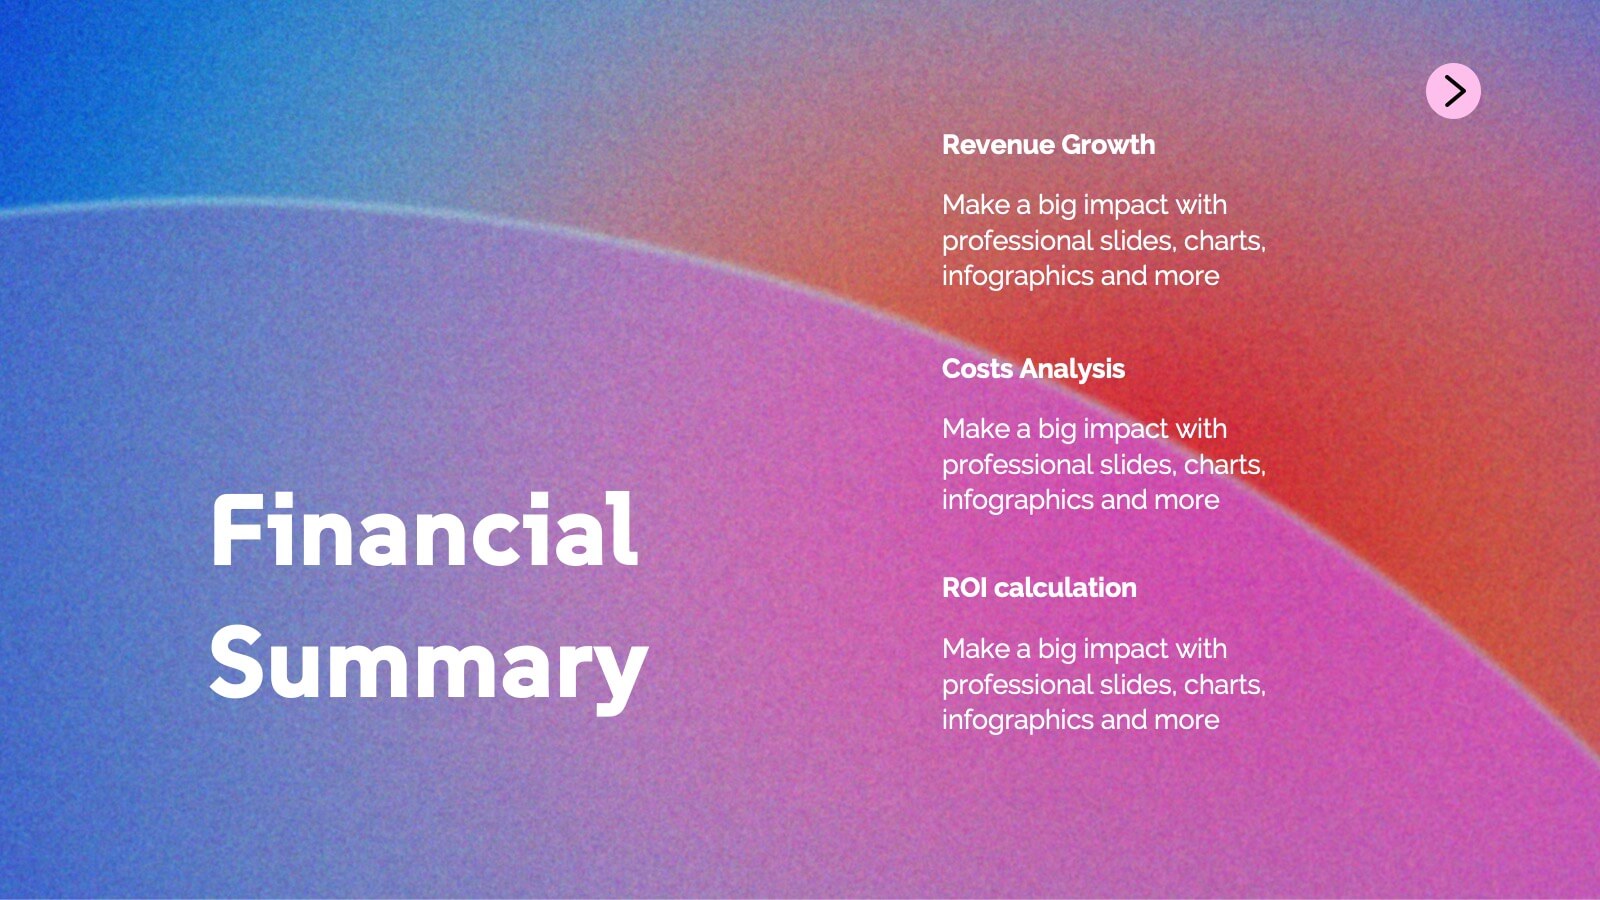
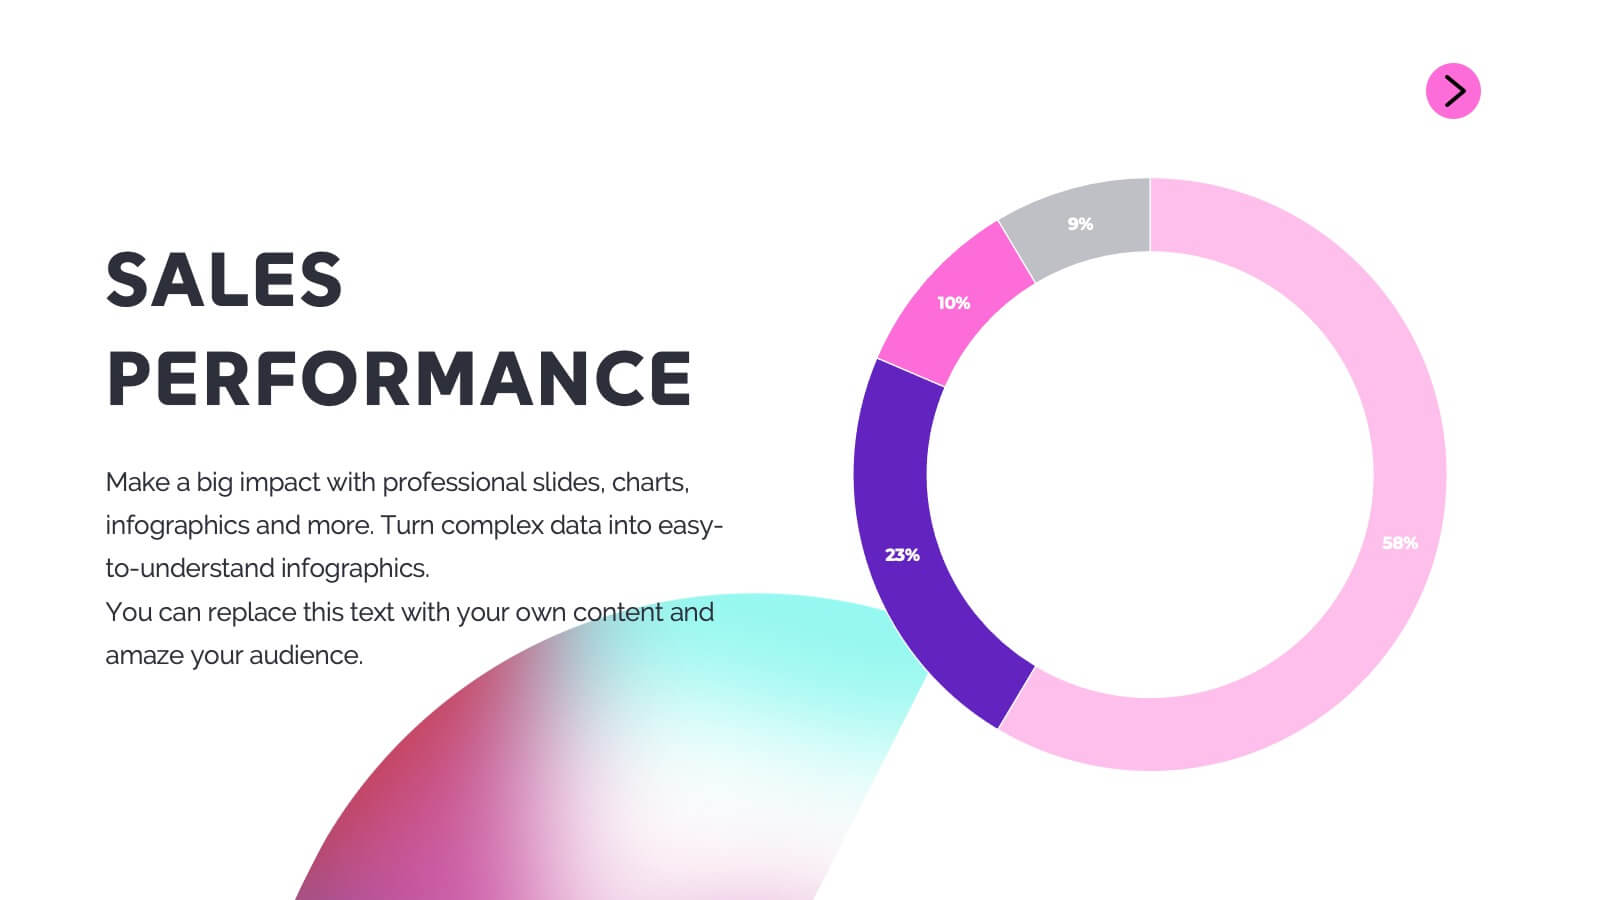
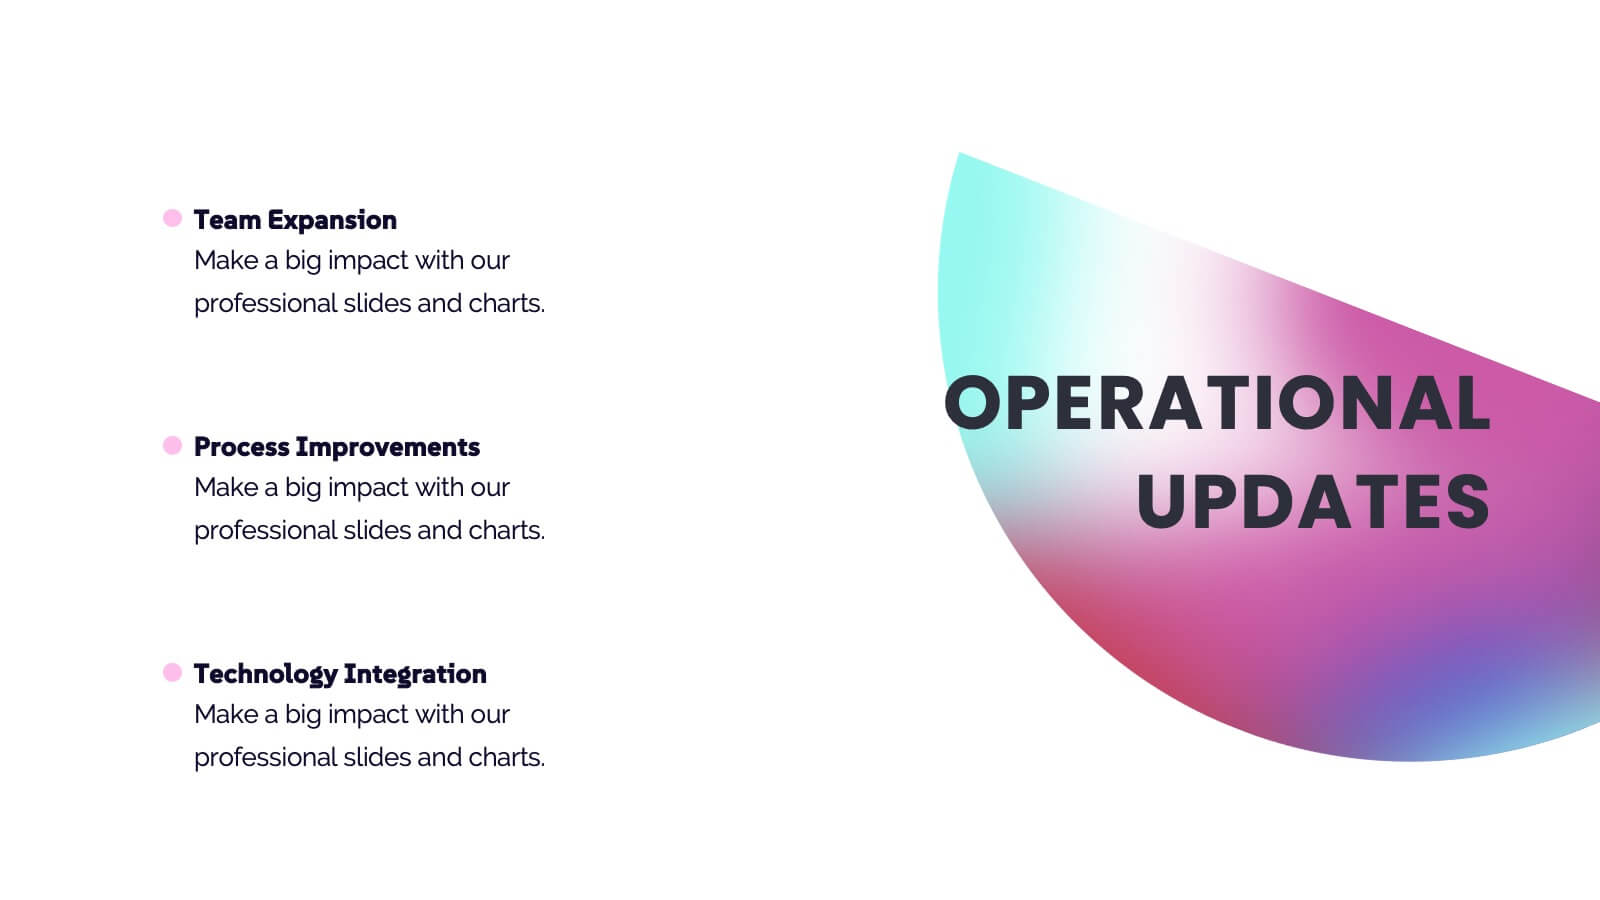
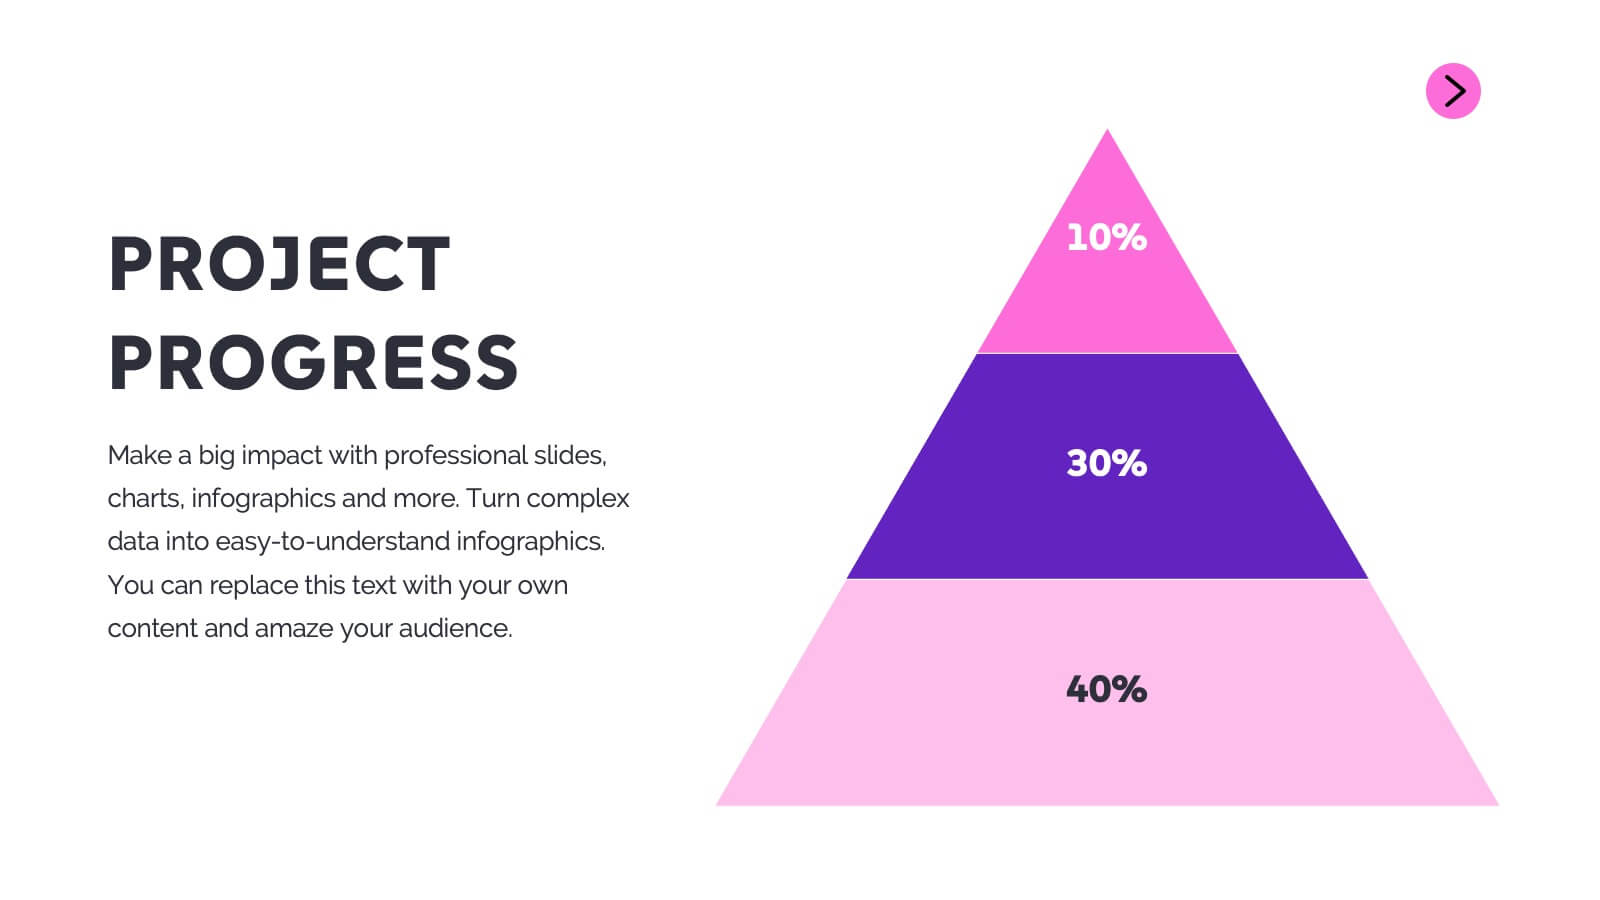
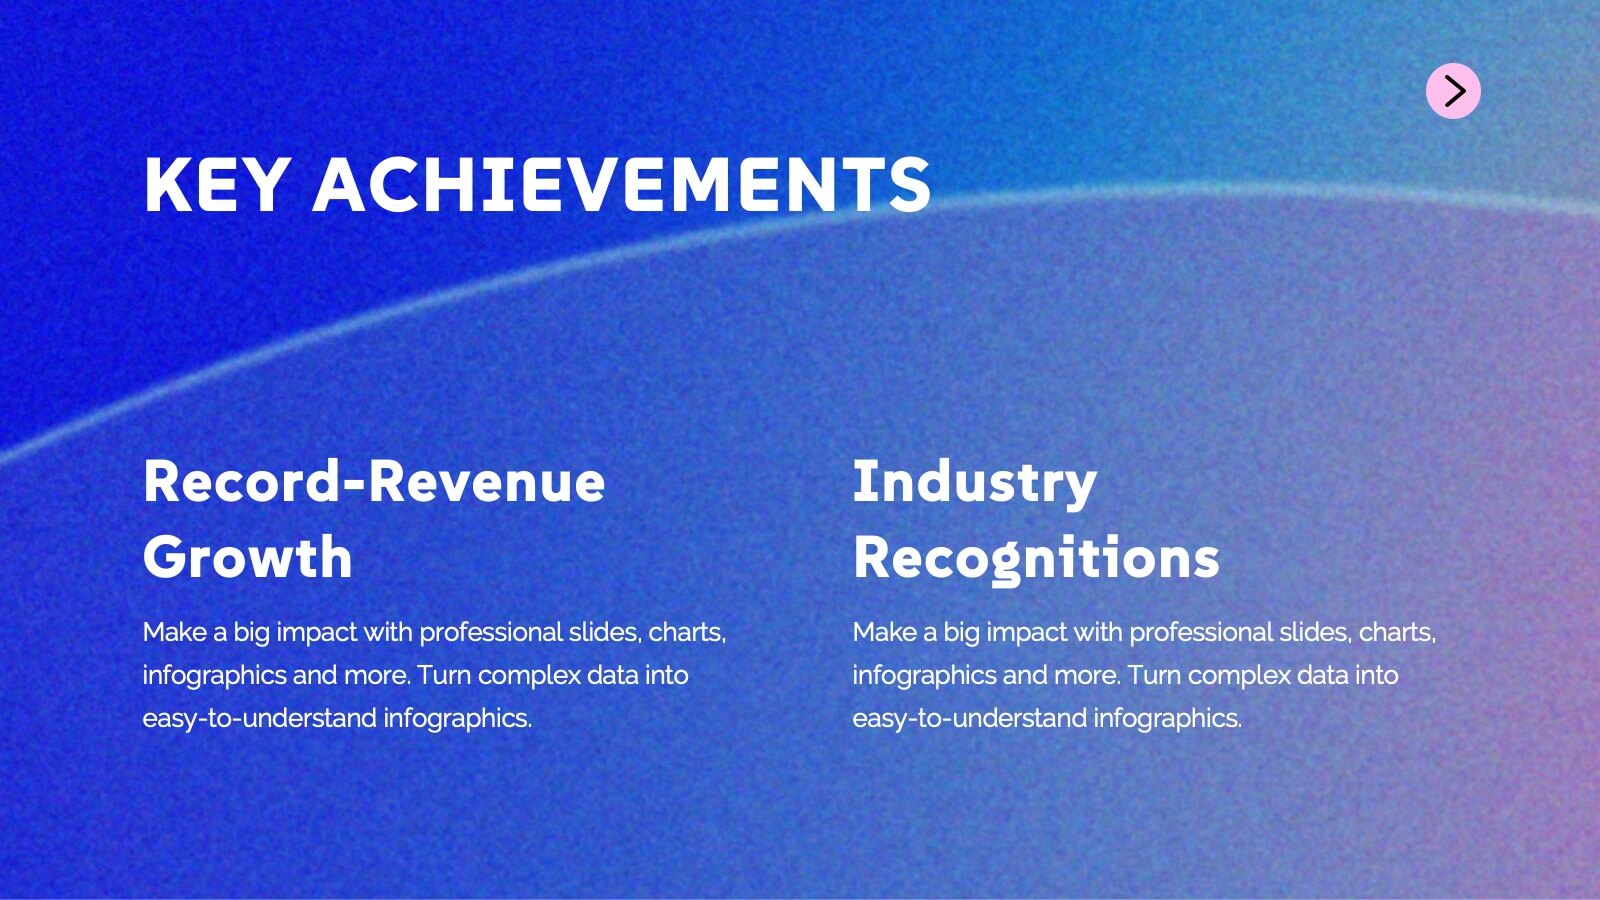
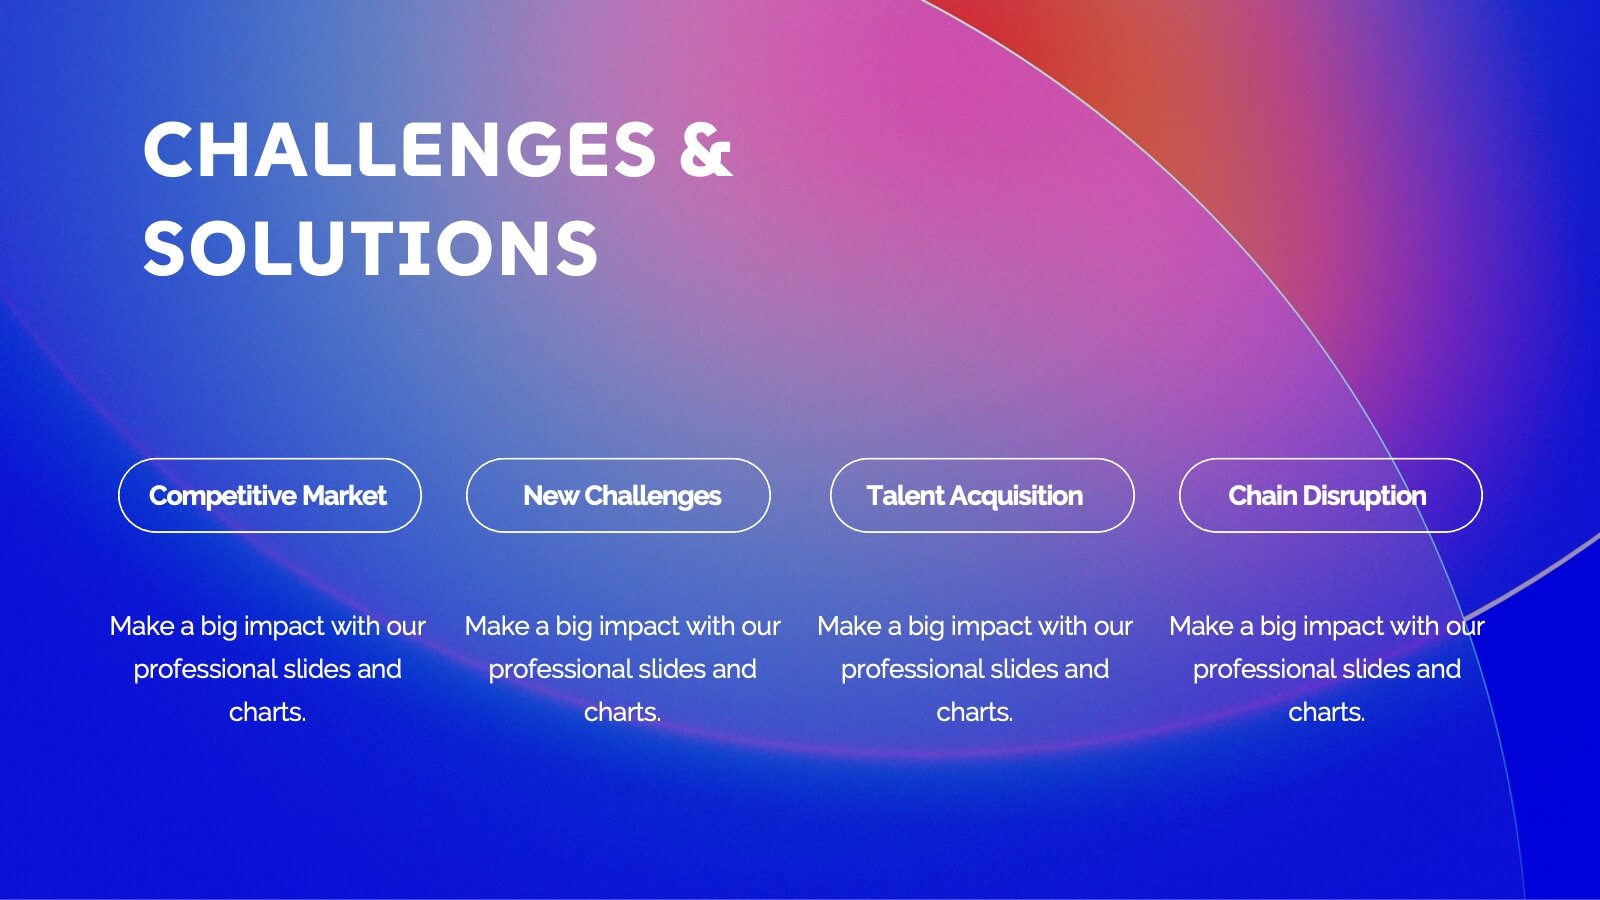
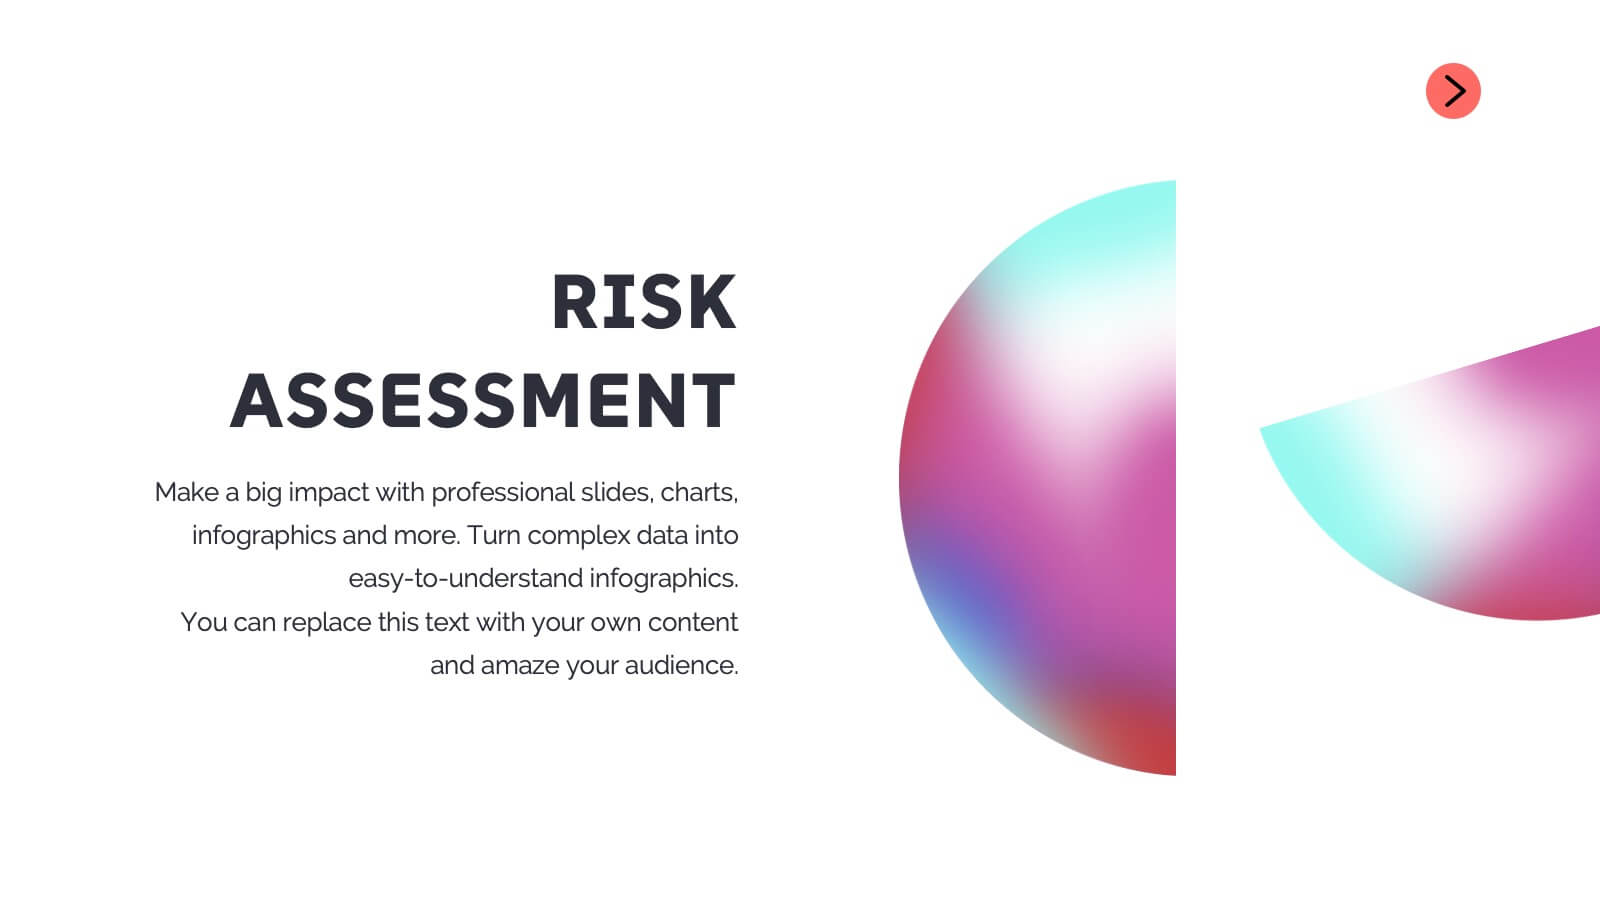
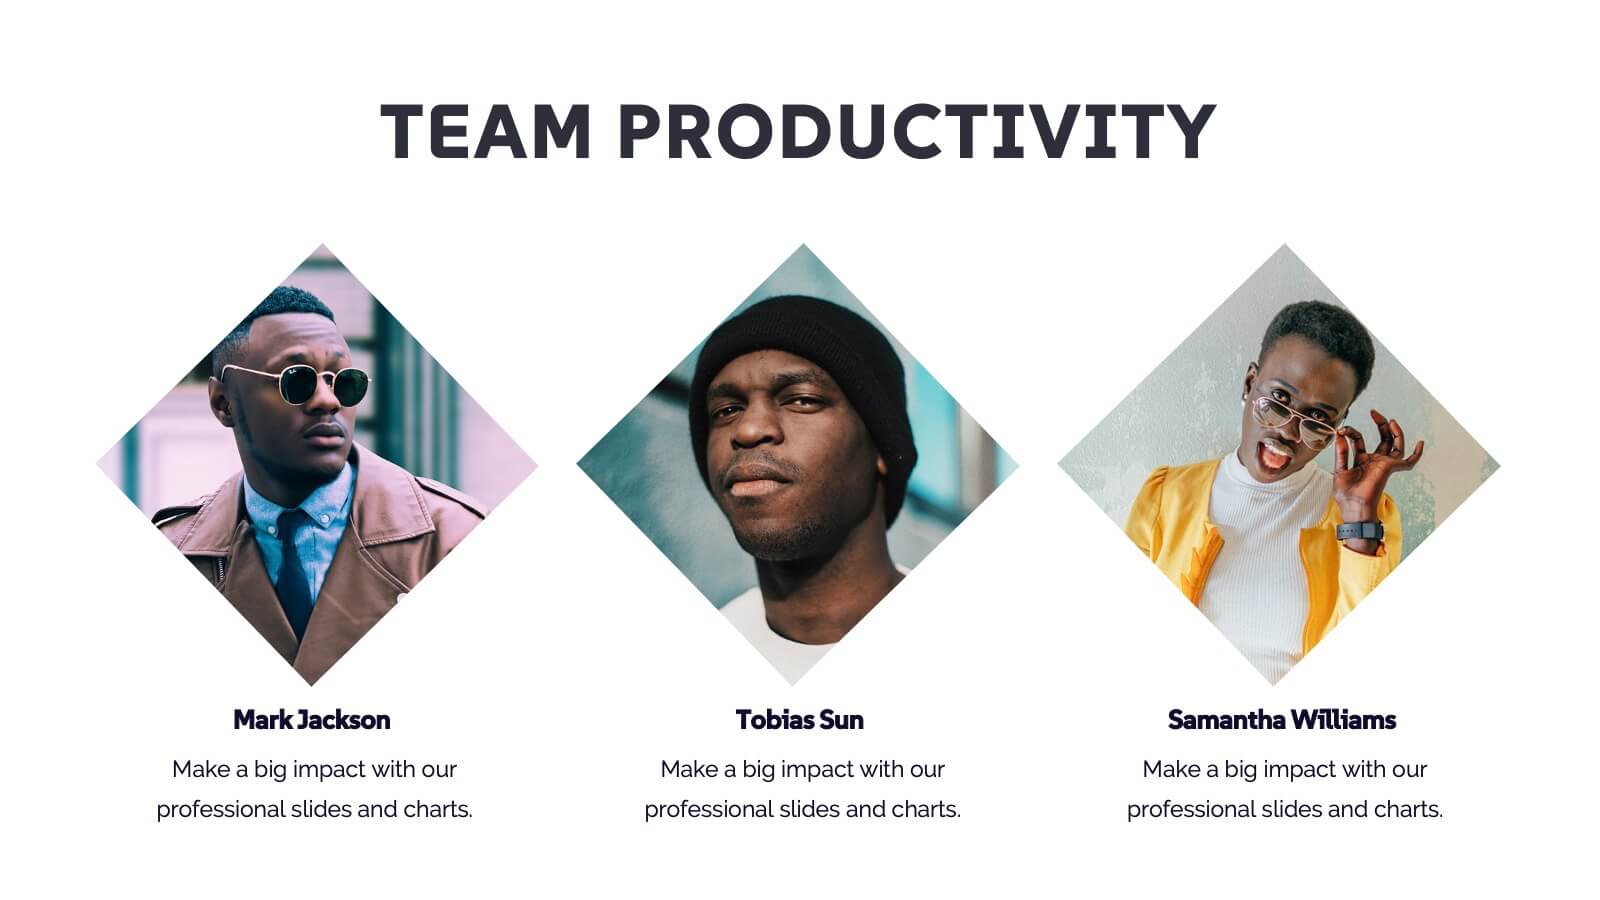
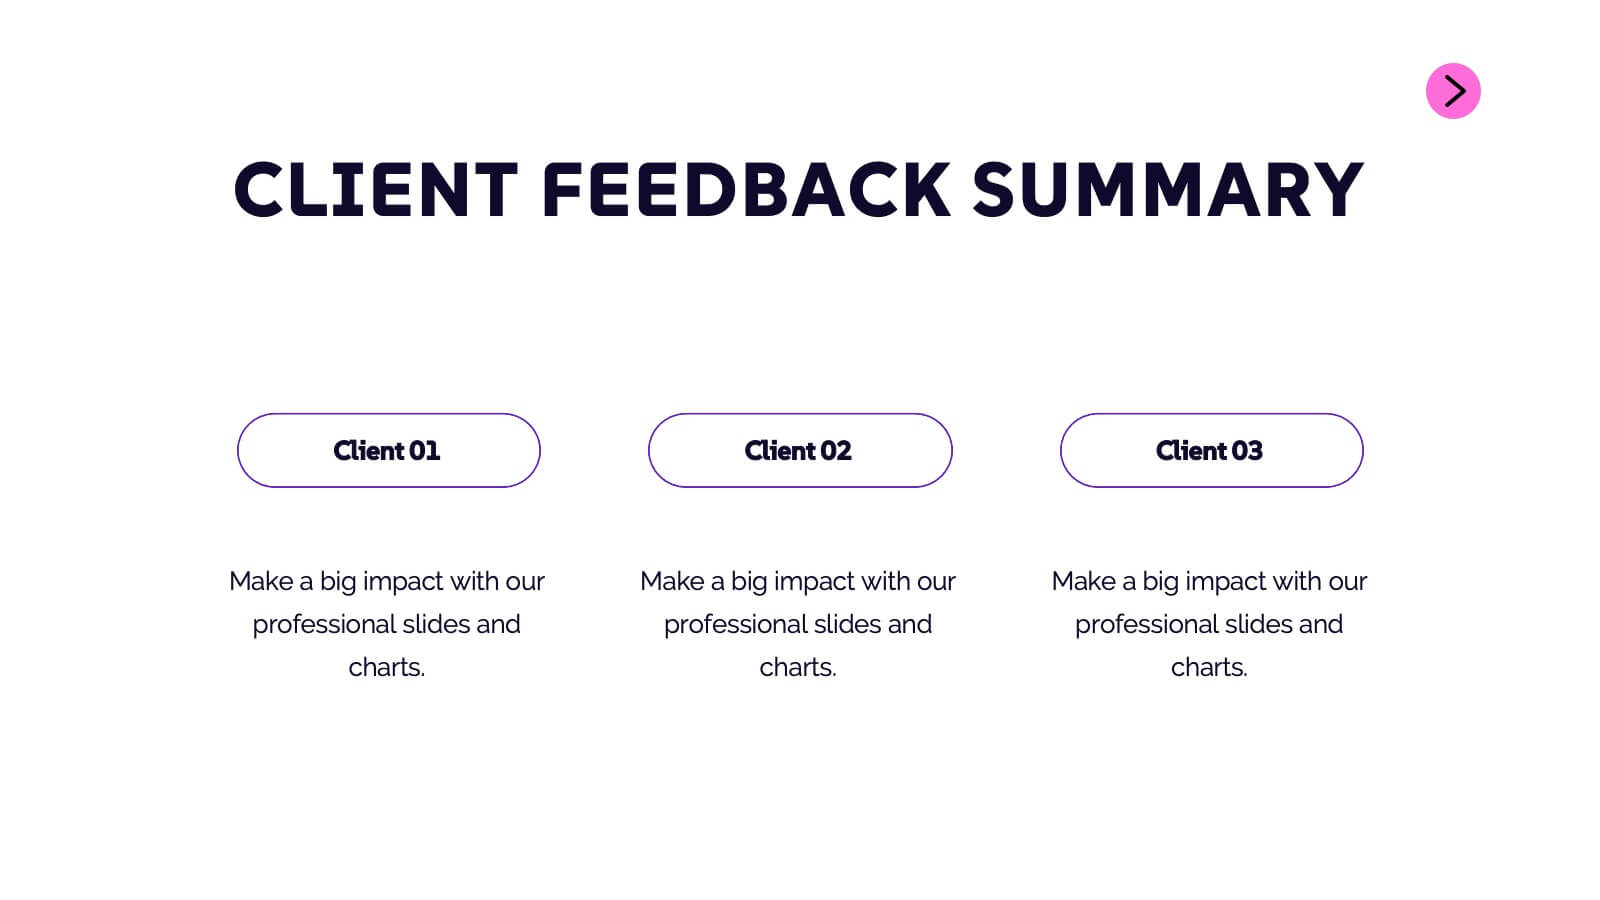
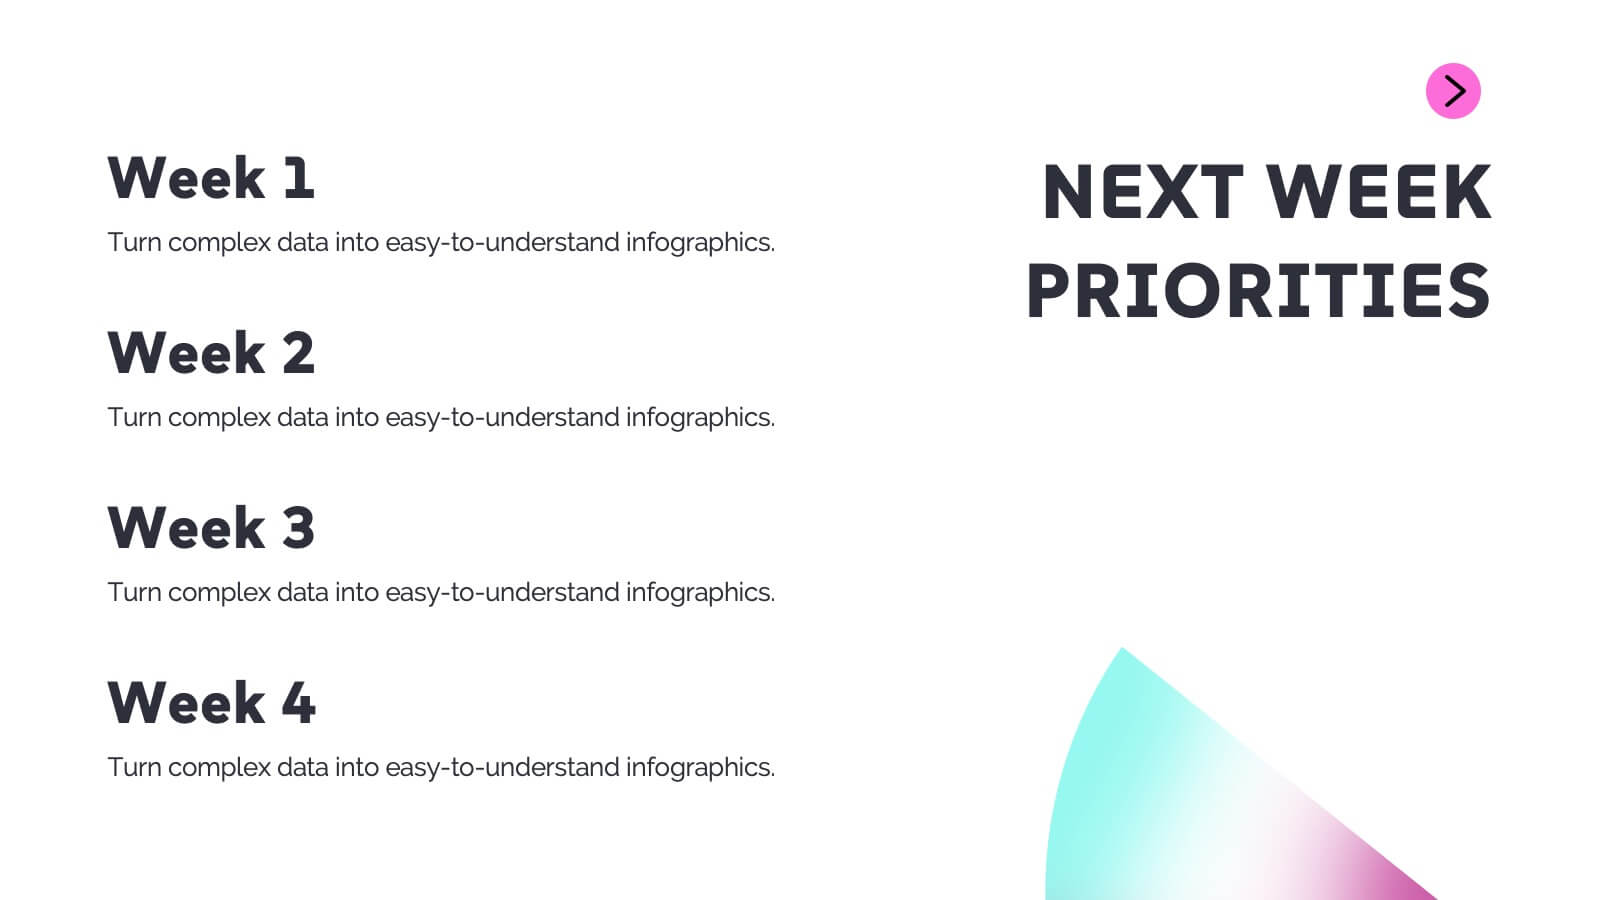
Sphinx Project Status Report Presentation
This modern project status report template is perfect for tracking progress and highlighting key achievements. It includes sections for performance metrics, financial summaries, challenges, and strategic initiatives. Keep stakeholders informed with clear, concise updates. Compatible with PowerPoint, Keynote, and Google Slides for easy customization and presentation.


6 slides
Comparative Analysis with Butterfly Chart Presentation
The "Comparative Analysis with Butterfly Chart" presentation template offers a visually striking way to compare and contrast data between two entities, such as Supplier A and Supplier B, across multiple variables. This format is particularly useful for presentations aiming to showcase cost comparisons, performance evaluations, or any side-by-side metric analysis in a concise and impactful way. Each variable is represented by a row of circles, where the color intensity and the number of circles filled can denote different levels of achievement or value, making it clear at a glance where strengths and disparities lie.


14 slides
Leadership Training Workshop
Build stronger leaders with a visually engaging puzzle-style layout that maps out each stage of leadership development. This training workshop presentation uses an intuitive, step-by-step format to guide your audience through key growth areas, making it perfect for team-building or executive sessions. Fully compatible with PowerPoint, Keynote, and Google Slides.


6 slides
Cyber Security Architect Infographic
Cybersecurity refers to the practice of protecting computer systems, networks, and data from unauthorized access, use, disclosure, disruption, modification, or destruction. This infographic template provides an overview of the role and responsibilities of a cyber security architect. This template is designed to showcase the key skills, expertise, and activities involved in the field of cyber security architecture. The infographic features a modern and professional design that immediately grabs attention. The infographic includes practical tips and best practices for individuals interested in pursuing a career as a cyber security architect.


6 slides
Academy Sports Infographic
Sports are physical activities or games that involve individual or team competition and are typically governed by specific rules. This infographic template highlights key aspects of sports and physical activities in an academy setting. Whether it's a school sports program, a community sports academy, or a professional training institute, this infographic provides a comprehensive overview of the benefits, programs, and facilities offered by an academy sports institution. This template is compatible with Powerpoint, Keynote, and Google Slides making it easy to navigate and can be easily customized to fit your presentation needs.


6 slides
Future Trends in Tech Presentation
Forecast innovation with clarity using this Future Trends in Tech Presentation. Designed with a modern silhouette head and brain visualization, this slide emphasizes key trend comparisons using icon-labeled callouts and bold percentage highlights. Ideal for tech forecasting, AI adoption, or market prediction topics. Fully editable in PowerPoint, Keynote, and Google Slides—available in both light and dark modes.


12 slides
Customer Demographics Map Presentation
Showcase customer demographics effectively with our "Customer Demographics Map Presentation" template. This infographic is crafted to display the geographical distribution of customer data across the United States, using a color-coded map for clarity. Each state is marked to represent varying metrics like age, income, or product preference, facilitating easy visual comparisons and insights into market trends. Ideal for marketers, business analysts, and data scientists, this template simplifies complex demographic data for strategic presentations. It enhances understanding of customer bases and market segmentation. Compatible with PowerPoint, Keynote, and Google Slides, it's essential for detailed demographic analysis in any professional presentation.


6 slides
Future Trends in 5G Connectivity Presentation
Showcase the evolving landscape of mobile innovation with this modern 5G trends infographic. Featuring a central smartphone graphic and five vertically aligned icons, this slide is perfect for highlighting connectivity advancements, industry shifts, and upcoming opportunities. Color-coded markers enhance clarity for presentations on telecom, IoT, smart cities, and emerging tech. Fully editable in PowerPoint, Keynote, and Google Slides.


6 slides
Sales Process Infographic
The sales process refers to the step-by-step approach or series of activities that a salesperson or sales team follows to close a sale. This infographic template provides an informative overview of the sales process, guiding professionals through each stage and highlighting best practices for success. This template is designed to help you outlines the key stages involved in the sales process. This is a valuable resource for professionals seeking to enhance their understanding of the sales process and improve their performance. Compatible with Powerpoint, Keynote, and Google Slides.


6 slides
Best Solution Proposal Presentation
Present your ideas with clarity and confidence using this modern, structured layout that highlights problems, opportunities, and proposed solutions step by step. Ideal for showcasing strategies or business improvements, it keeps information organized and persuasive. Fully compatible with PowerPoint, Keynote, and Google Slides for effortless customization and presentation.


2 slides
App Design Mockup Presentation
Present your mobile app in style with the App Design Mockup slide. This sleek and modern template features a large smartphone frame to showcase your UI/UX designs with a creative touch. Ideal for app developers, designers, and pitch decks. Fully customizable and compatible with PowerPoint, Keynote, and Google Slides.


6 slides
Table of Content Layout Presentation
Kick off your presentation with a clean, modern layout that instantly guides your audience through each section with clarity and style. This design highlights key topics in a structured, easy-to-follow sequence, making navigation simple and intuitive. Fully compatible with PowerPoint, Keynote, and Google Slides for seamless use.


10 slides
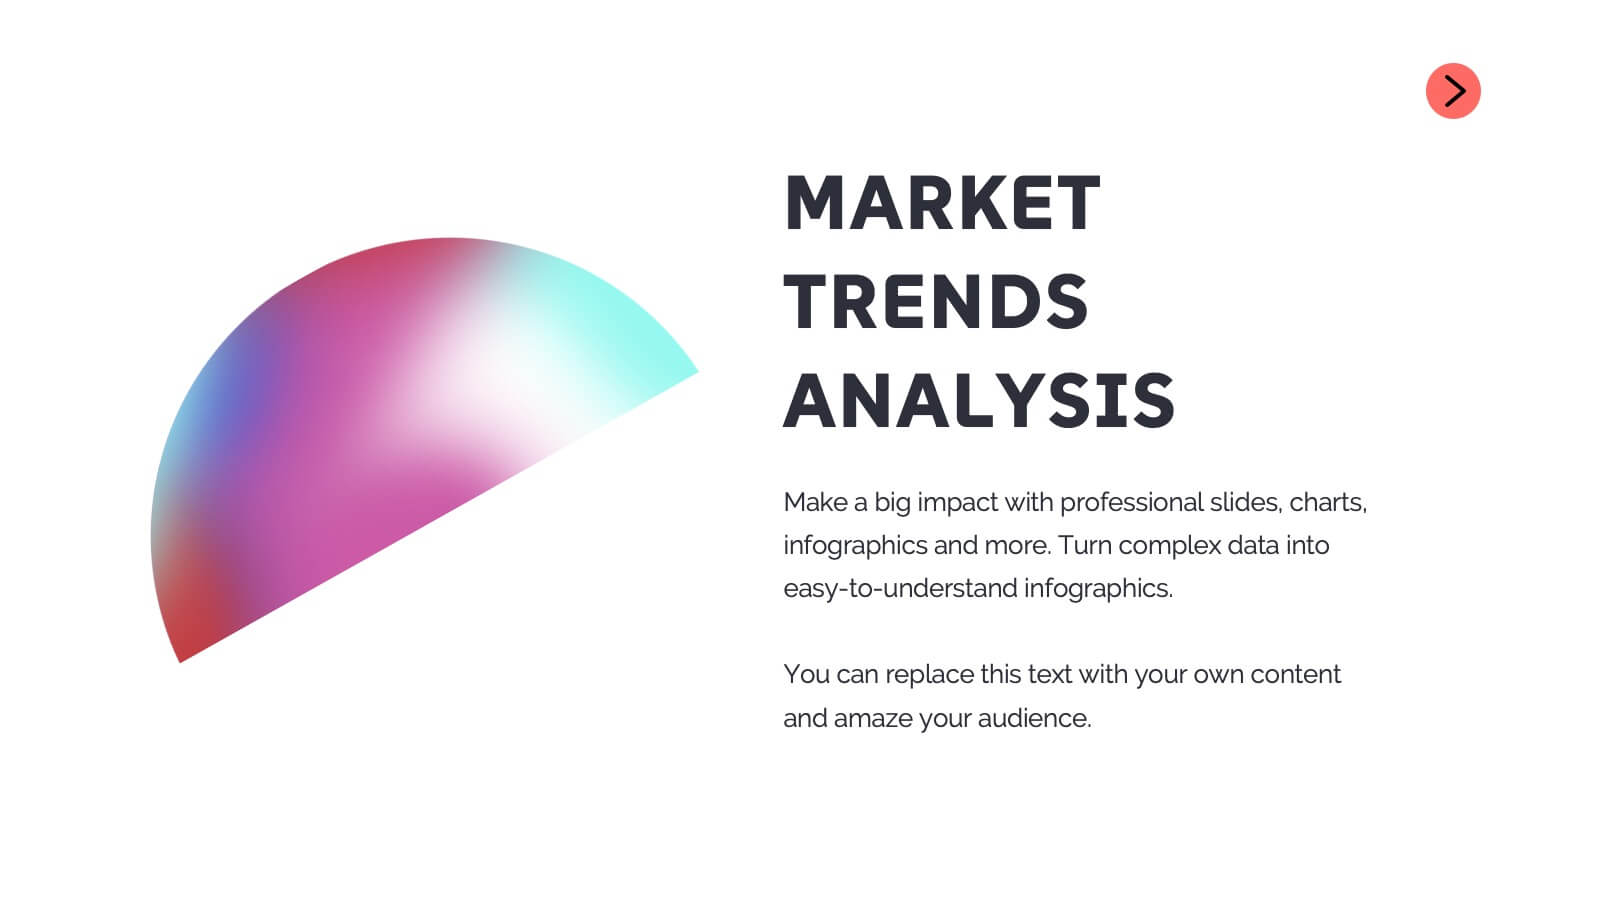
Real Estate Market Trends Presentation
Stay ahead of Real Estate Market Trends with this data-driven presentation template. Designed for agents, investors, and analysts, this template visually highlights housing trends, market insights, and investment opportunities with engaging layouts. Fully customizable and available for PowerPoint, Keynote, and Google Slides, ensuring a professional and compelling presentation.


6 slides
Organizational Strategy via Mind Mapping
Clarify your corporate vision with the Organizational Strategy via Mind Mapping Presentation. This infographic-style slide uses a head silhouette and segmented arc to represent five strategic focus areas (A–E), making it perfect for showcasing alignment across departments, initiatives, or leadership goals. Fully customizable in PowerPoint, Keynote, and Google Slides for versatile strategic presentations.


20 slides
Crescendo Creative Design Report Presentation
Transform your creative design report into a captivating presentation with a dynamic and professional template. This versatile format is tailored for designers, agencies, and creatives who want to showcase their design process, strategic approach, and project outcomes effectively. From design briefs and target audience insights to mood boards and prototypes, every slide is crafted to enhance clarity and visual appeal. Highlight unique elements, design systems, and implementation strategies with organized layouts that leave a lasting impression. Use the project timeline and feedback sections to narrate your journey and collaboration efforts seamlessly. Compatible with PowerPoint, Google Slides, and Keynote, this fully editable template adapts to your brand's needs. Engage stakeholders and clients with a polished, modern design that reflects your creative excellence.


7 slides
Decision Tree Diagram Infographics
A Decision Tree Diagram is a visual representation of a decision-making process that uses a tree-like structure to map out various possible outcomes and their associated probabilities. This template can be used in fields such as business, economics, and data science to model complex decision-making scenarios. This infographic starts with a single node, representing the initial decision that needs to be taken. From this node, paths extend to other nodes representing possible outcomes that could occur as a result of the initial decision. The final nodes of the diagram represent the end results.


26 slides
Flower Shop and Blossoms Presentation
A flower shop, also known as a floral boutique, is a retail establishment that sells fresh flowers, floral arrangements, and related products. This presentation template has a charming design that celebrates the beauty and elegance of flowers. This template is perfect for florists, flower shops, garden enthusiasts, or anyone looking to create a captivating presentation about flowers, floral arrangements, or the art of floristry. The presentation features visually stunning floral icons with colorful and artistic arrangements, creating a delightful and inviting atmosphere. This template is fully customizable and compatible with Powerpoint, Keynote, and Google Slides.