


Features
- 4 Unique slides
- Fully editable and easy to edit in Microsoft Powerpoint, Keynote and Google Slides
- 16:9 widescreen layout
- Clean and professional designs
- Export to JPG, PDF or send by email


Do you have any questions?
Recommend


6 slides
Data Analysis Methods Infographics
This Data Analysis Methods Infographic is an excellent tool for professionals and students alike to present statistical findings and patterns. Designed for seamless integration with PowerPoint, Google Slides, and Keynote. The infographics are ideal for illustrating trends, and summarizing large amounts of data in an easily digestible format. With a variety of chart styles, including bar graphs, line charts, and icon arrays, the template allows for versatile data representation. Make your data speak volumes with this crisp and informative infographic, ensuring your audience grasps the insights at a glance. Perfect for market research, academic research, and business performance presentations.


26 slides
Azahar Presentation Template
Azahar is a perfect modern template with a clean and professional feel. This theme can help your business connect with clients through an easy to understand template. Azahar was designed by professionals to help businesses connect with their audience. It has a modern, chic aesthetic and very detailed look. The colors are fresh which help keep the look clean and easy to read. The theme comes packed with features to target your audience and get your message across. Charts, timelines and easy to edit text, this template is perfect for businesses seeking to make an impression on their audience.


26 slides
Premium Finance for Daily Life Presentation
Introducing our Premium Finance for Daily Life Presentation template this is a comprehensive and informative tool to educate individuals about the concept of premium finance and its relevance in everyday life. This presentation aims to provide valuable insights on how premium finance can be utilized to manage and optimize personal finances. The slides are fully customizable and compatible with PowerPoint, Keynote, and Google Slides. It features a professional design with clean layouts, visually appealing graphics, and icons related to finance and daily life activities. The presentation can cover various topics related to premium finance.


4 slides
IT Infrastructure Overview Presentation
Map out your digital ecosystem with this IT Infrastructure Overview Presentation. Featuring a cloud-based diagram with interconnected folders and icons, this slide helps communicate key components of your organization’s infrastructure—from servers and databases to networks and cloud solutions. Great for explaining system architecture or IT service flows. Fully customizable in PowerPoint, Keynote, and Google Slides.


4 slides
Strategic Triangle Model Slide
Visualize your core pillars with this Strategic Triangle Model Slide Presentation. Featuring a clean triangular layout with three editable segments, this template is perfect for showcasing frameworks such as mission-vision-values, policy-strategy-impact, or key business objectives. Each point of the triangle is paired with an icon and customizable text, making complex concepts easy to digest. Ideal for strategy planning, leadership discussions, or consulting proposals. Fully editable in PowerPoint, Google Slides, and Keynote.


6 slides
5-Stage Workflow Presentation
Turn complex processes into clear, visual stories with this structured step-by-step layout. Ideal for showcasing project stages, workflows, or development phases, it guides your audience through each milestone with precision and flow. Fully editable and compatible with PowerPoint, Keynote, and Google Slides for easy customization and professional results.

23 slides
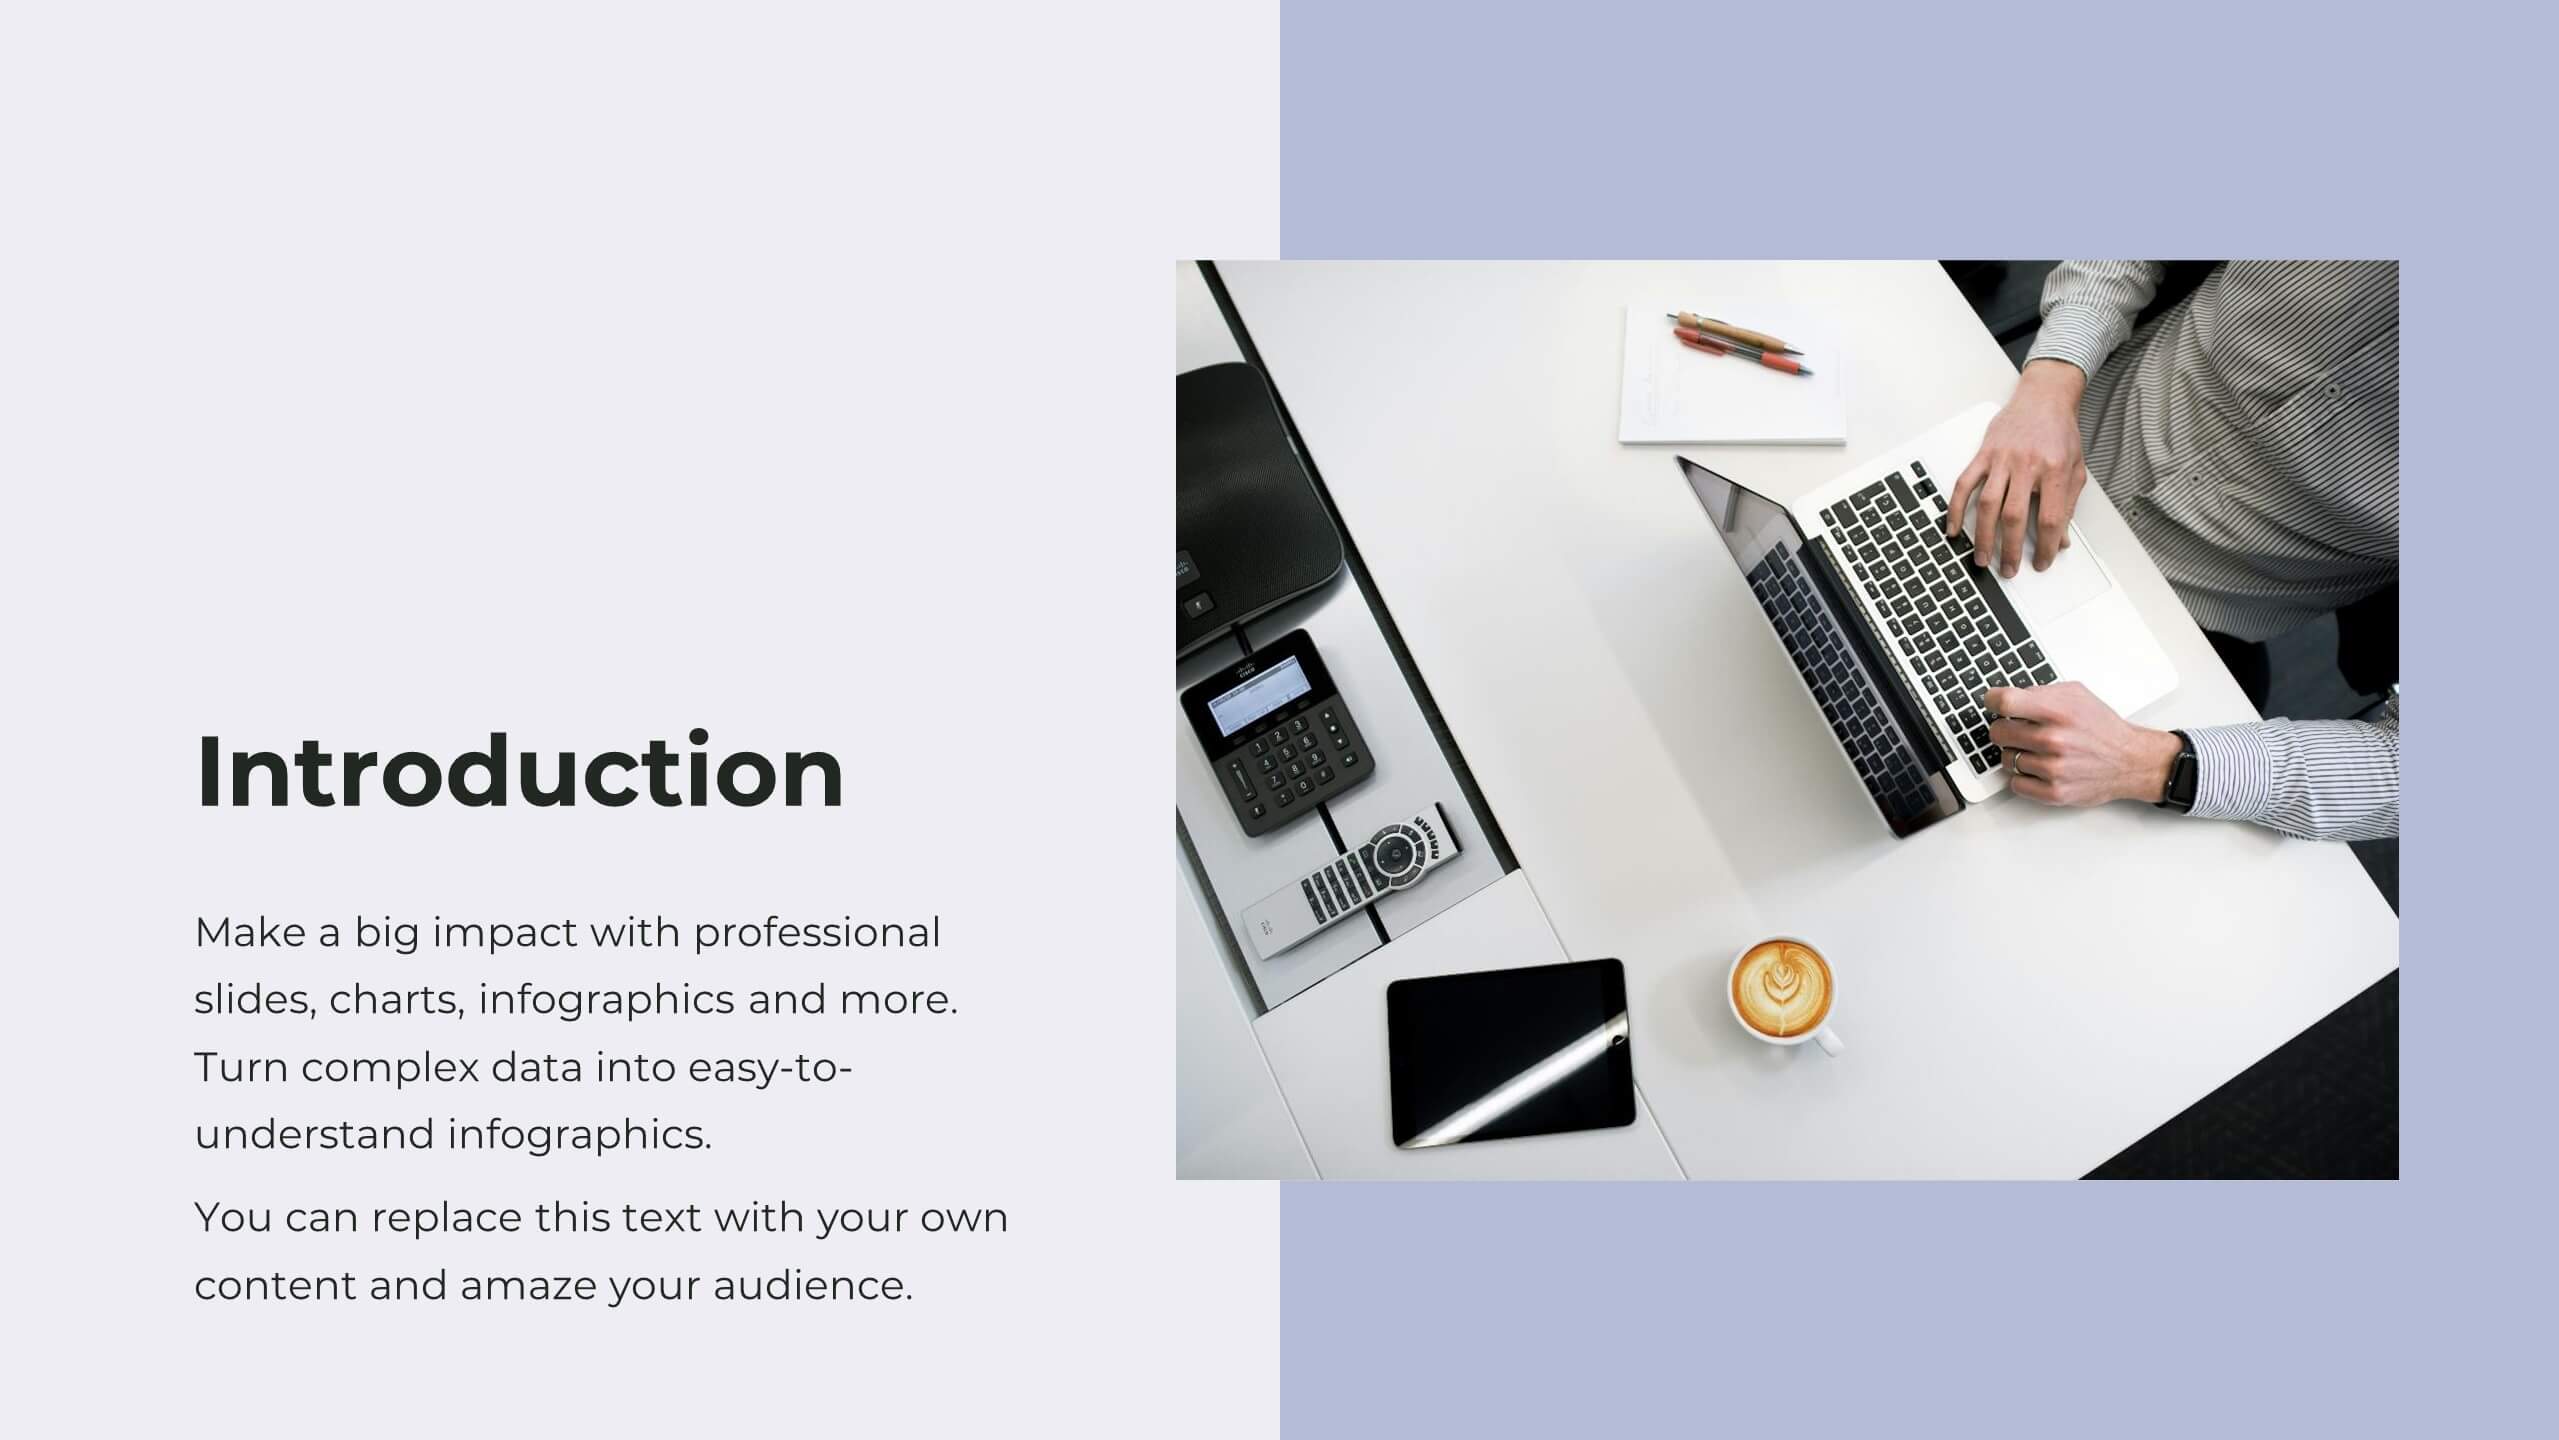
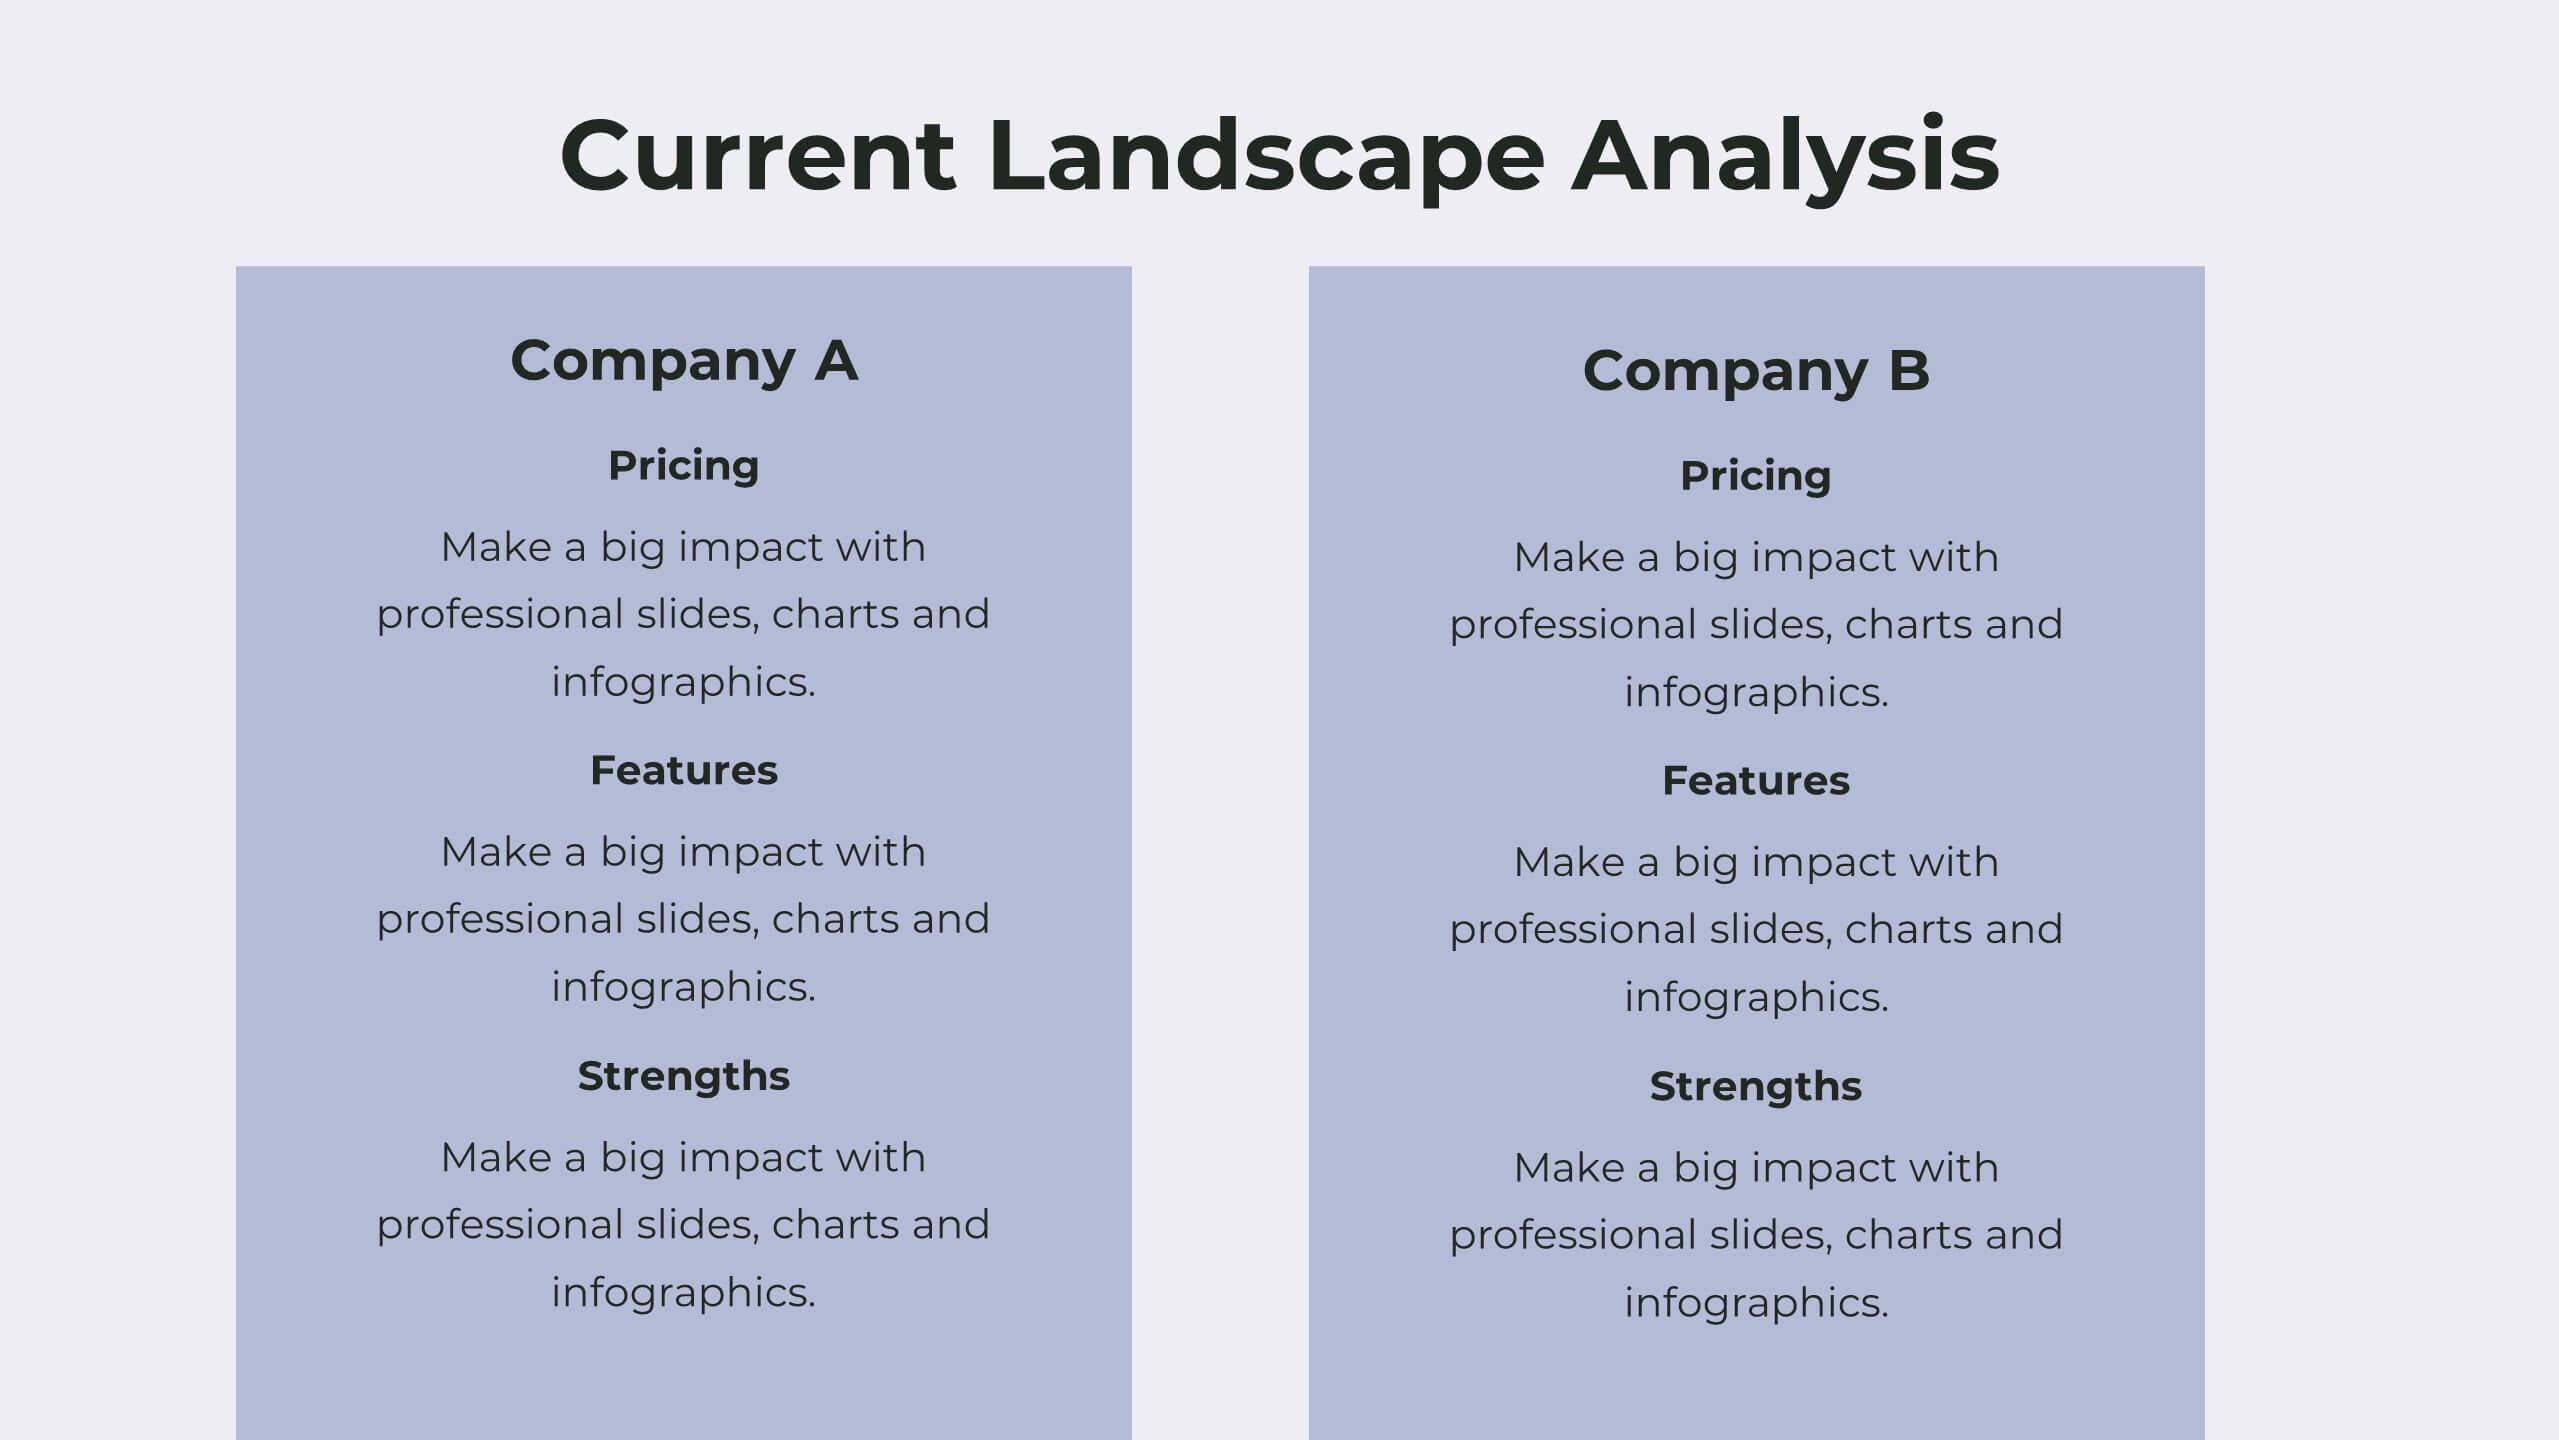
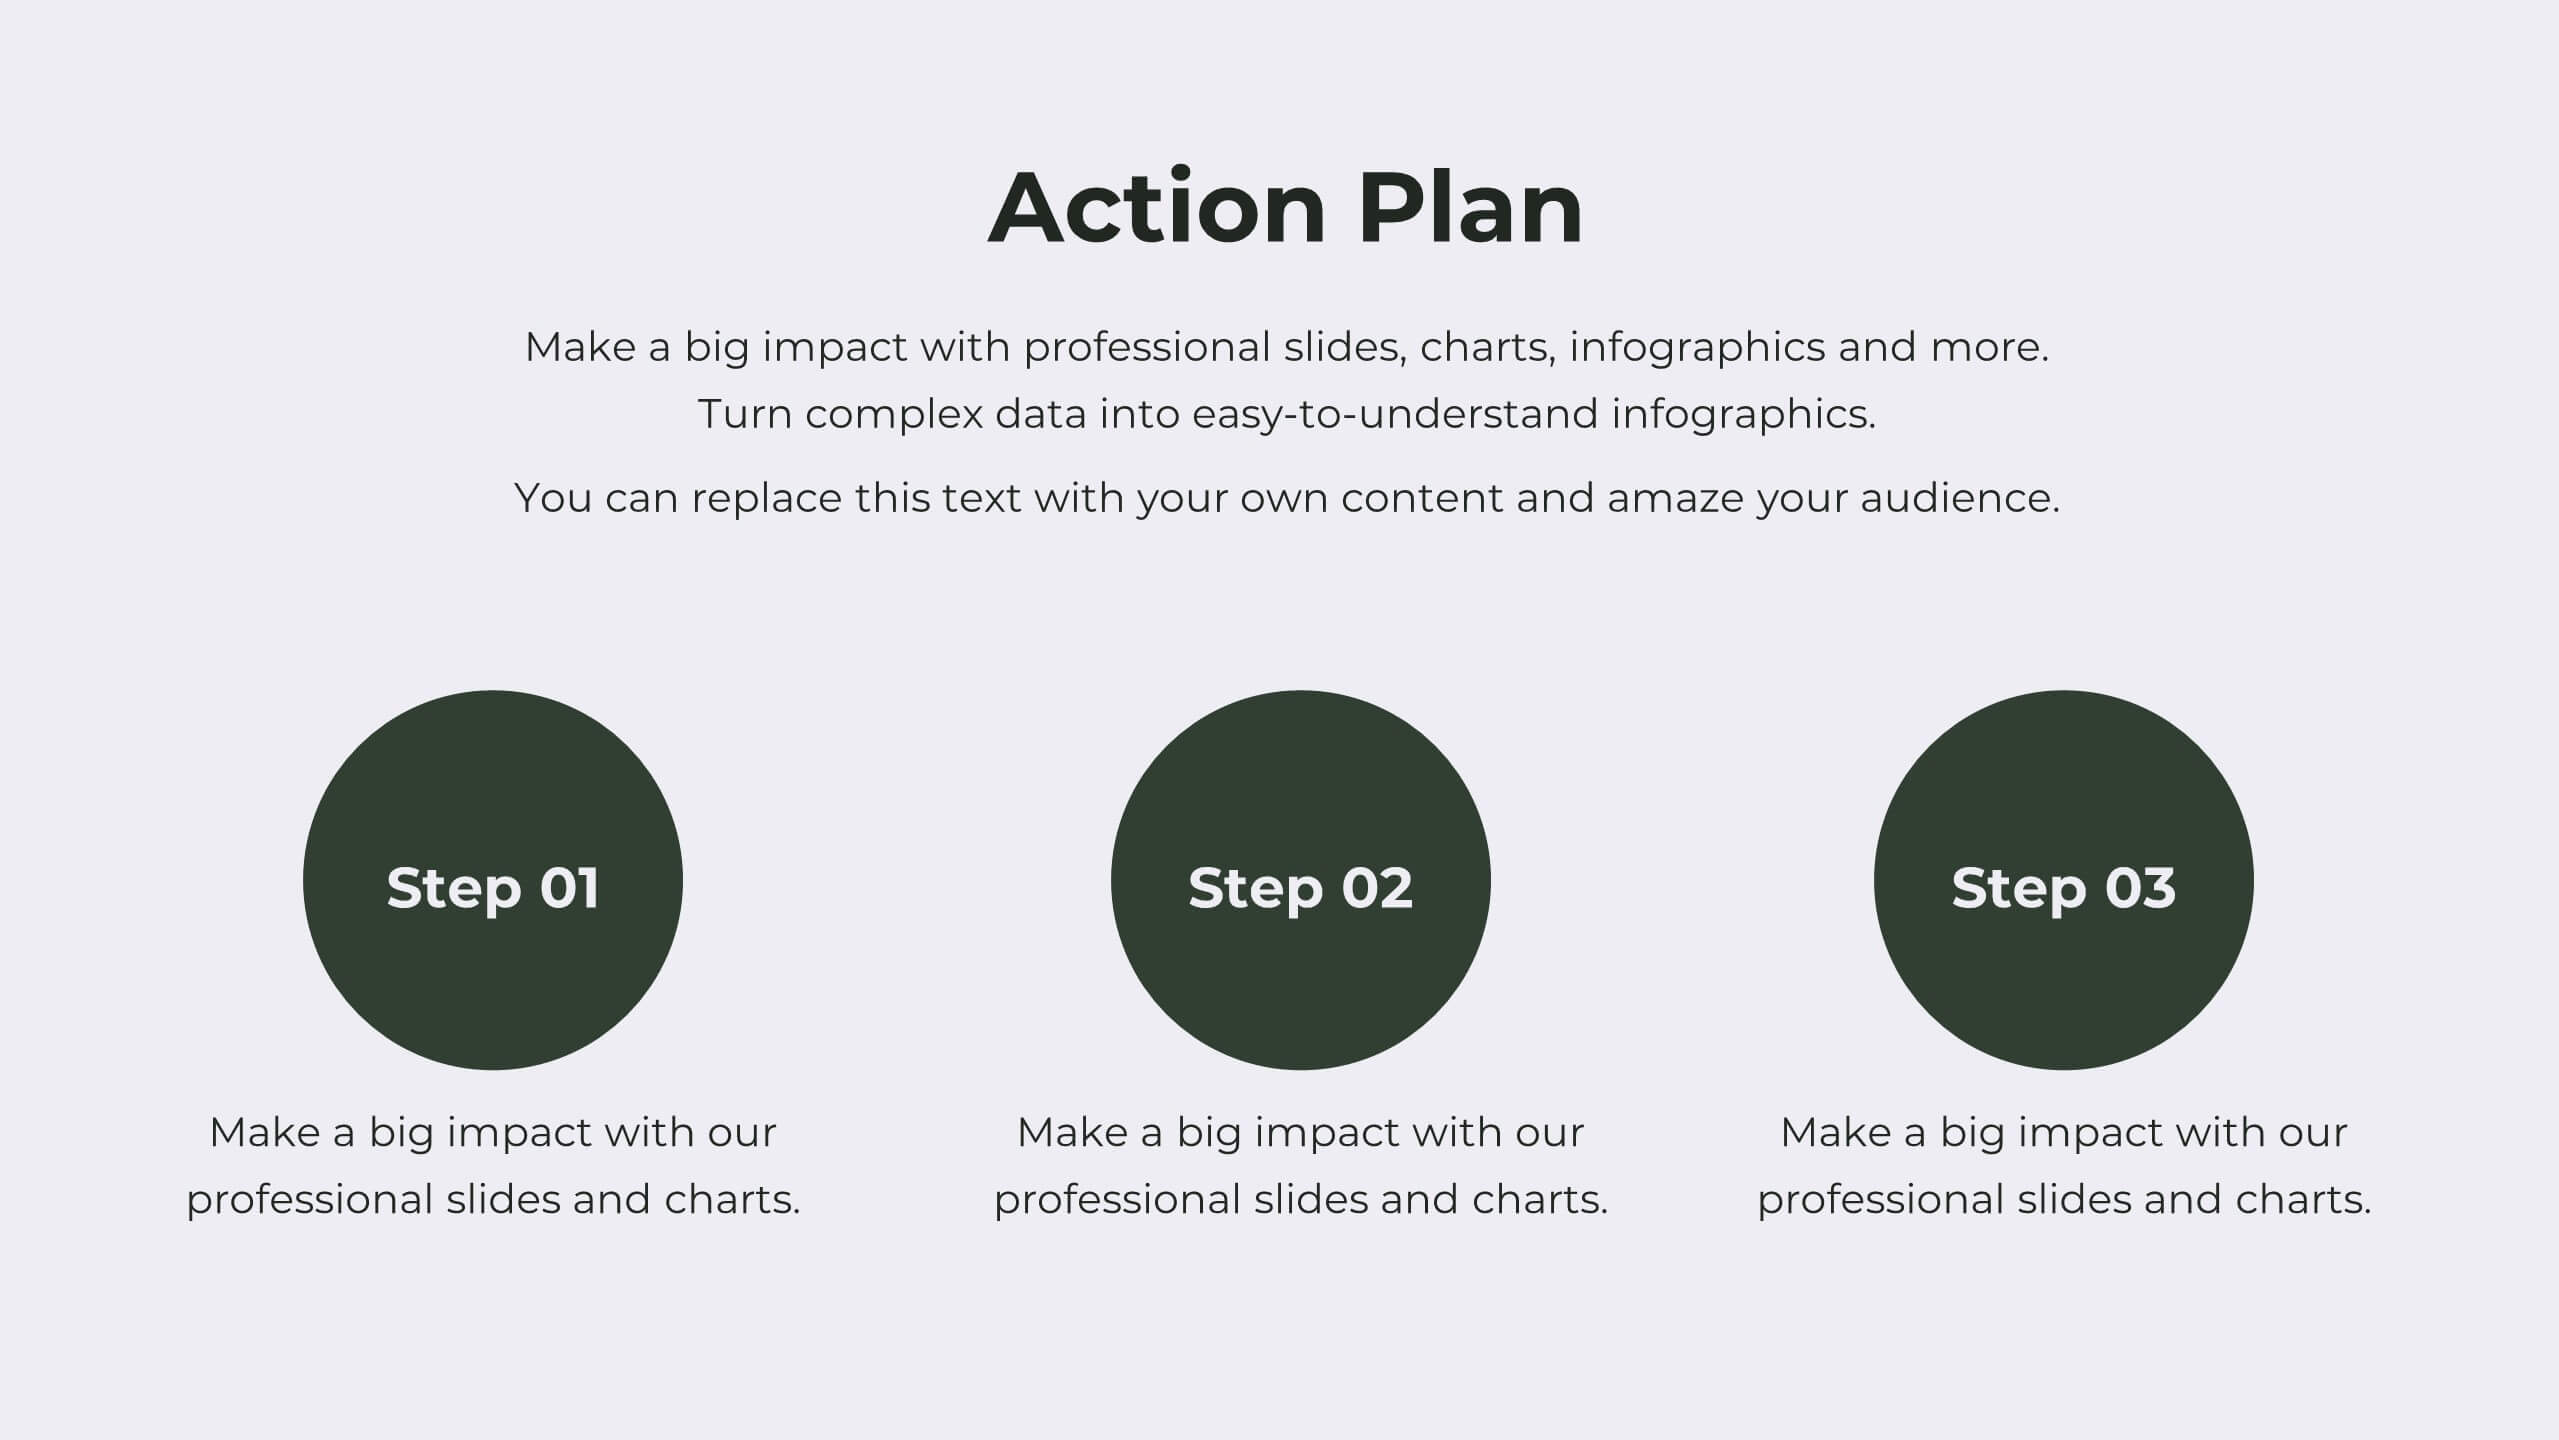
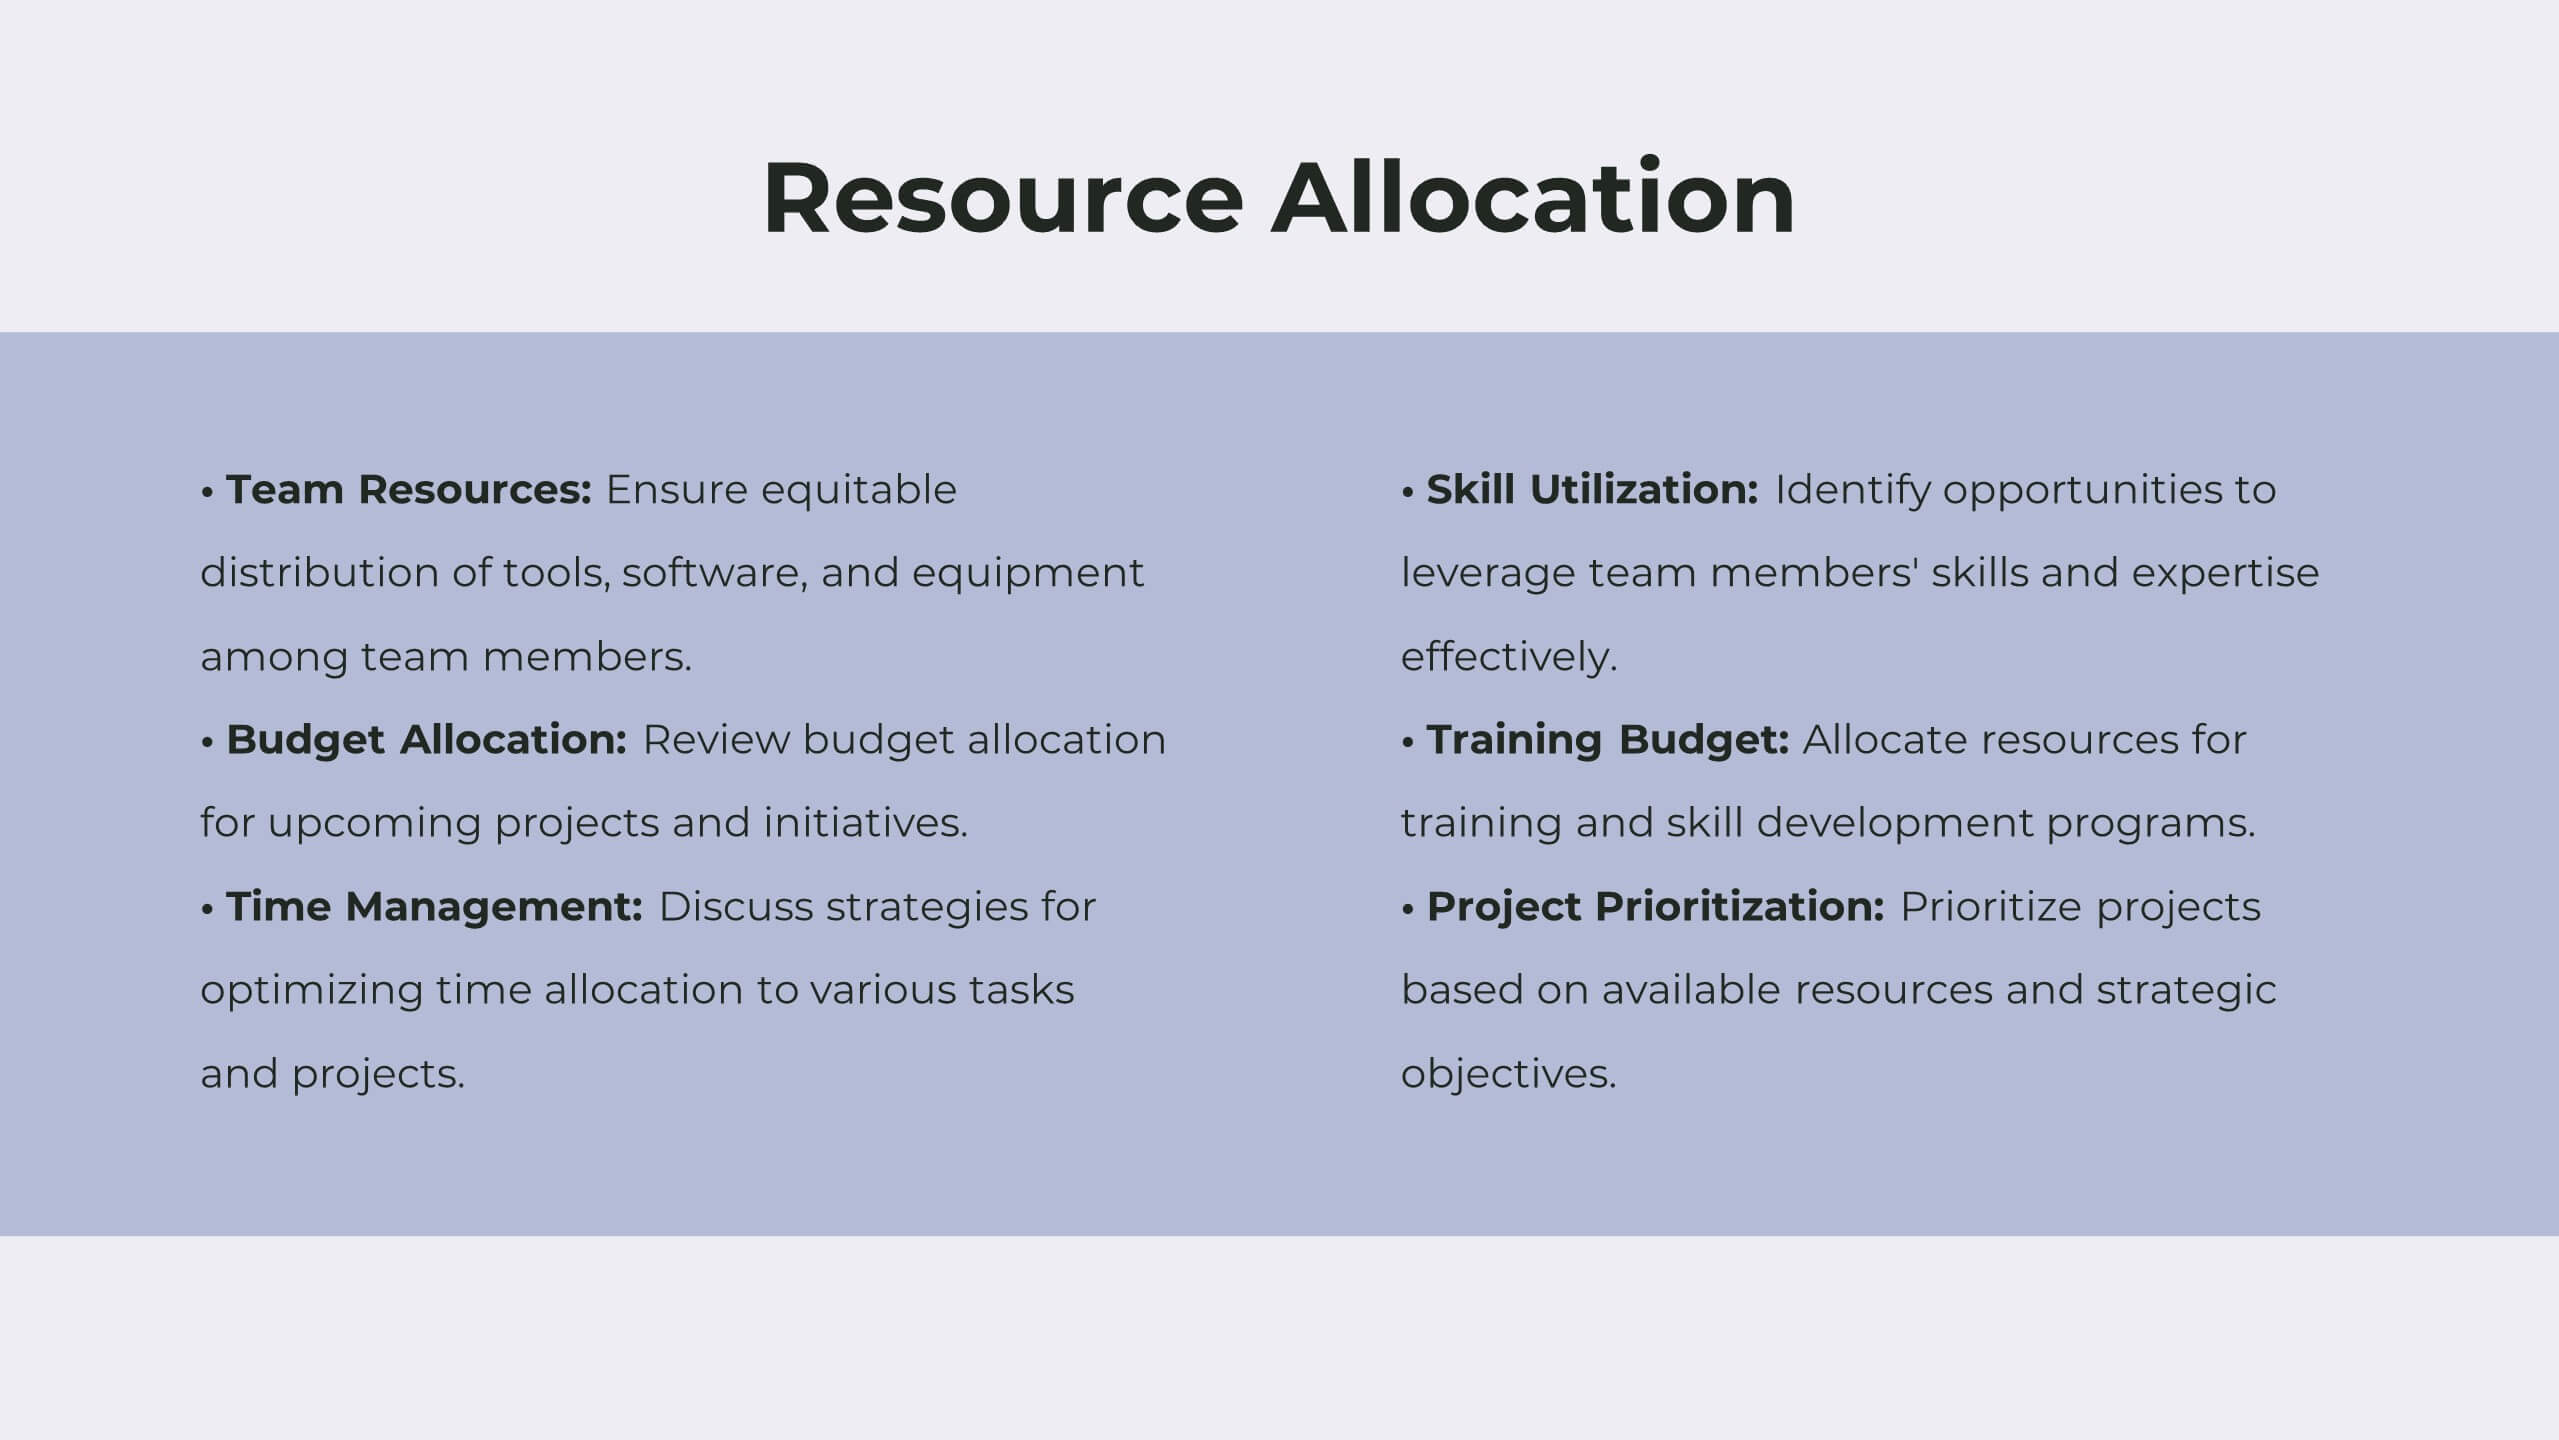
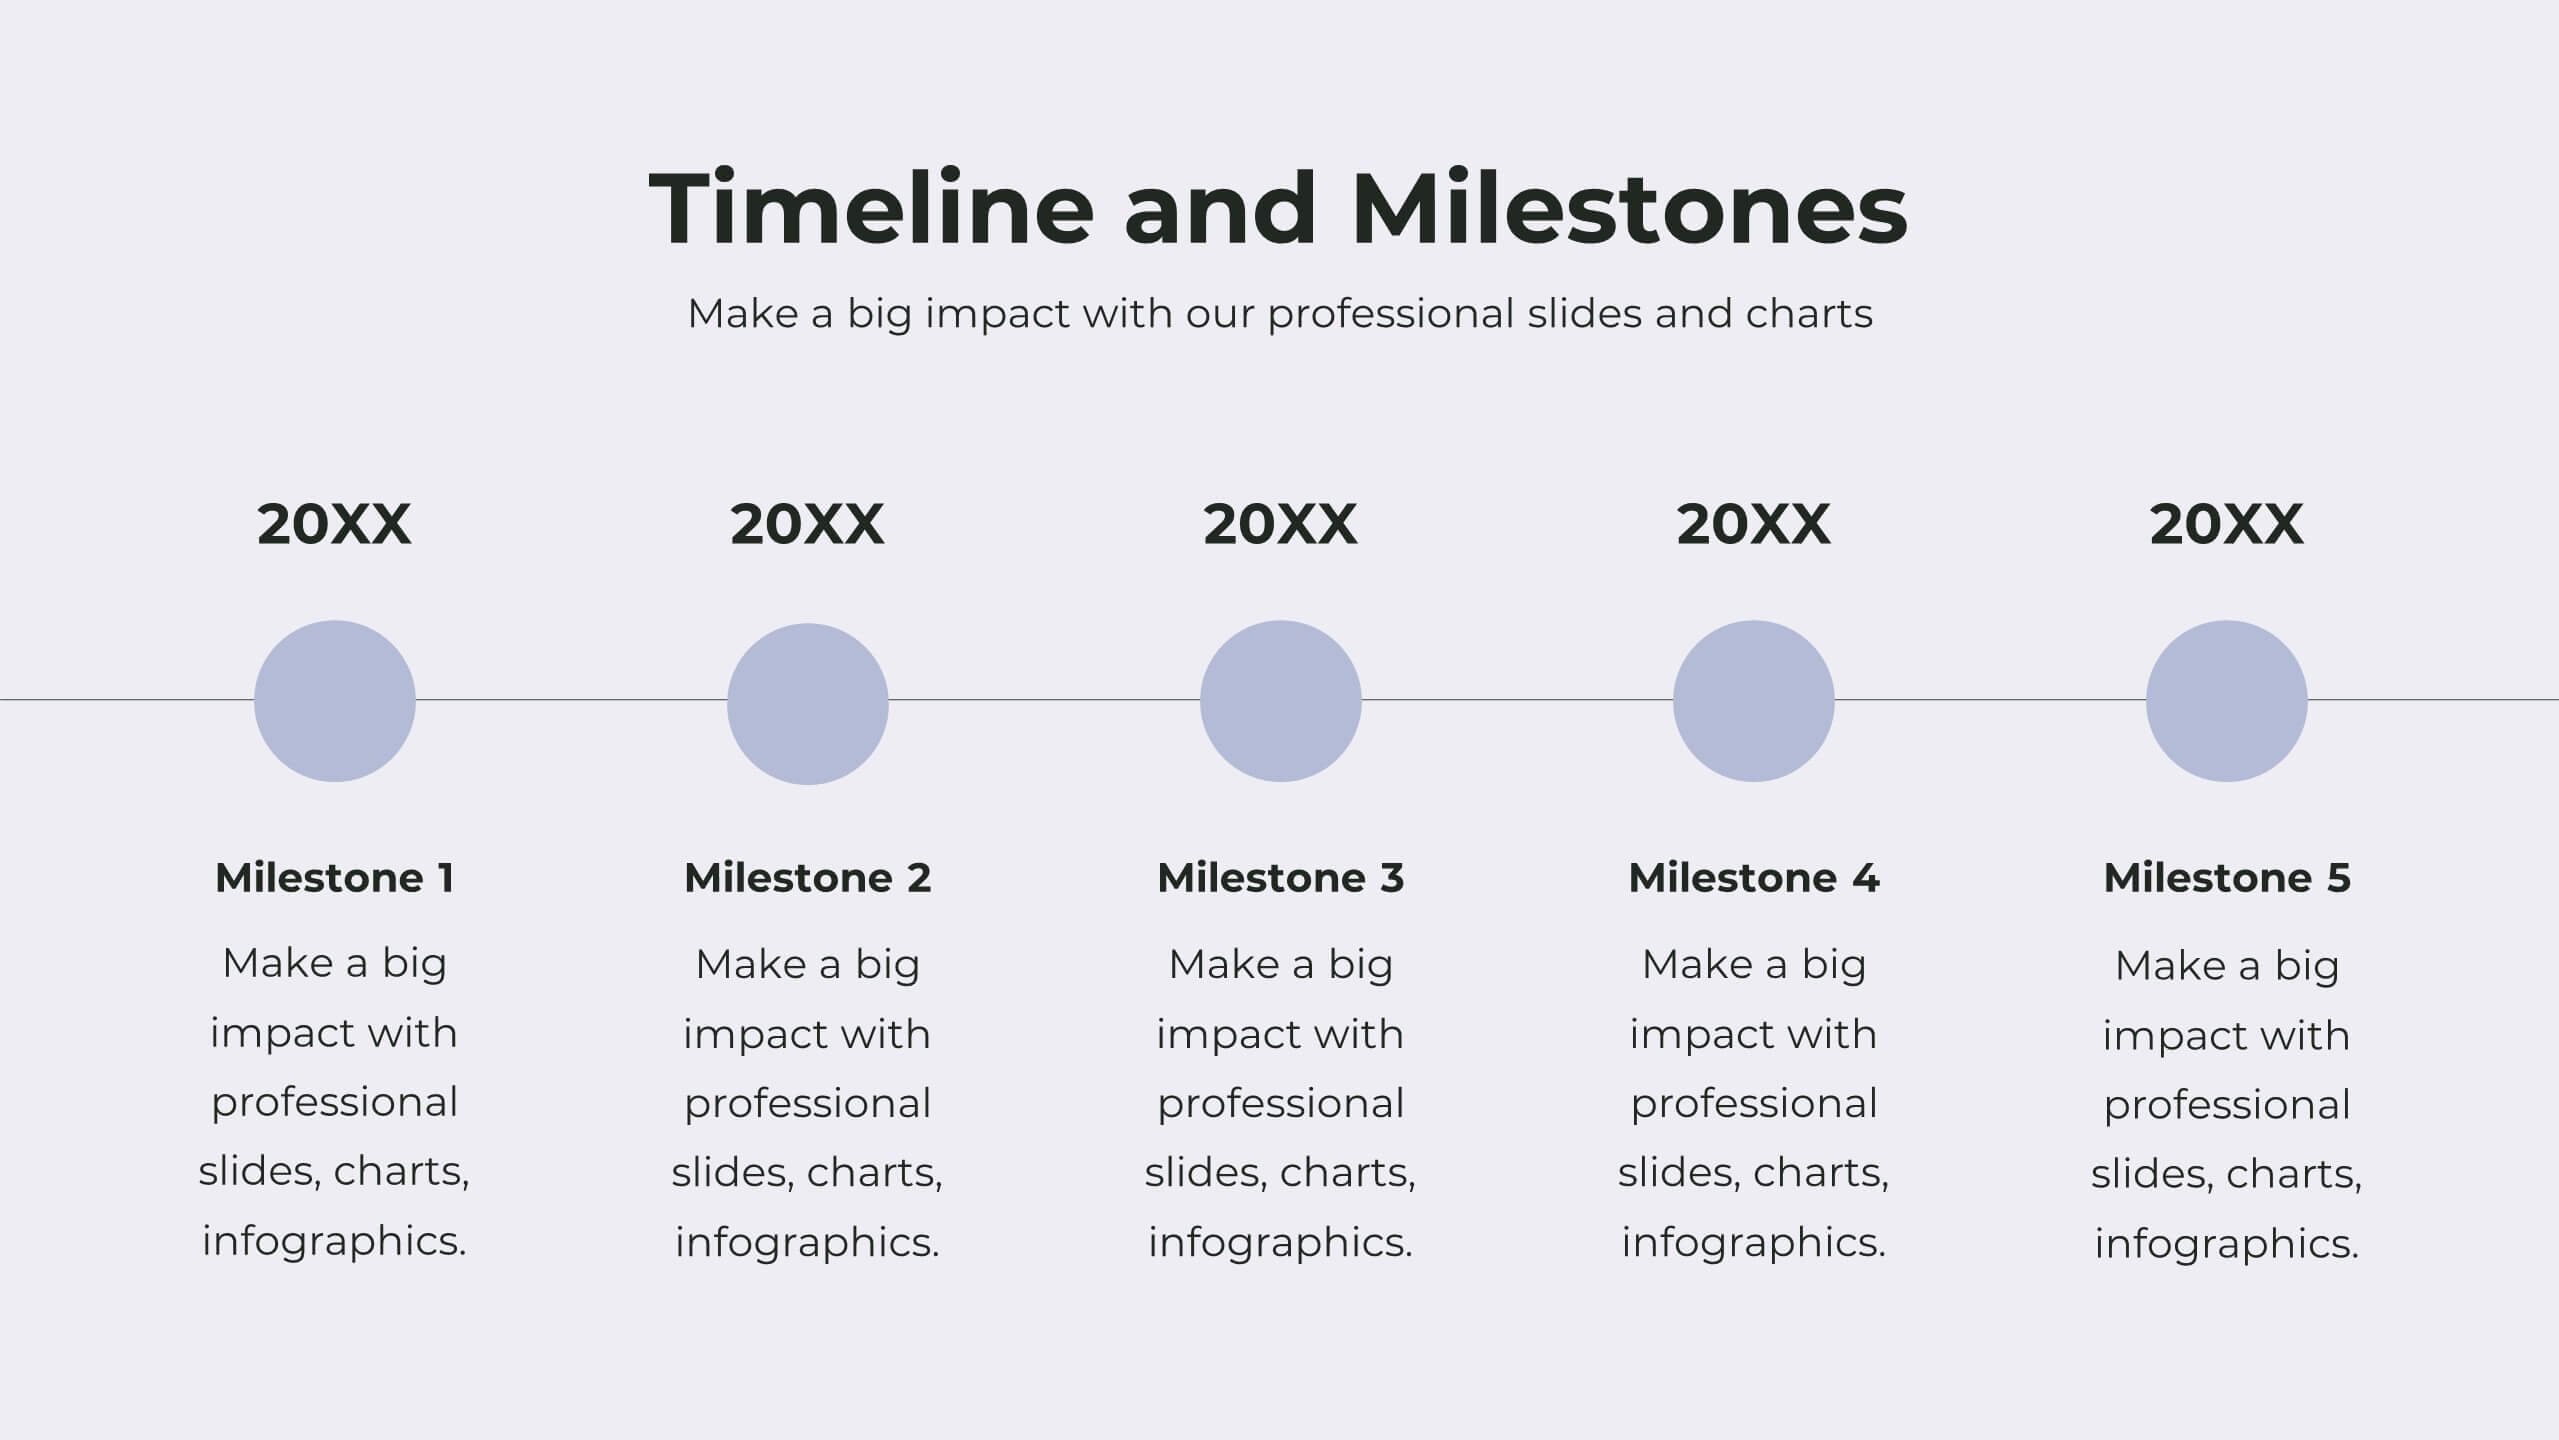
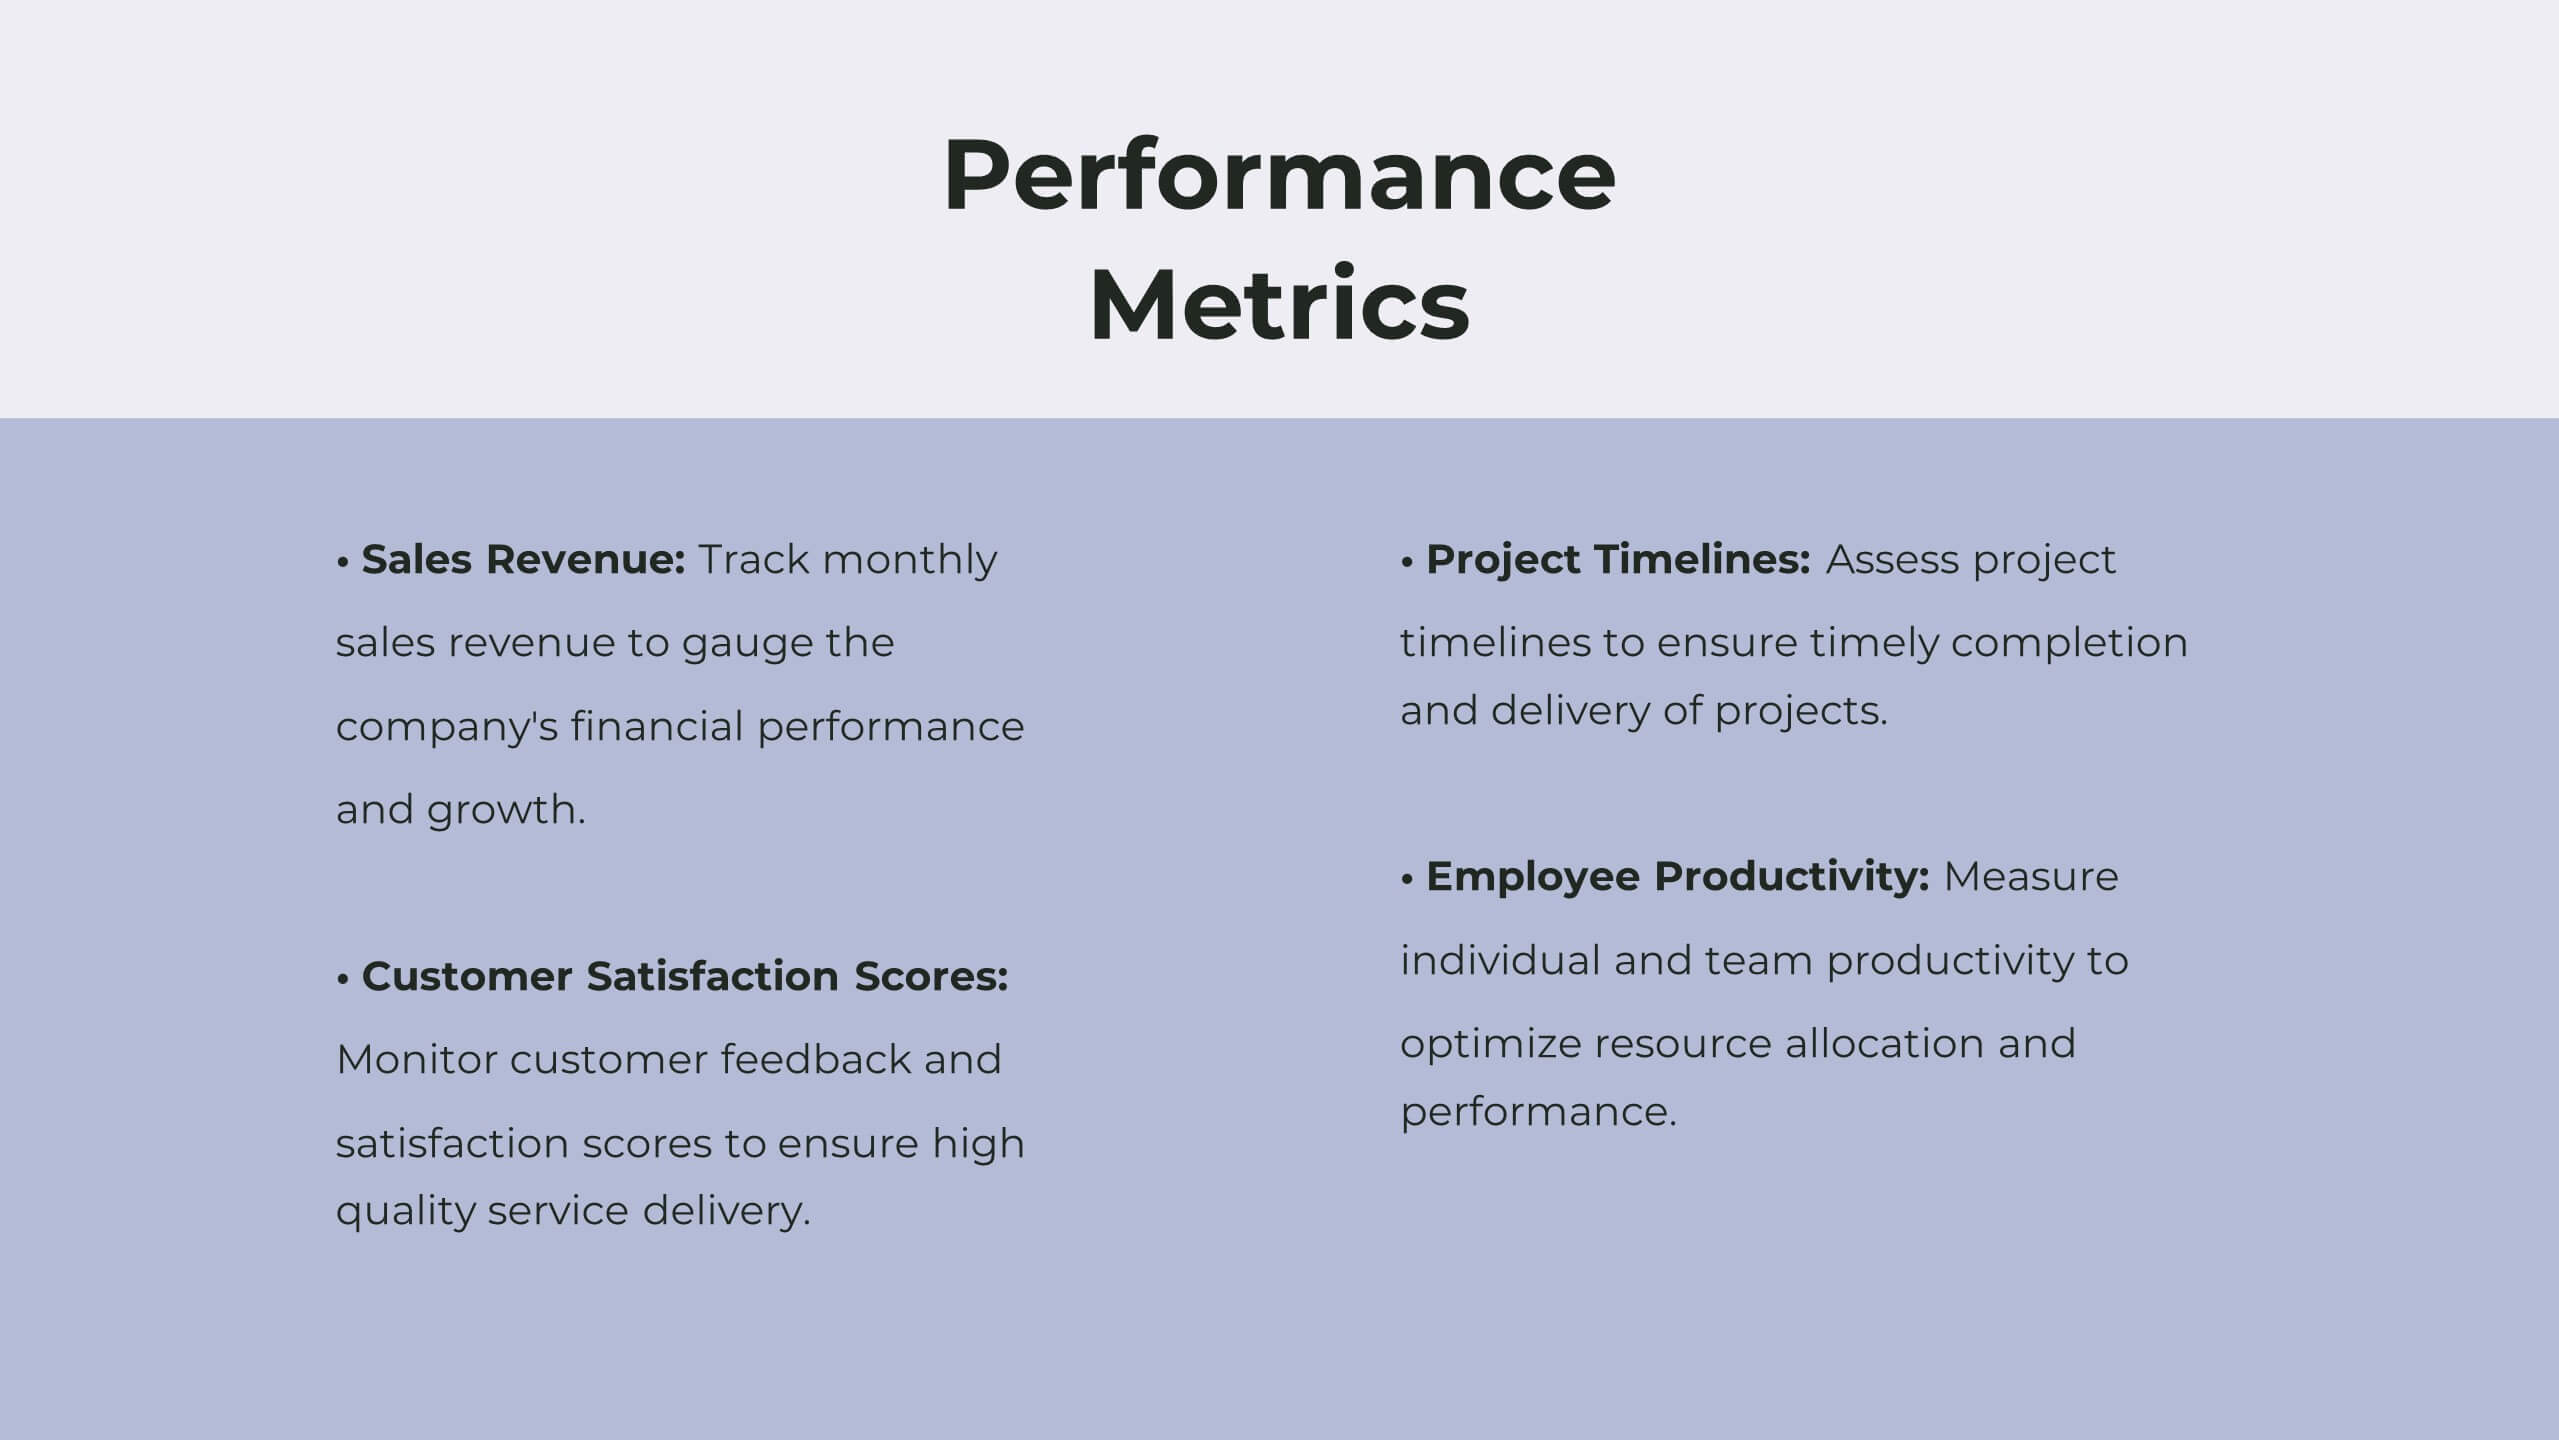
Tranquil Corporate Strategy Proposal Presentation
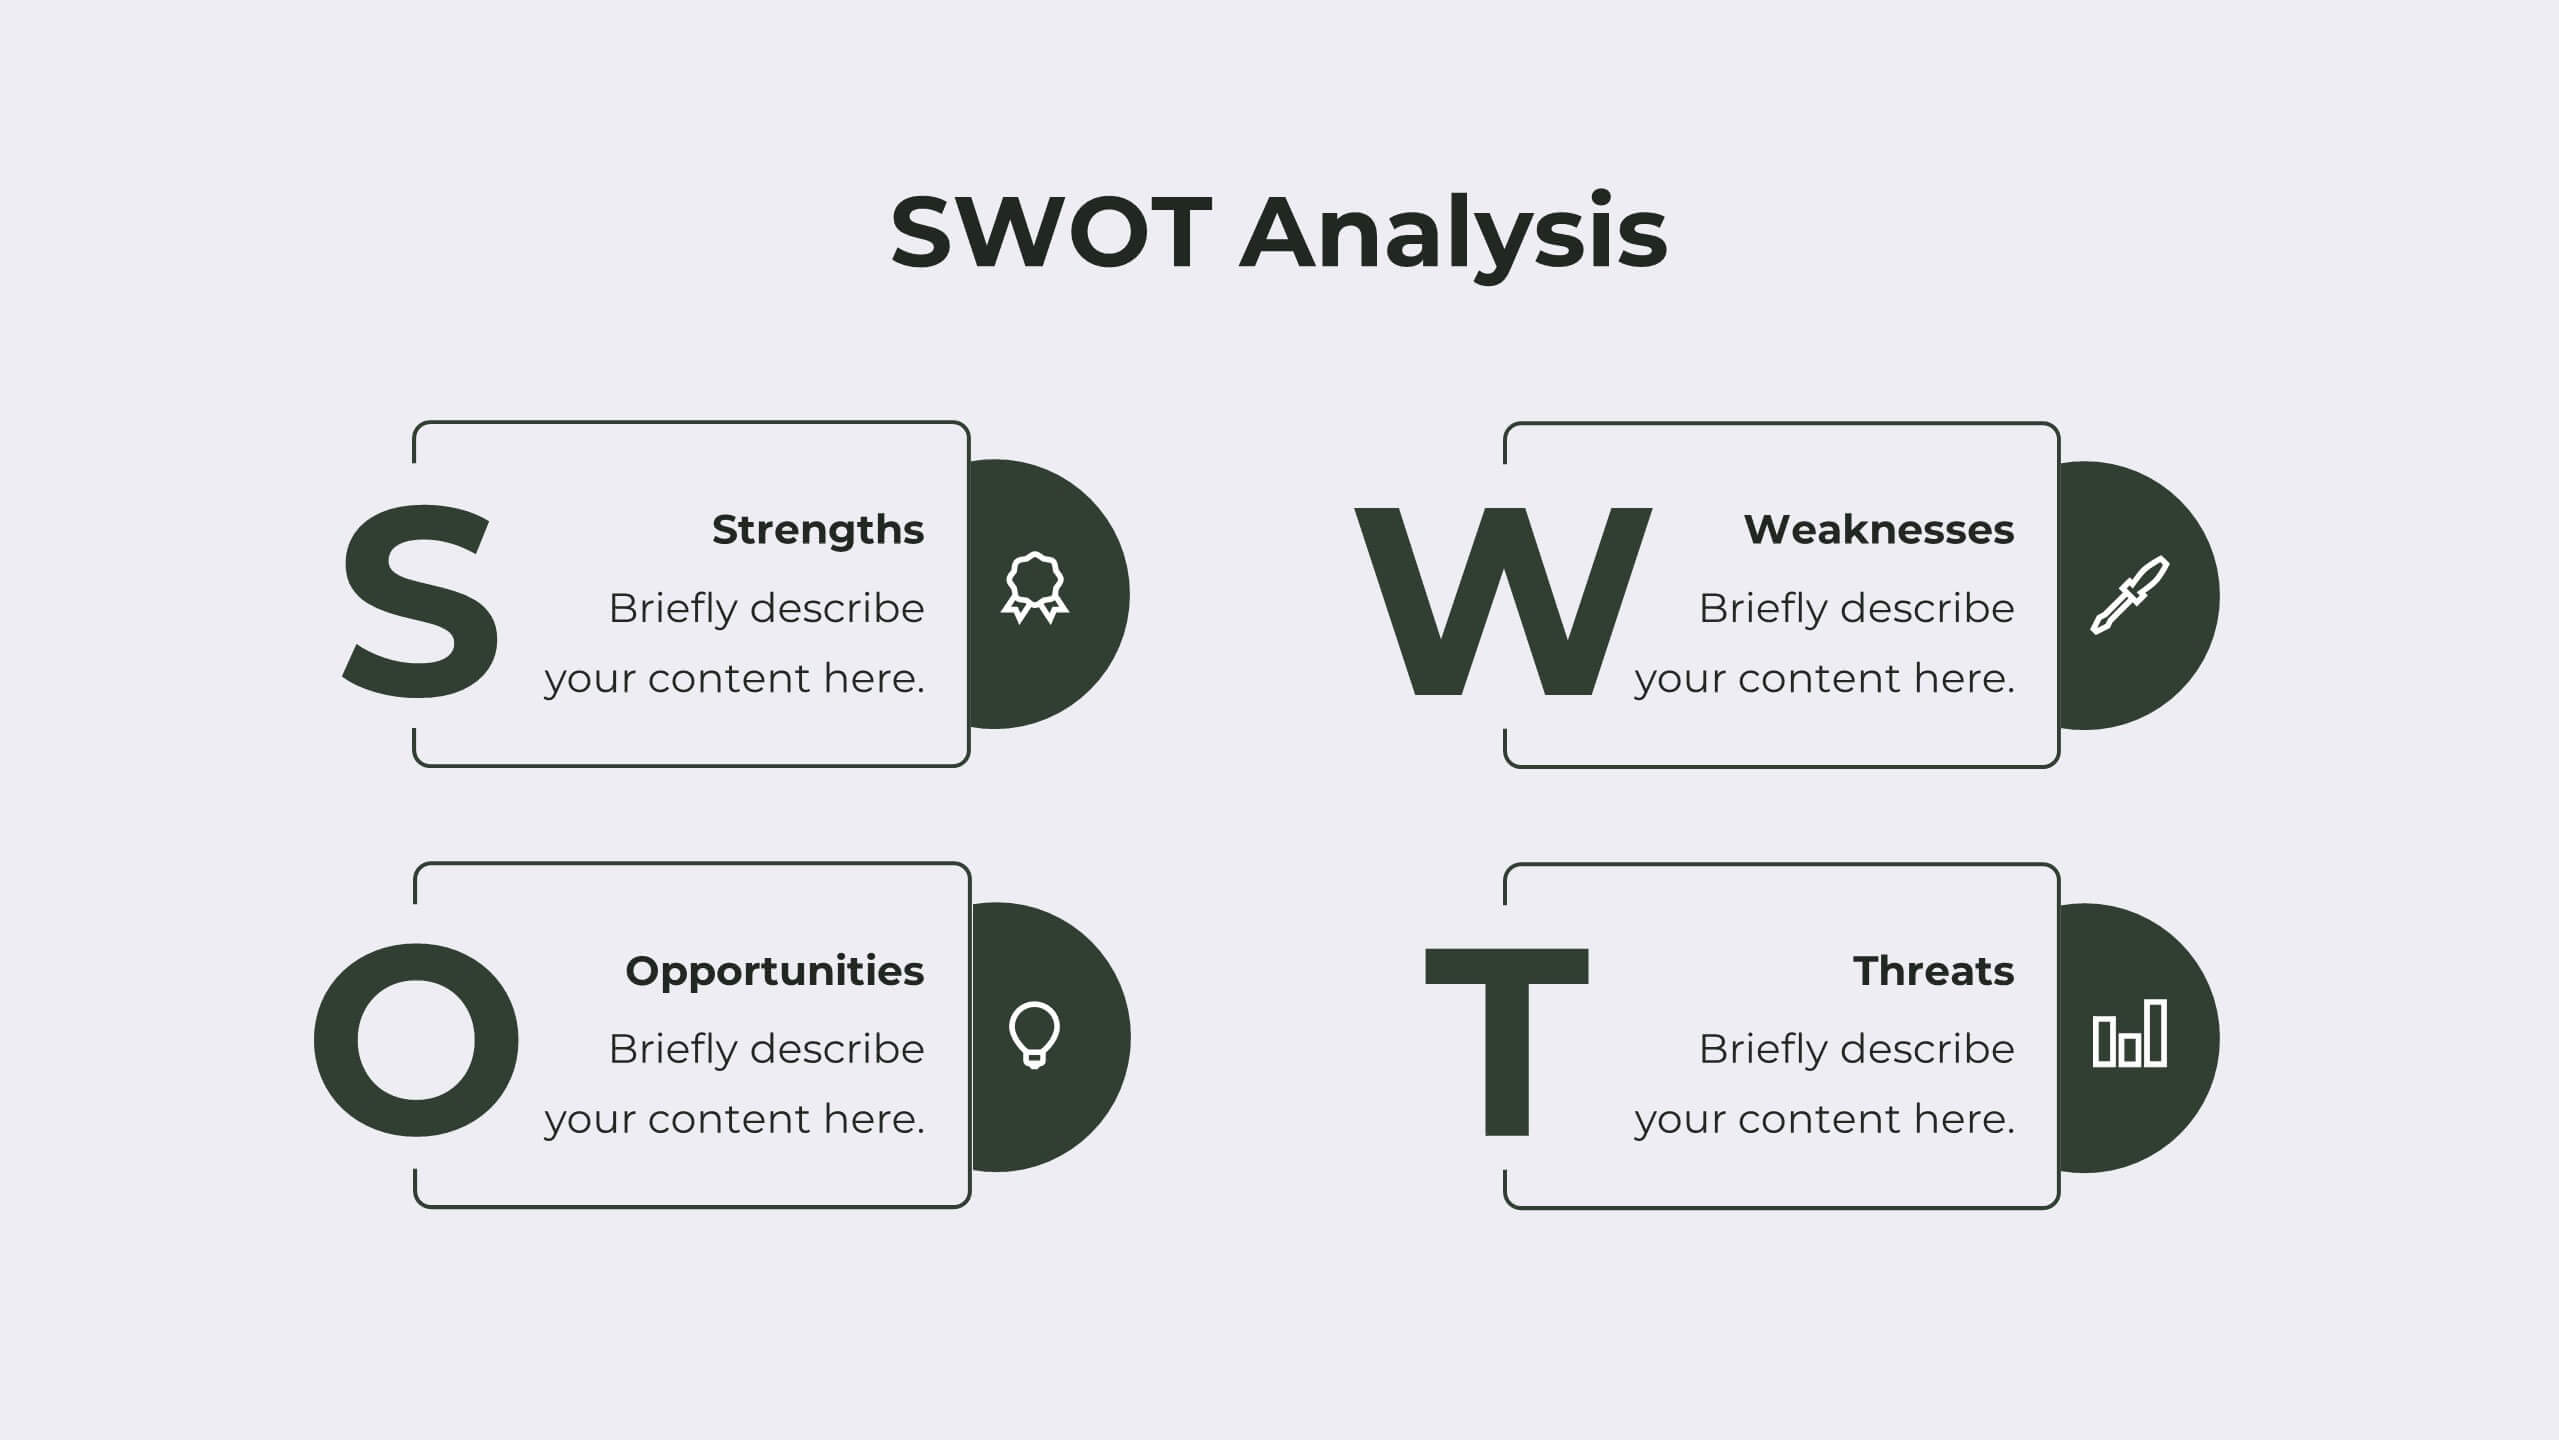
Drive your business forward with this elegant corporate strategy proposal template! Ideal for outlining strategic objectives, competitive analysis, and growth opportunities, it includes slides for SWOT analysis, resource allocation, and performance metrics. Impress stakeholders with clear visuals and structured content. Compatible with PowerPoint, Keynote, and Google Slides for seamless presentations on any platform.
4 slides
Growth Path Arrow Design Presentation
Rise with momentum as you visualize progress in a clean, modern layout built for showcasing goals, achievements, and forward movement. This presentation highlights each stage in a clear upward path, helping audiences follow your narrative with ease. Fully editable and compatible with PowerPoint, Keynote, and Google Slides.


6 slides
Europe Region Overview Presentation
Bring your regional insights to life with a modern, minimal map layout that highlights key countries and data across Europe. Ideal for showcasing economic trends, business performance, or demographic overviews, this clean design ensures clarity and engagement. Fully compatible with PowerPoint, Keynote, and Google Slides for seamless editing.


4 slides
Financial Report Presentation
Enhance your financial presentations with our "Financial Report Presentation" template. Designed for clarity and visual impact, this infographic features a stylized financial bag icon segmented into color-coded sections, each representing a different financial metric such as revenue, expenses, profits, and investments. This creative visual structure allows for a clear and segmented display of your company's financial health, making complex data easily understandable. Ideal for financial analysts, corporate presentations, and investor meetings, this template ensures key financial insights are communicated effectively and efficiently. Compatible with PowerPoint, Keynote, and Google Slides, it's an essential tool for delivering detailed and precise financial reports.


4 slides
Blue Ocean Innovation Approach Presentation
The Blue Ocean Innovation Approach Presentation offers a clear and modern layout for visualizing strategic innovation. Featuring layered diamond shapes representing Cost, Value Innovation, and Buyer Value, this slide helps explain how businesses can move beyond competition by creating new market spaces. Each section includes editable titles and text boxes, ideal for outlining strategies, key concepts, or benefits. Designed for consultants, strategists, and business leaders, the template is fully customizable in PowerPoint, Keynote, and Google Slides. Perfect for presenting blue ocean thinking in a polished, professional format.


21 slides
Illusion Marketing Research Report Presentation
Energize your marketing presentations with this bold, modern template. Perfect for showcasing company stories, market research, and competitive landscapes, it features a vibrant design and clear layout. Highlight key insights and strategies with ease, ensuring your marketing plan stands out. Compatible with PowerPoint, Keynote, and Google Slides, it’s ideal for any platform.


5 slides
Level-Based Authority Chart Presentation
Display organizational hierarchy with clarity using this level-based authority chart. The pyramid layout highlights reporting tiers, perfect for showcasing leadership roles, department levels, or team structures. Fully customizable in Canva, PowerPoint, or Google Slides—ideal for managers, HR professionals, and business consultants looking to present structured authority in a clean format.


5 slides
Training and Development Onboarding
Streamline your employee learning journey with the Training and Development Onboarding Presentation. This modern, five-step roadmap uses a wave-style flow from A to E, allowing you to break down each stage of training with matching step labels and title placeholders. Ideal for HR professionals, team leaders, and onboarding managers, it’s perfect for introducing structured learning, role-specific training, or compliance modules. Compatible with PowerPoint, Keynote, and Google Slides, and fully editable to match your brand style.


2 slides
Final Gratitude Page in Deck Presentation
The Final Gratitude Page in Deck Presentation is a bold and engaging closing slide, ideal for ending your presentation with personality and professionalism. With its bright orange theme, modern photo frame, and "THANK YOU!" message in clear typography, it leaves a lasting impression on your audience. Perfect for webinars, educational talks, or business presentations. Fully customizable in PowerPoint, Keynote, and Google Slides.


6 slides
Process Cycle Wheel Slide Presentation
Give your workflow a visual rhythm with this clean, circular layout designed to highlight every stage of a process with clarity and style. Perfect for showcasing cycles, systems, or strategies, it keeps your message organized and engaging. Fully editable and compatible with PowerPoint, Keynote, and Google Slides.


5 slides
Annual Business Report Slide Deck Presentation
Turn your yearly data into a stunning visual story with this clean and structured presentation design. Perfect for showcasing company performance, growth metrics, and strategic goals, it helps make complex data clear and engaging. Fully editable and compatible with PowerPoint, Keynote, and Google Slides for seamless customization.