


Features
- 21 Unique slides
- Fully editable and easy to edit in Microsoft Powerpoint, Keynote and Google Slides
- 16:9 widescreen layout
- Clean and professional designs
- Export to JPG, PDF or send by email


Do you have any questions?
Recommend


4 slides
Business Challenge Overview Presentation
Kick off your message with a dynamic overview that makes complex challenges feel clear, visual, and manageable. This presentation helps you break down obstacles, compare factors, and guide teams toward smarter decisions with an organized, flowing layout. Fully compatible with PowerPoint, Keynote, and Google Slides.


4 slides
Scrum & Agile Sprint Presentation
Bring movement and clarity to your workflow with a dynamic loop-and-sprint visual that makes progress feel intuitive and easy to track. This presentation helps you outline iterations, refine tasks, and communicate team priorities with confidence. Fully editable and compatible with PowerPoint, Keynote, and Google Slides.


6 slides
Closing Summary and Key Takeaways Presentation
Wrap up your presentation with clarity using the Closing Summary and Key Takeaways Presentation. This slide features a semi-circular segmented layout, ideal for highlighting 3–5 final points, action steps, or reflections. Clean, modern, and easy to customize in PowerPoint, Keynote, Google Slides, or Canva—perfect for impactful conclusions.


4 slides
Digital Payment and Card Services Presentation
Step into the world of contactless commerce with this clean, modern slide design. It’s built to help you present how digital payment systems and card-based services are transforming transactions in today’s economy. Perfect for fintech updates, product walkthroughs, or training decks. Fully compatible with PowerPoint, Keynote, and Google Slides.


6 slides
Oceania Regional Coverage Strategy Presentation
Plan and present your regional focus with the Oceania Regional Coverage Strategy Presentation. This slide template features a clear map of Oceania with pinpoint markers and corresponding callout labels, perfect for visualizing expansion zones, logistics hubs, or target markets. Fully customizable in Canva, PowerPoint, and Google Slides.


22 slides
Meteor Academic Research Report Presentation
Get ready to make your research presentation stand out with the Meteor Academic Research Report template! This elegant and sophisticated design is perfect for showcasing your research findings with clarity and impact. The template features a refined color scheme of earthy browns and soft greens, giving your presentation a polished and professional look. Each slide is carefully crafted to highlight key aspects of your research, from objectives and methodology to data analysis and conclusions. With dedicated sections for literature review, key findings, and future research directions, this template ensures that your audience can follow your research journey from start to finish. The clean and structured layout makes it easy to present complex information in a way that is easy to understand. Fully compatible with PowerPoint, Keynote, and Google Slides, the Meteor template is the ideal choice for delivering compelling and visually appealing academic presentations.


10 slides
Concentric Circles Business Model Presentation
Visualize Your Business Strategy with Clarity using this Concentric Circles Business Model Presentation template. This design helps you illustrate core business concepts, hierarchical structures, and strategic layers in a simple yet engaging format. Ideal for business planning, process optimization, and strategic growth presentations, this template makes complex relationships clear and easy to understand. Fully editable and available for PowerPoint, Keynote, and Google Slides.


6 slides
Six Sigma DMAIC Cycle Overview Presentation
Present each phase of the DMAIC methodology with the Six Sigma DMAIC Cycle Overview Presentation. This clean and professional layout walks through Define, Measure, Analyze, Improve, and Control in a clear, easy-to-follow structure. Perfect for Six Sigma professionals, quality managers, and operational teams. Fully editable in Canva, PowerPoint, Keynote, and Google Slides.


6 slides
Core Mission Vision Goals Presentation
Spark clarity and momentum with a clean, modern slide designed to showcase your organization’s purpose and future direction. This presentation highlights your core mission and vision in a visually engaging layout that keeps teams aligned and focused. Fully compatible with PowerPoint, Keynote, and Google Slides.


23 slides
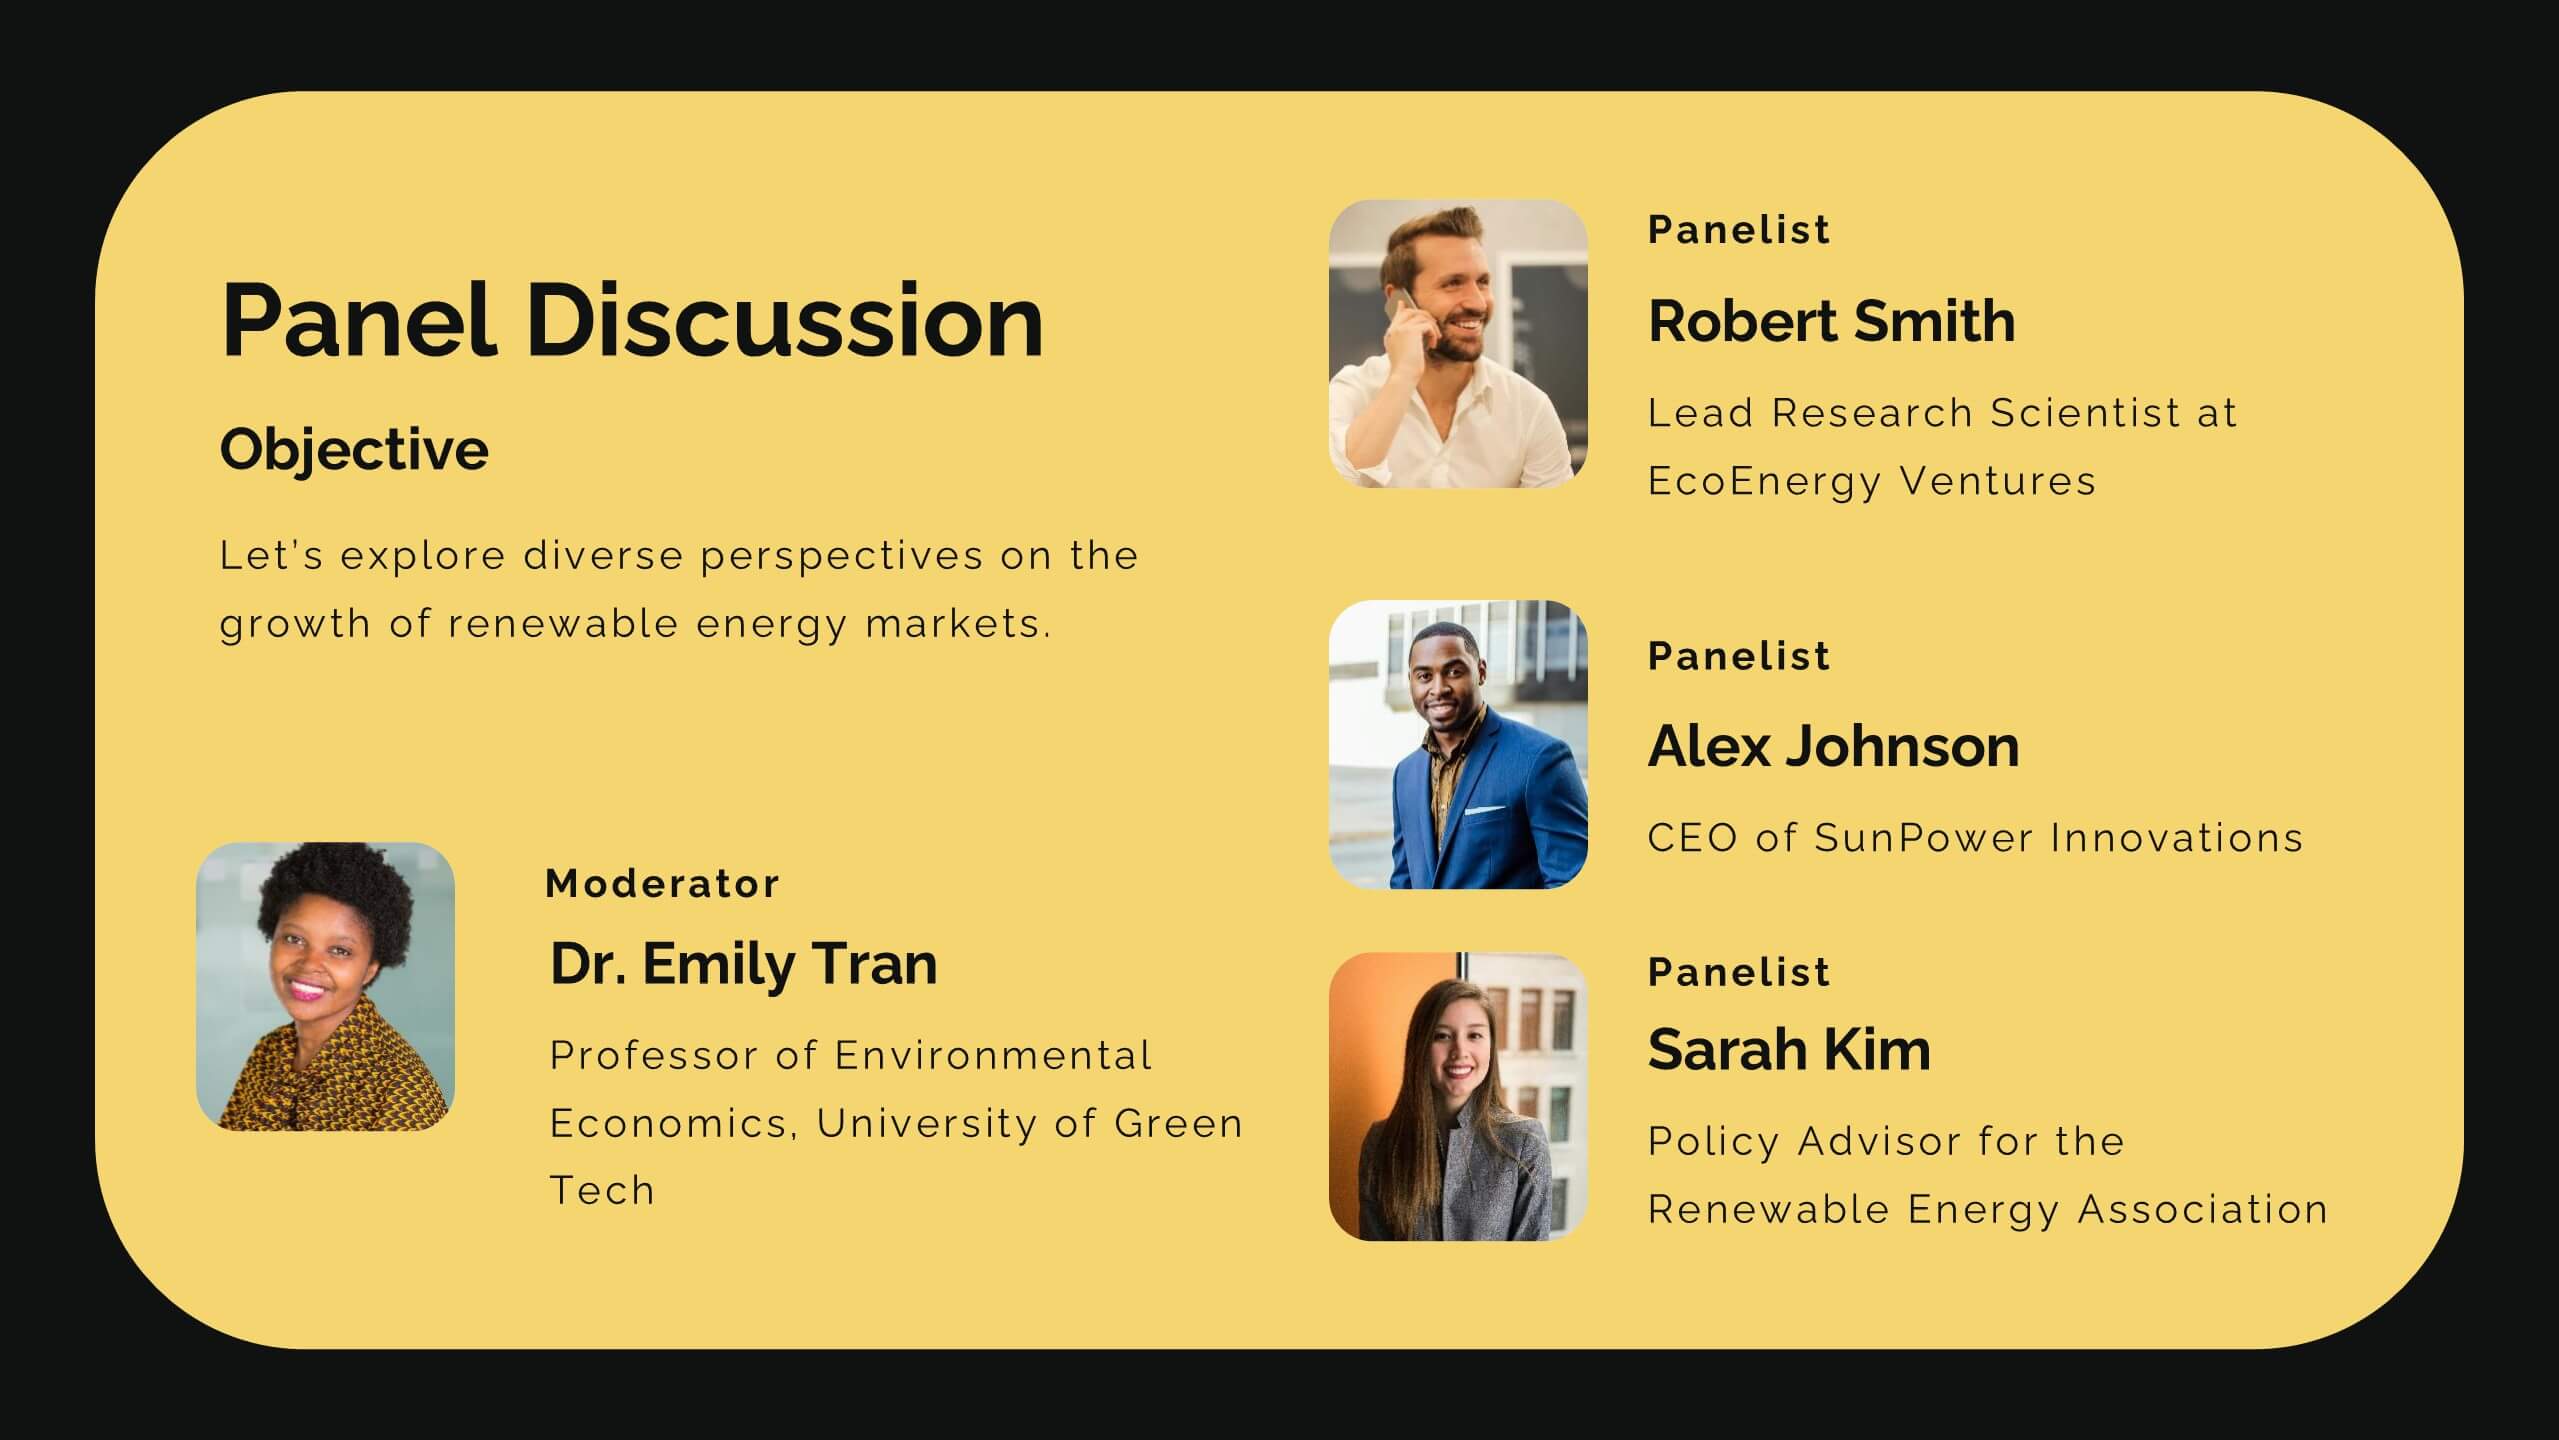
Diamond Business Development Proposal Presentation
Unlock the potential of your business proposals with this bold and engaging presentation template! Perfect for business development pitches, conferences, and workshops, it includes sections for speaker introductions, panel discussions, and session breakdowns. With its clean and professional design, this template ensures clarity and impact. Fully customizable and compatible with PowerPoint, Keynote, and Google Slides.


20 slides
Aurorium Sales Proposal Presentation
Win over clients with confidence using this sleek and modern sales proposal presentation. Designed to highlight key business strategies, pricing plans, competitive analysis, and future opportunities, this template helps you communicate your value with clarity and impact. Fully customizable and compatible with PowerPoint, Keynote, and Google Slides for seamless presentations.

20 slides
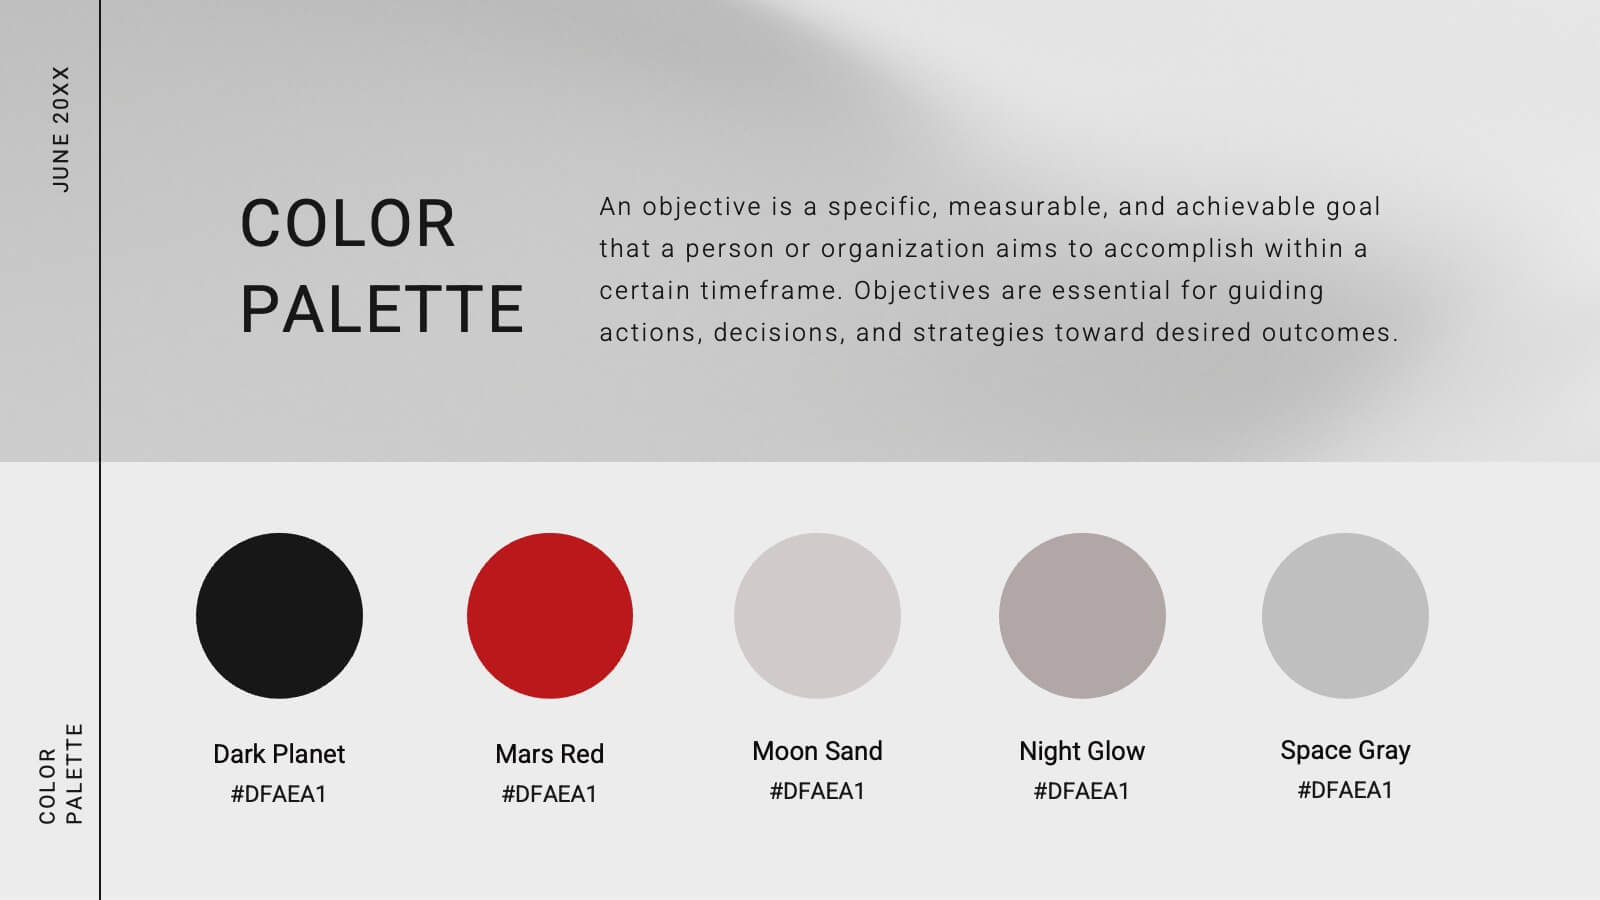
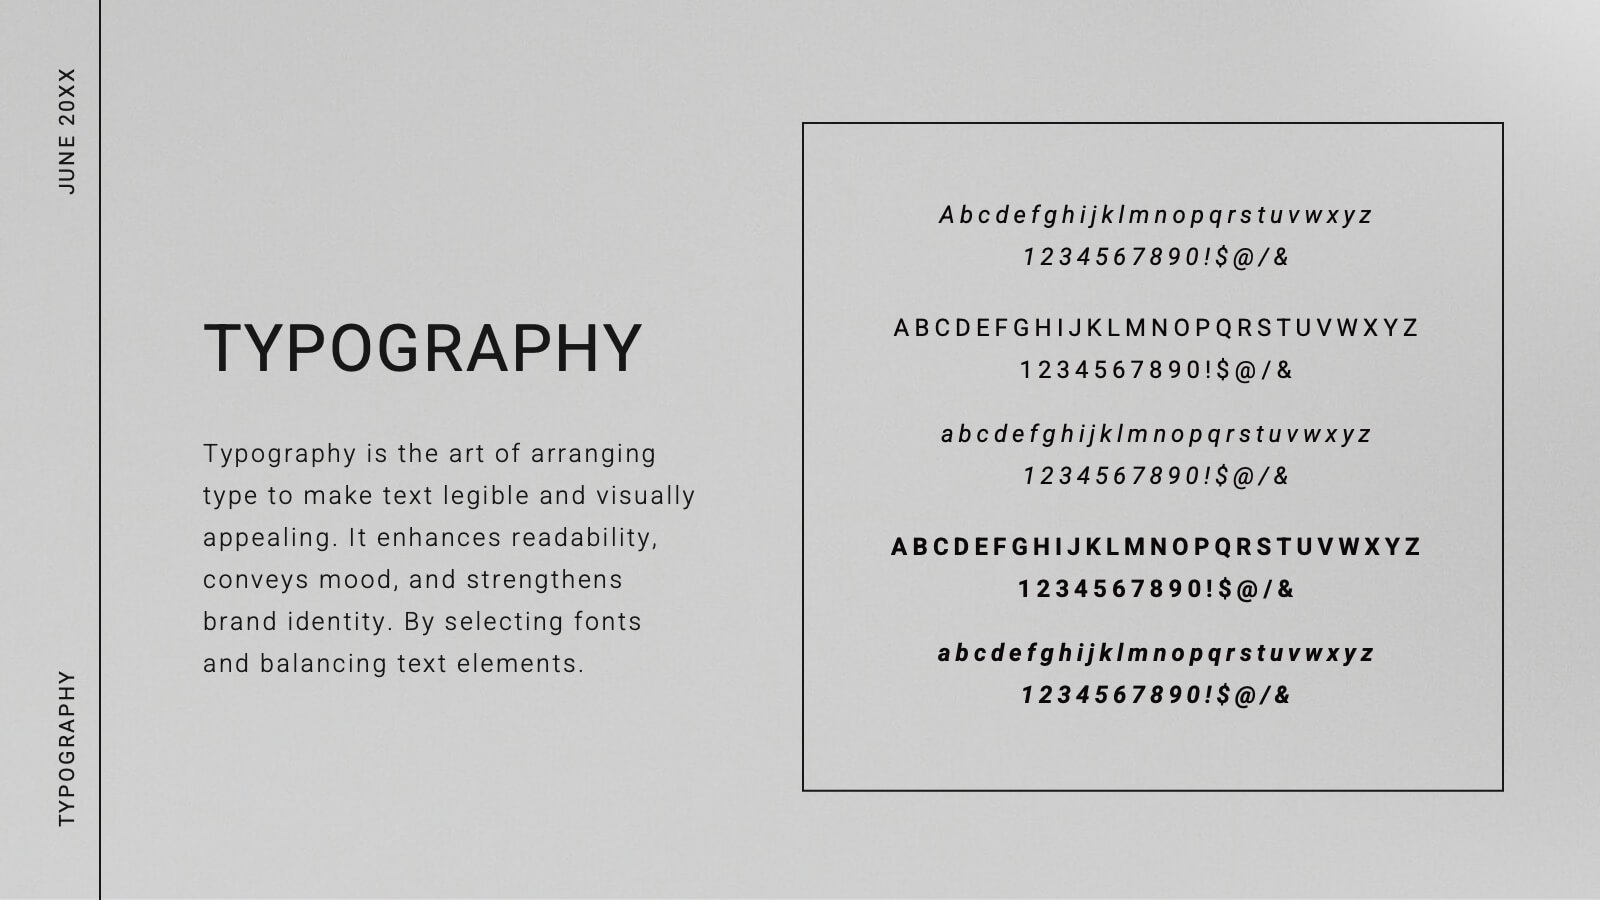
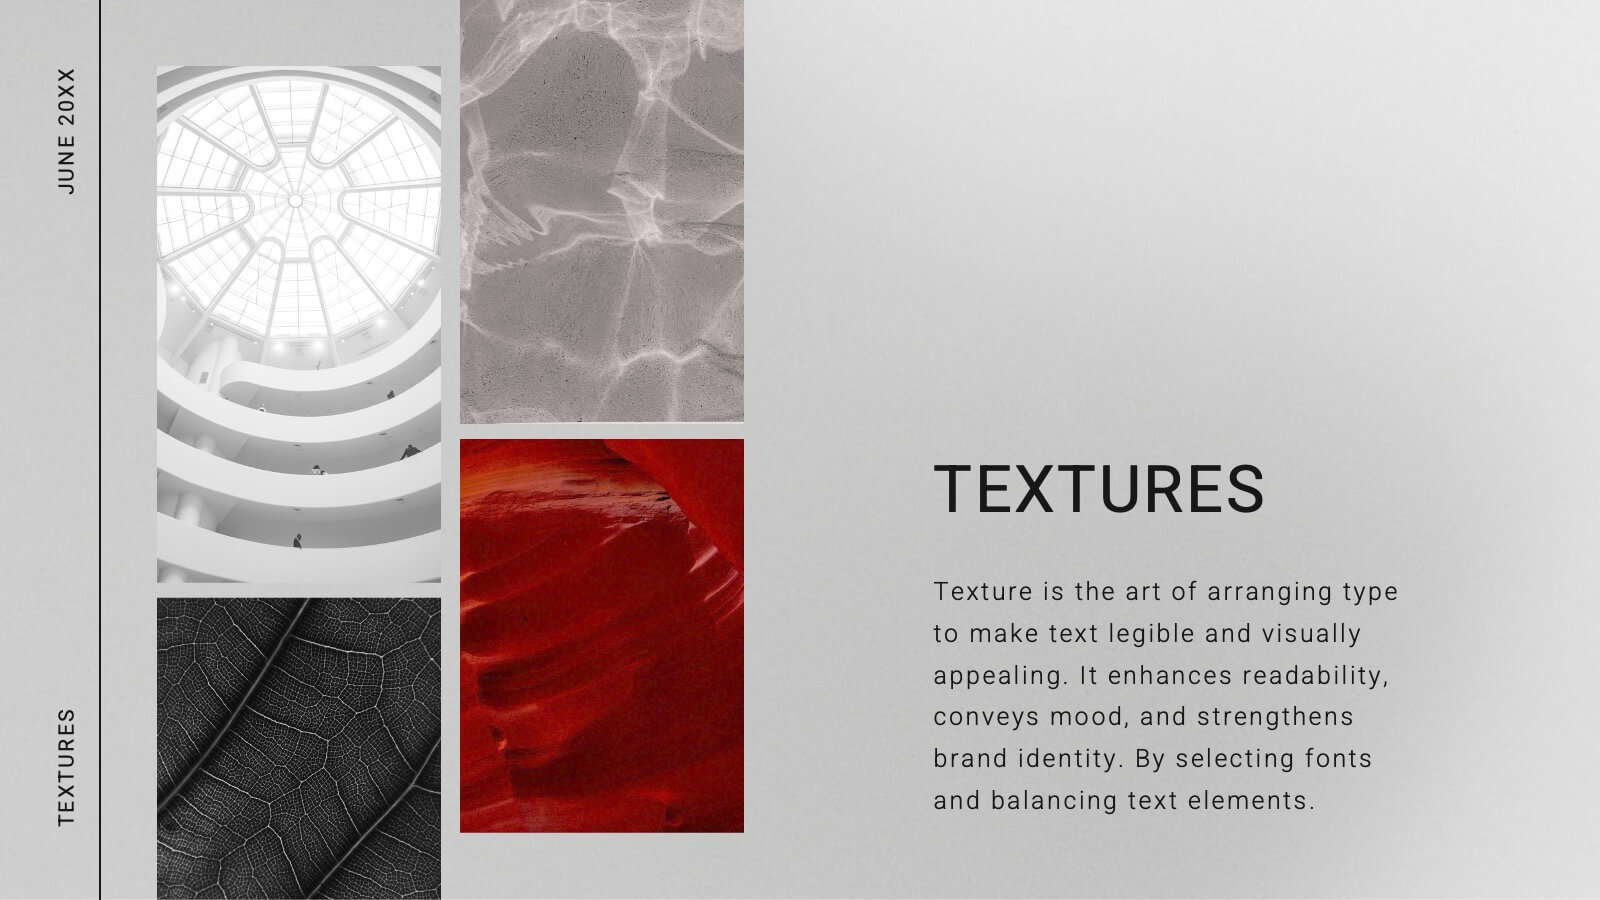
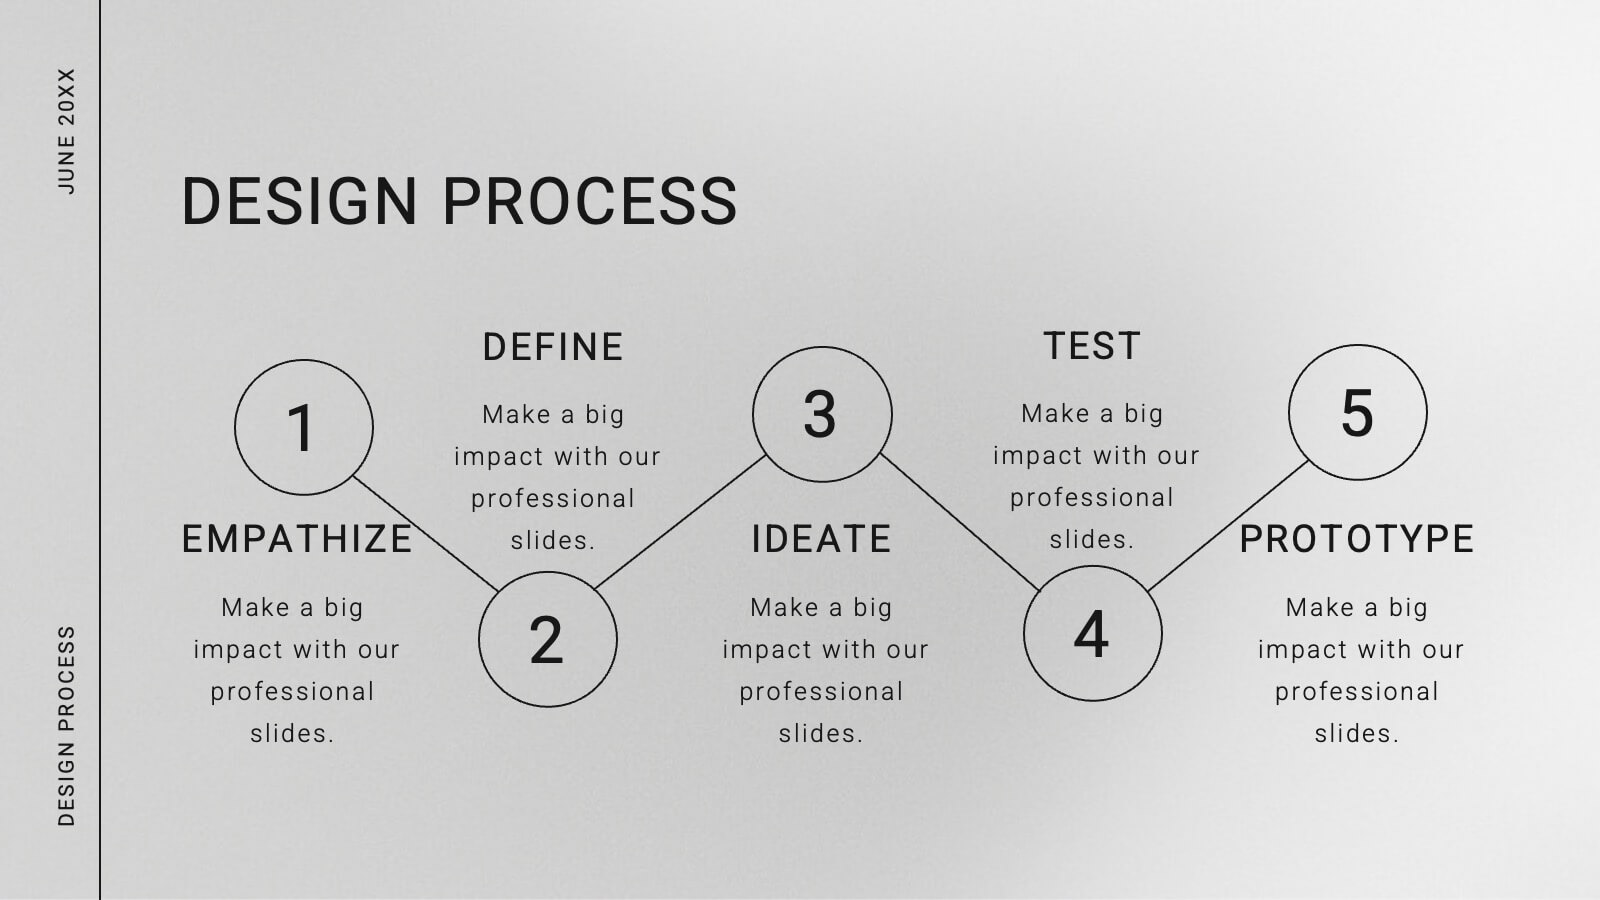
Comet Graphic Design Project Plan Presentation
Craft stunning design project presentations with this elegant template. Showcase objectives, processes, mood boards, and final designs effectively. Ideal for creative teams and clients. Fully compatible with PowerPoint, Keynote, and Google Slides.


5 slides
Problem Framing and Opportunity Identification Presentation
Spot challenges and uncover growth potential with this Problem Framing and Opportunity Identification presentation. Ideal for strategy sessions, this layered pyramid layout helps you organize problems from surface-level to root causes while aligning them with strategic opportunities. Fully editable in Canva, PowerPoint, or Google Slides for seamless customization.


6 slides
Geographic Asia Overview Template Presentation
Discover insights across Asia with a clean, professional layout that brings your regional data to life. Perfect for showcasing demographics, market distribution, or geographic highlights, this visual map design ensures clarity and impact in every slide. Fully compatible with PowerPoint, Keynote, and Google Slides for effortless editing and presentation.


26 slides
Company Profile Simple Duotone Presentation
Introducing our premier company profile presentation template, designed to beautifully encapsulate the essence of your business. Set against a backdrop that transitions from the serene blue sky to a deeper, more intense blue, this template evokes feelings of limitless possibilities and profound depth. This dual-tone theme, with its varying shades of blue, not only emphasizes trust, professionalism, and reliability but also creates an atmosphere of calm and stability, essential attributes for showcasing your company's strengths and accomplishments. Modern in its layout, our template facilitates a structured presentation of your company's history, mission, achievements, and future aspirations. The design intricately merges the visuals of the expansive sky with the profound depth of the darker hue, creating a narrative that speaks of a firm foundation with an eye on soaring to new heights. Perfectly compatible with both PowerPoint and Google Slides, this template offers ease of customization. Whether it's adjusting the content to fit your corporate story or tweaking the design elements, this template offers flexibility and user-friendliness. Dive deep into your company's journey and aspirations with this exquisite blue-themed template. It's not just a presentation; it's a reflection of your company's ethos and vision. Utilize this template to give stakeholders, partners, and employees a p....


4 slides
Customers Journey Map Presentation
Take your audience on a smooth, visual adventure that clearly outlines each stage of the customer experience. This presentation helps you map behaviors, highlight key interactions, and explain decision points with clarity and style. Designed for easy customization and fully compatible with PowerPoint, Keynote, and Google Slides.


4 slides
Task Workflow and Process Automation Presentation
Streamline complex systems with the Task Workflow and Process Automation Presentation. This flowchart-based layout is perfect for visualizing step-by-step procedures, automation pipelines, or operational structures. Each phase is clearly separated, making it easy to track tasks, decisions, and outcomes. Ideal for IT, operations, or management teams. Fully editable in PowerPoint, Keynote, and Google Slides.