


Características


¿Tienes alguna pregunta?
Recomendar


7 diapositivas
Modern Artificial Intelligence Infographic
Modern Artificial Intelligence refers to the contemporary state of AI technology, methods, and applications that have evolved significantly in recent years, especially from the early 21st century onwards. This infographic template is designed to present complex information in a clear and engaging manner. This template uses visuals like charts, graphs, icons, and text to enhance understanding. The objective of this infographic is to provide a visual and informative snapshot of the contemporary landscape of artificial intelligence, making complex concepts accessible to a broad audience.


7 diapositivas
IT Architecture Services Infographic Presentation
An IT Architecture Infographic presents information related to the design, structure, and components of an organization's architecture. IT Architecture refers to the overall framework of an organization's IT systems and infrastructure. This template is designed to communicate the design, structure, and components of your organization's IT architecture. The template features a modern design with a blue color scheme, giving your presentation a professional and sleek look. It is compatible with Powerpoint, Keynote, and Google Slides, making it simple for you to create a professional presentation.


6 diapositivas
Orientation Plan for New Employees Presentation
Welcome your new team members with confidence using a visually clear, step-based layout that streamlines the introduction process. This presentation helps HR leaders outline company values, roles, and expectations with ease and professionalism. Fully compatible with PowerPoint, Keynote, and Google Slides for effortless editing and presentation across any platform.


7 diapositivas
Business Concept Mind Map Presentation
Visualize strategic thinking with the Business Concept Mind Map Presentation. This clear, central-diagram layout helps organize six core ideas around a business theme, making complex concepts easy to grasp. Ideal for planning, brainstorming, or presentations. Fully editable and compatible with PowerPoint, Keynote, and Google Slides for maximum flexibility.


6 diapositivas
1-Page Executive Summary Slide Presentation
Bring clarity to complex updates in a single, colorful layout designed to keep your audience engaged from start to finish. This clean and modern slide breaks down key messages into six distinct points, making it easy to showcase progress, milestones, or strategies. Fully compatible with PowerPoint, Keynote, and Google Slides.


6 diapositivas
Market Challenges and Resilience Strategy Presentation
Tackle volatility with clarity using the Market Challenges and Resilience Strategy presentation. This slide features a modern smartphone graphic surrounded by six key strategy zones, each with its own icon and text area—ideal for outlining market pressures, competitive moves, or adaptive responses. Use it to communicate resilience frameworks, digital transformation steps, or scenario planning. Fully customizable in PowerPoint, Keynote, and Google Slides.


5 diapositivas
New Hire Orientation Program
Welcome new employees with confidence using the New Hire Orientation Program Presentation. This step-by-step slide is designed to outline your company’s onboarding journey in five clear, structured stages. With labeled “Step 01” through “Step 05” banners, icon placeholders, and editable text boxes, this template is ideal for HR teams, managers, or team leads introducing company values, processes, or benefits. Available in both full-color and progressive highlight variations, it's fully customizable in PowerPoint, Keynote, and Google Slides.


21 diapositivas
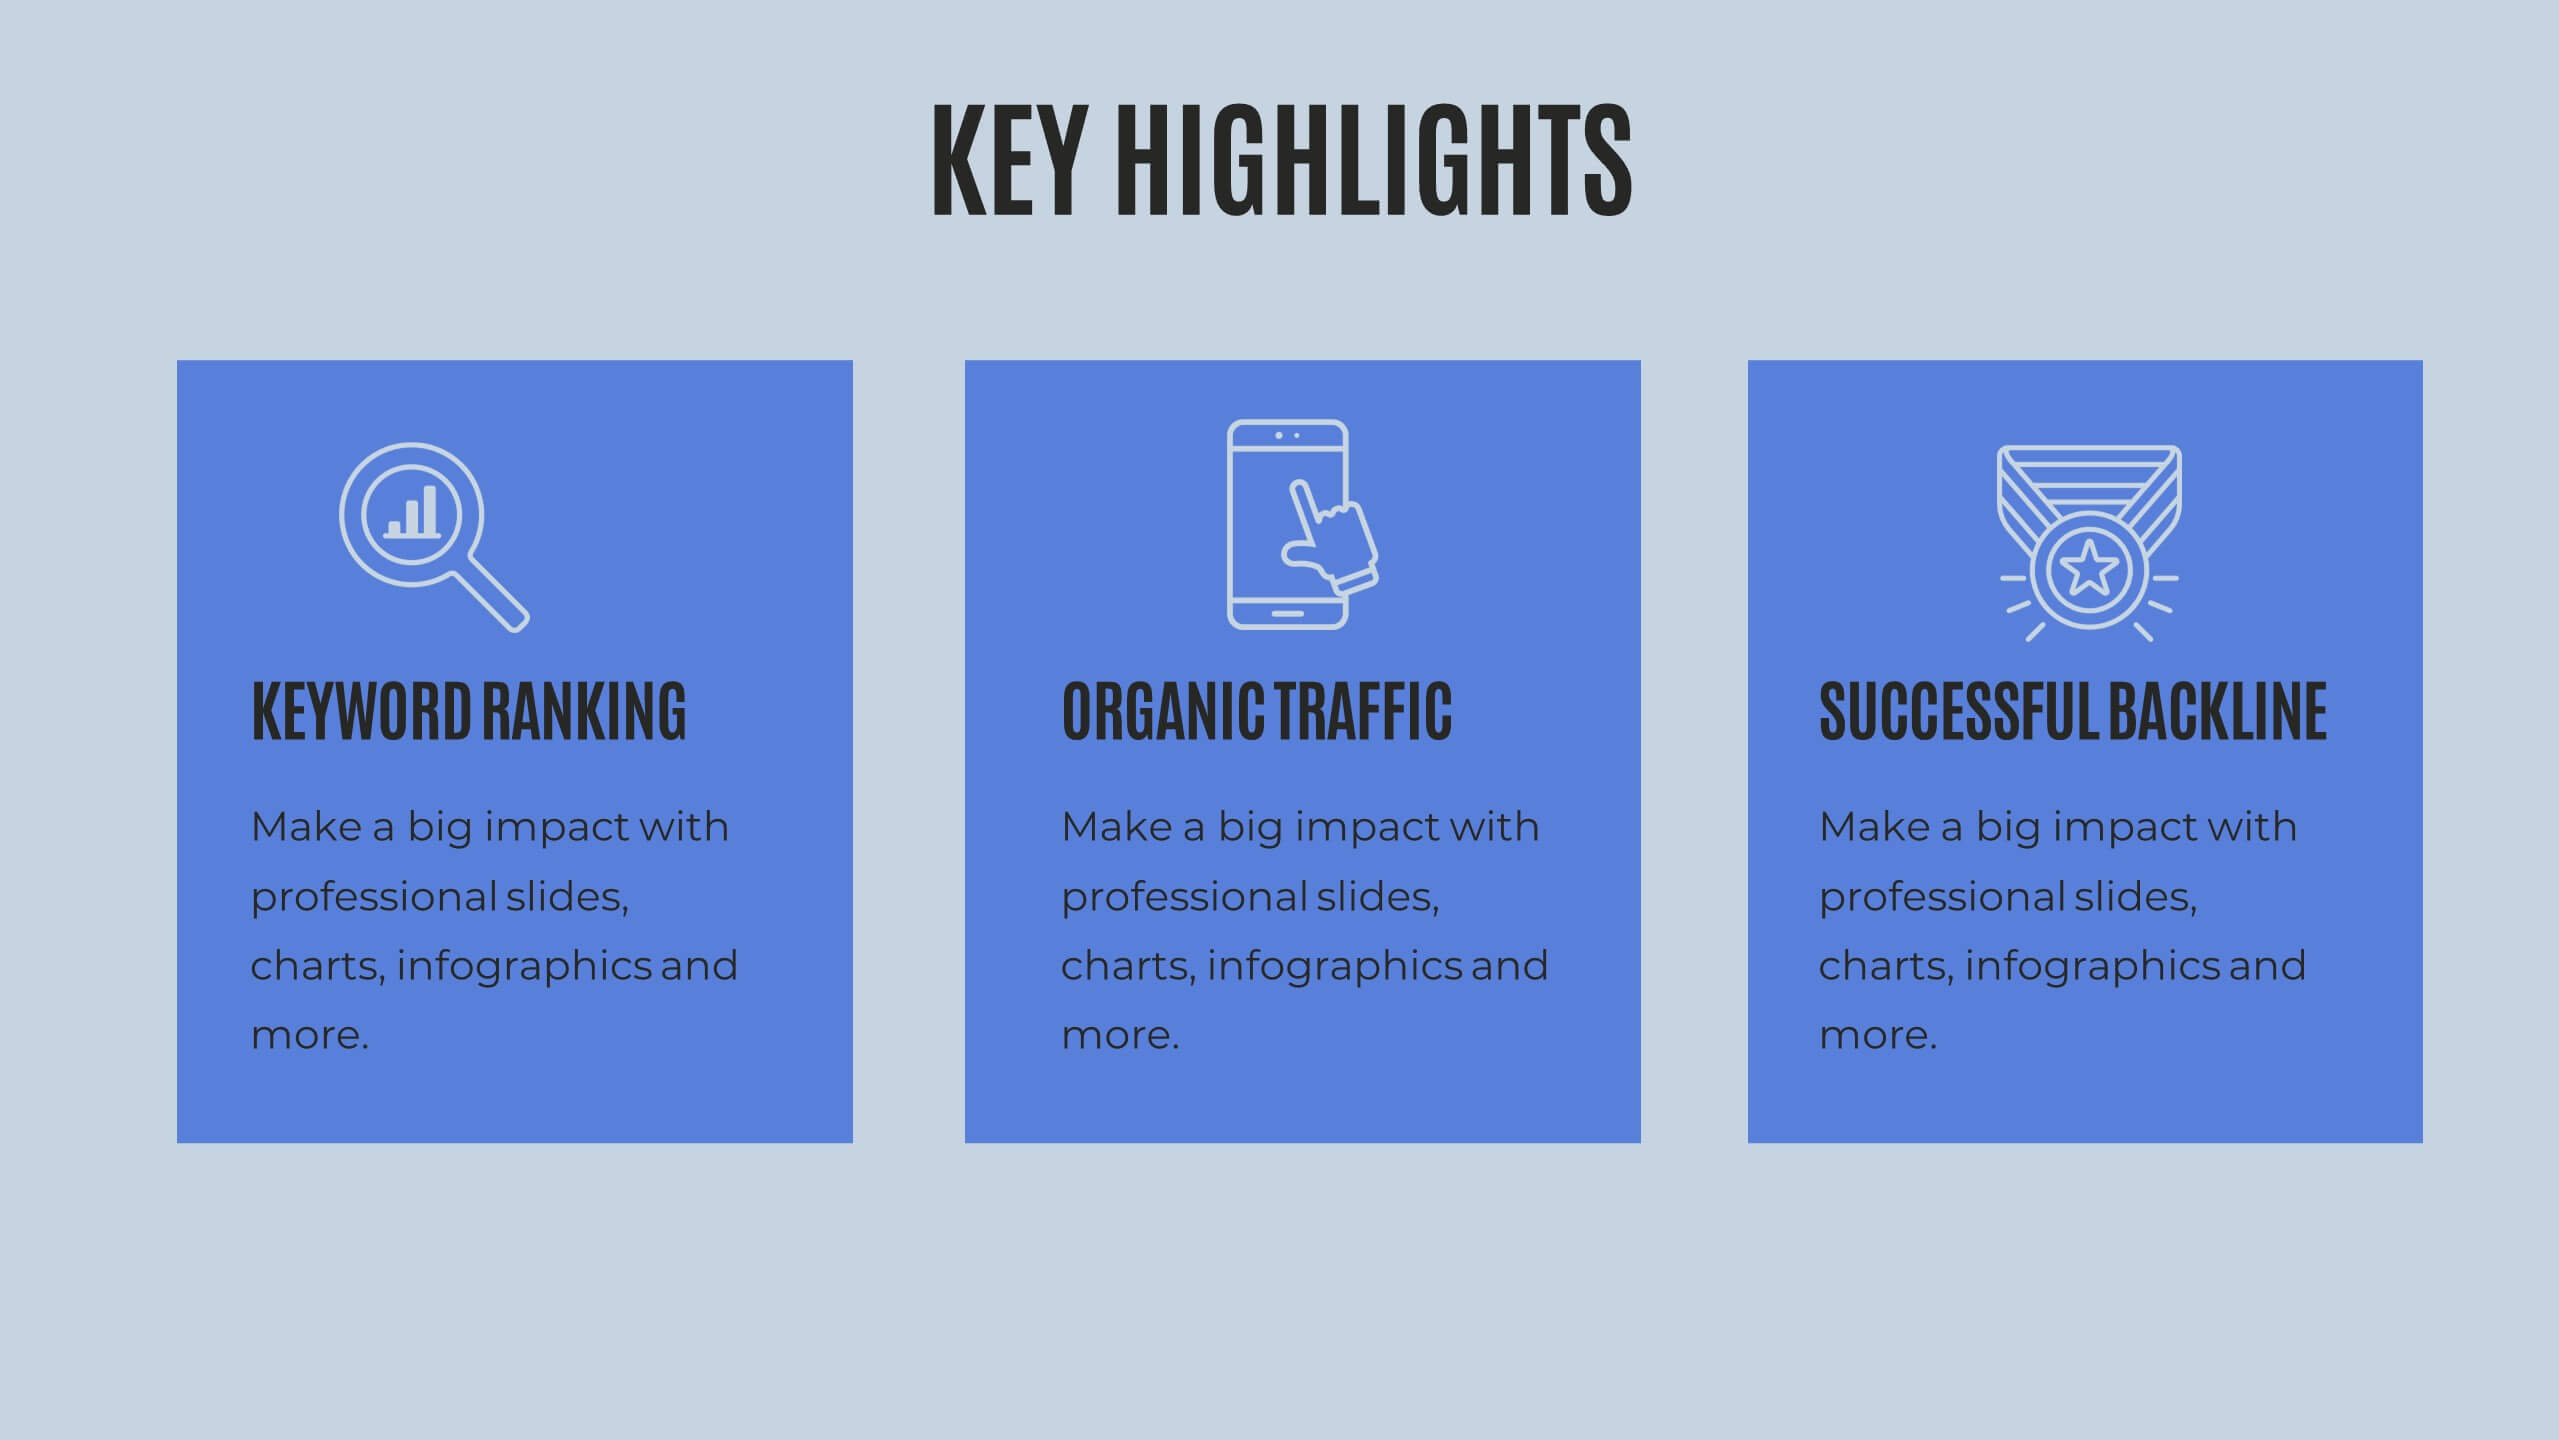
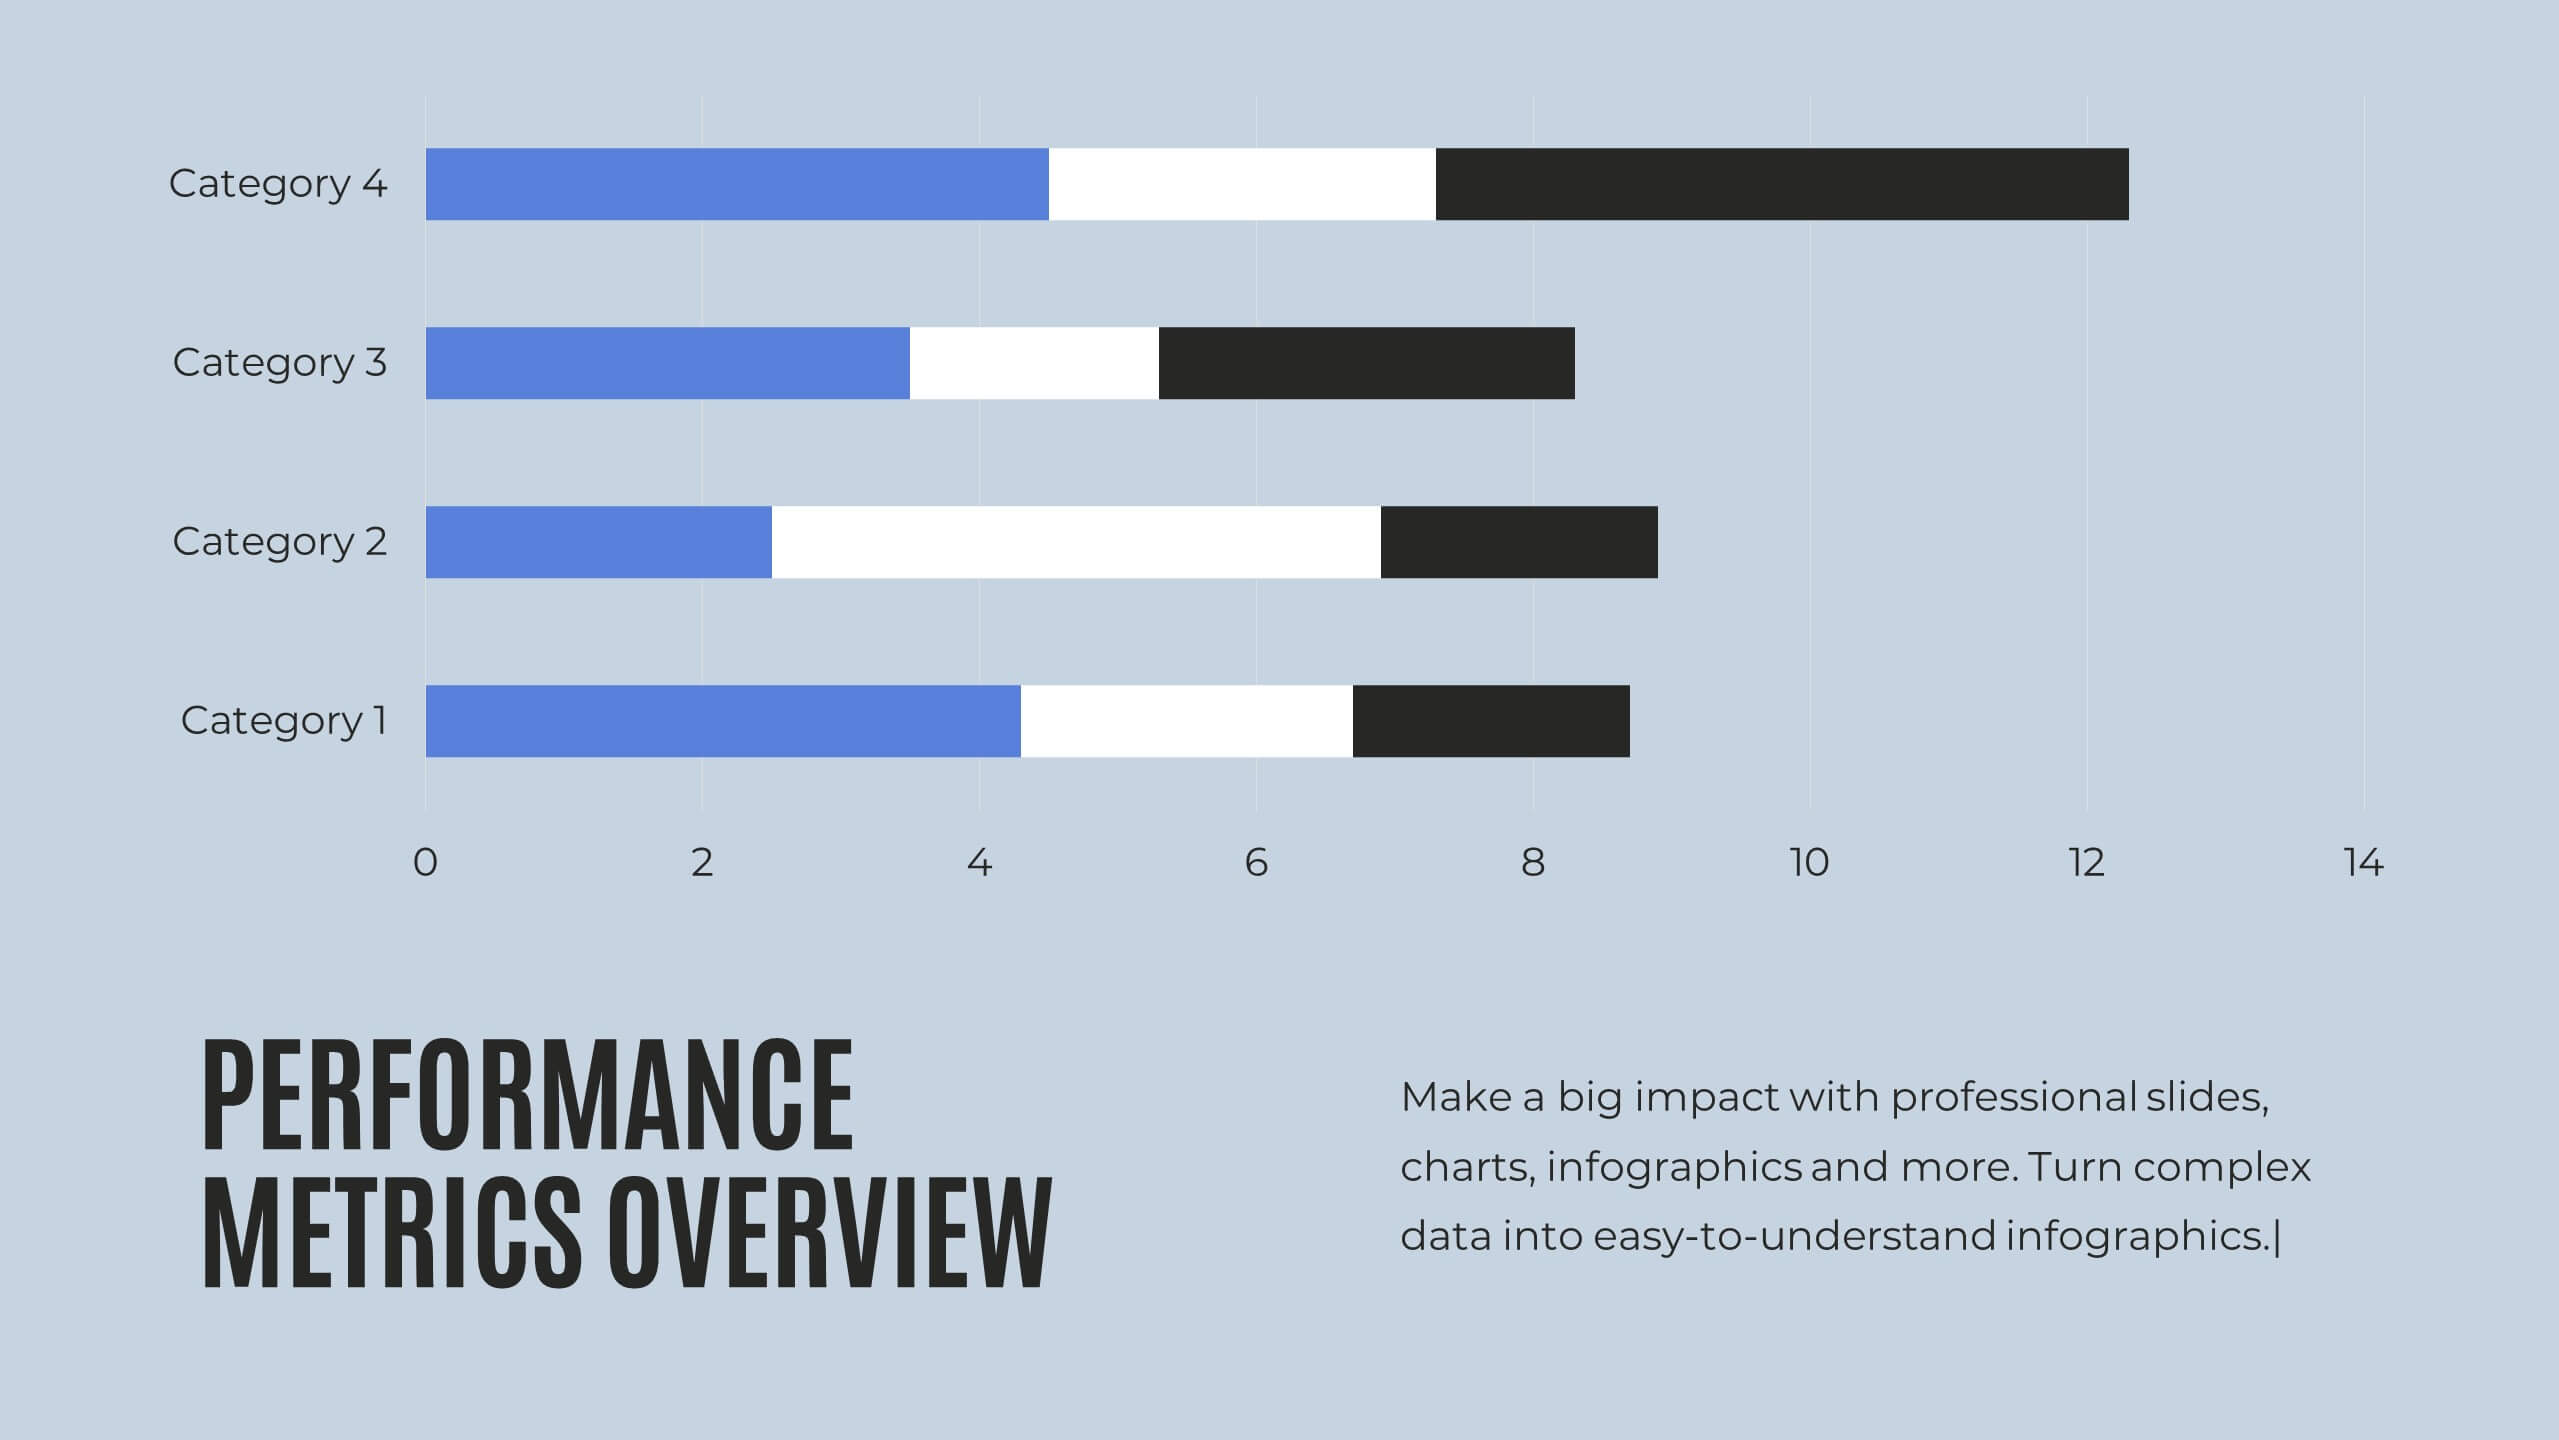
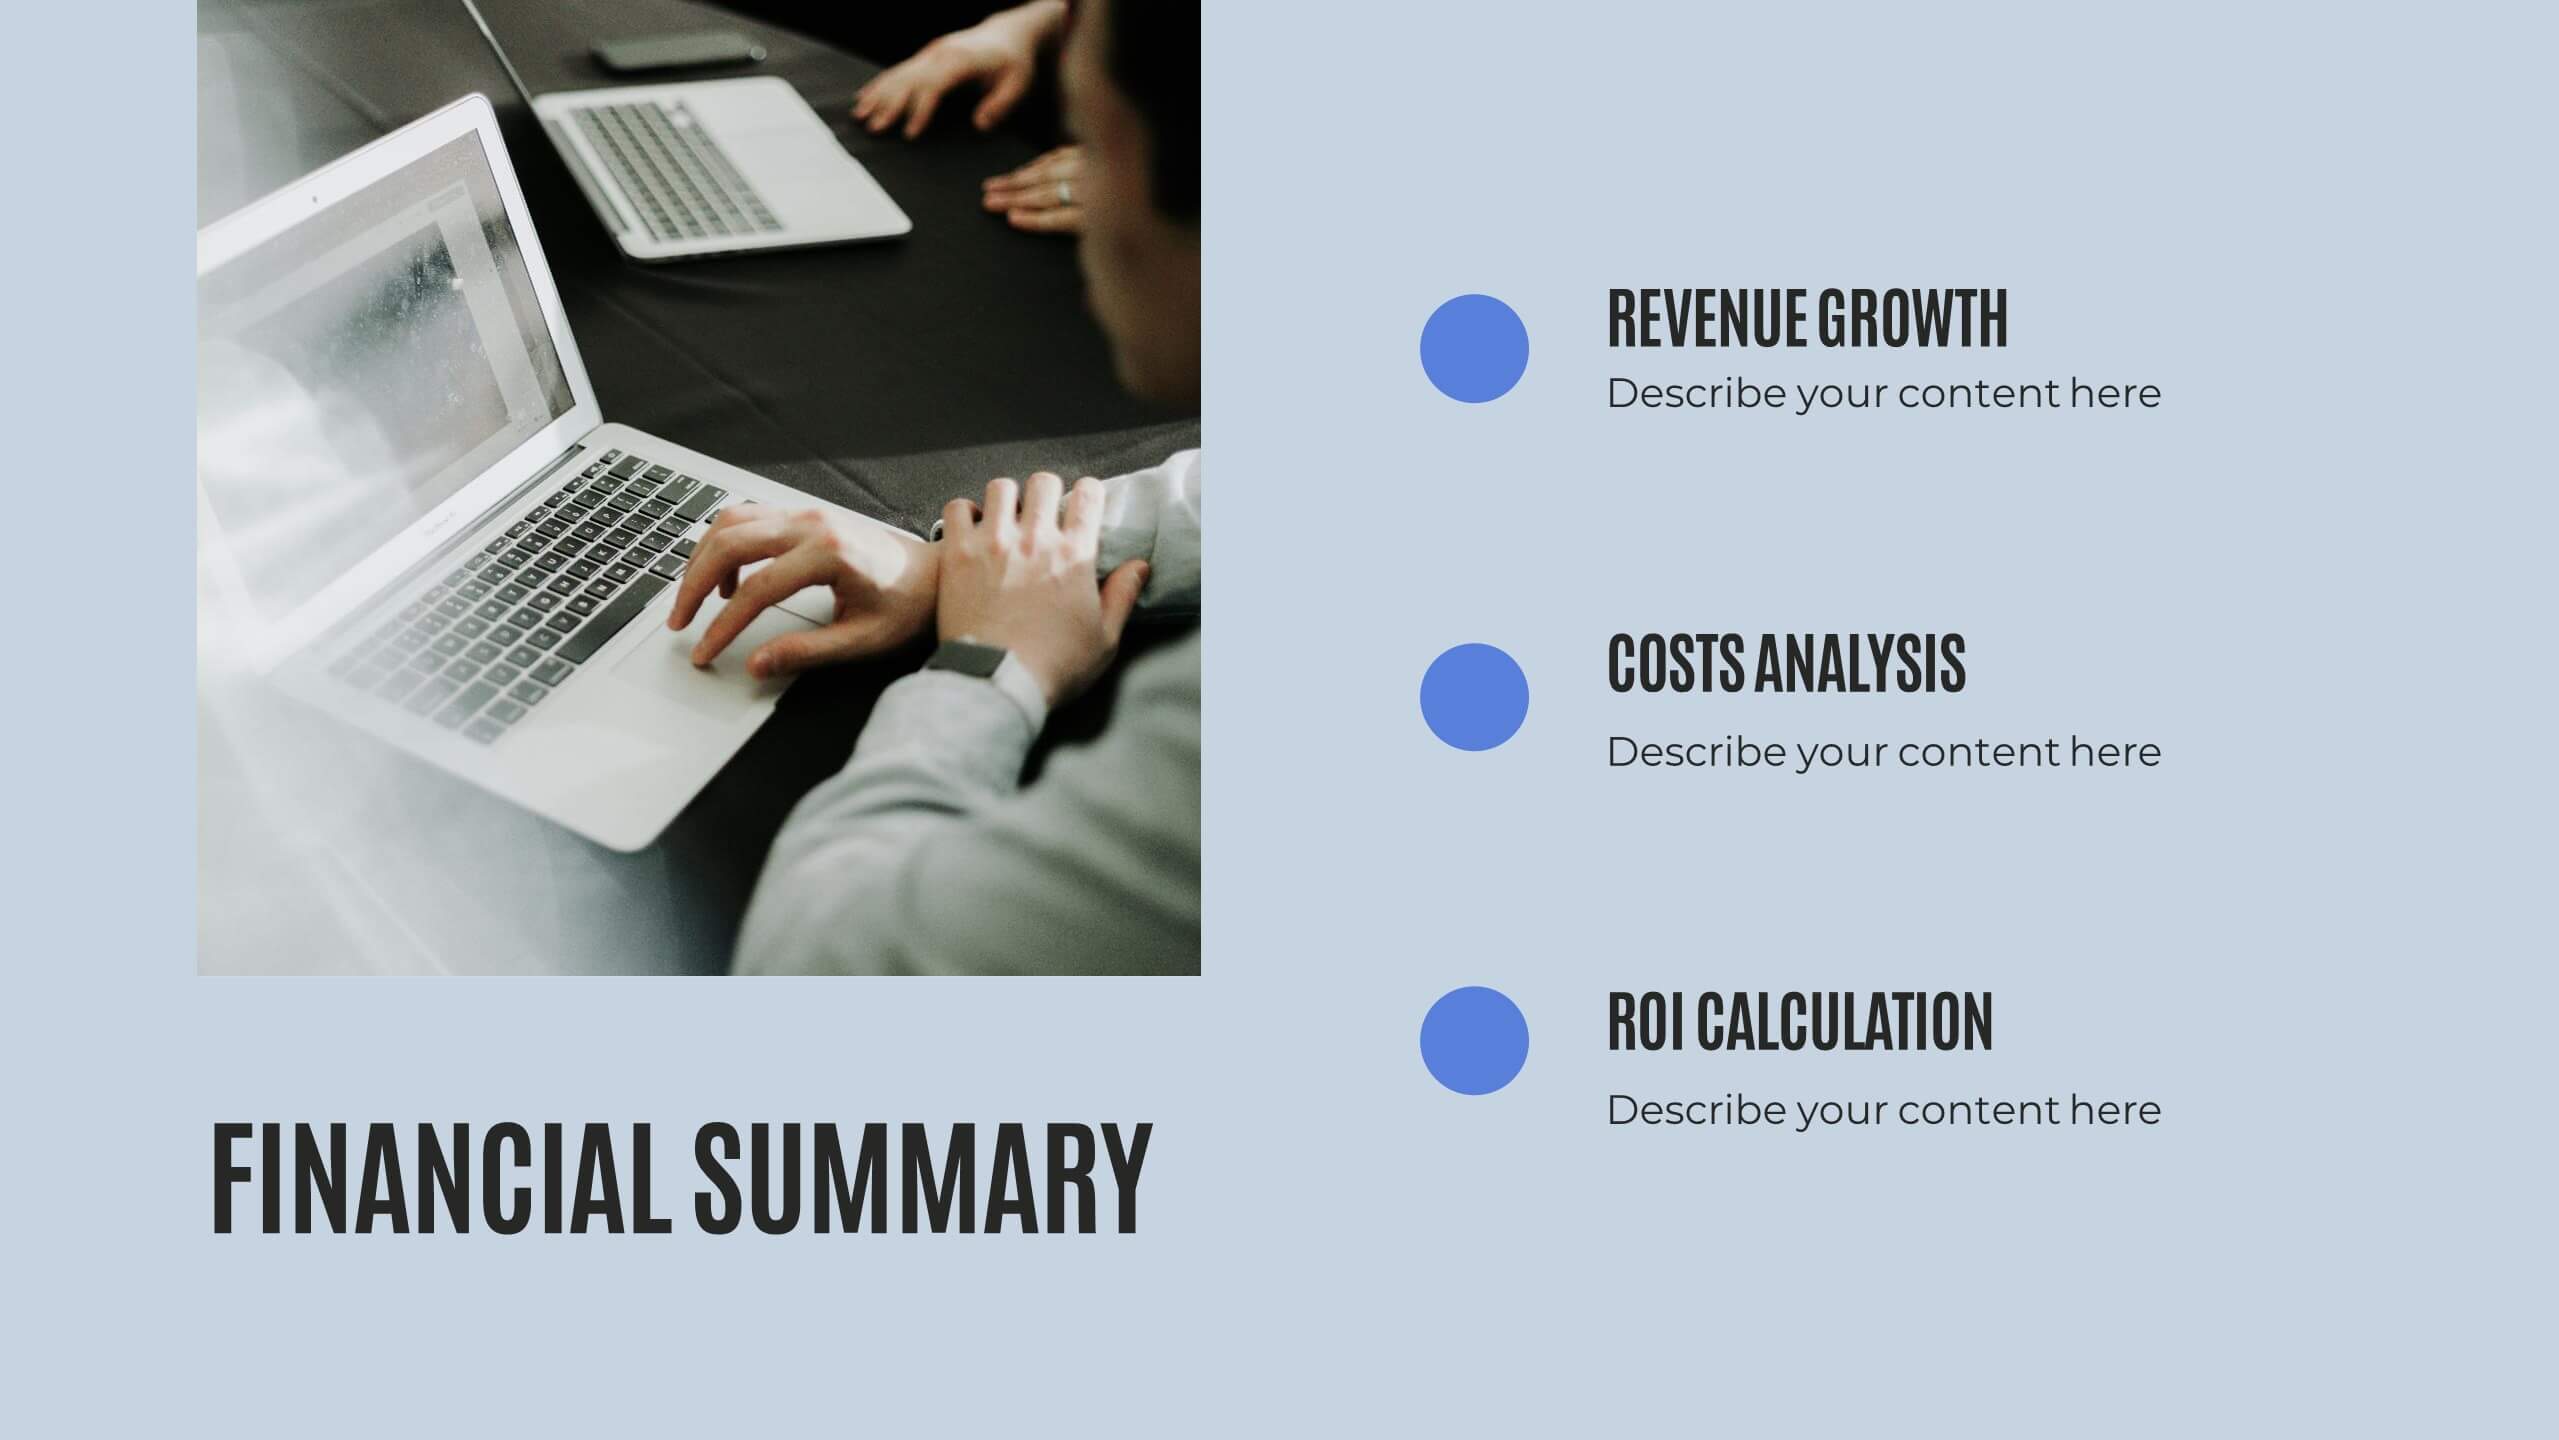
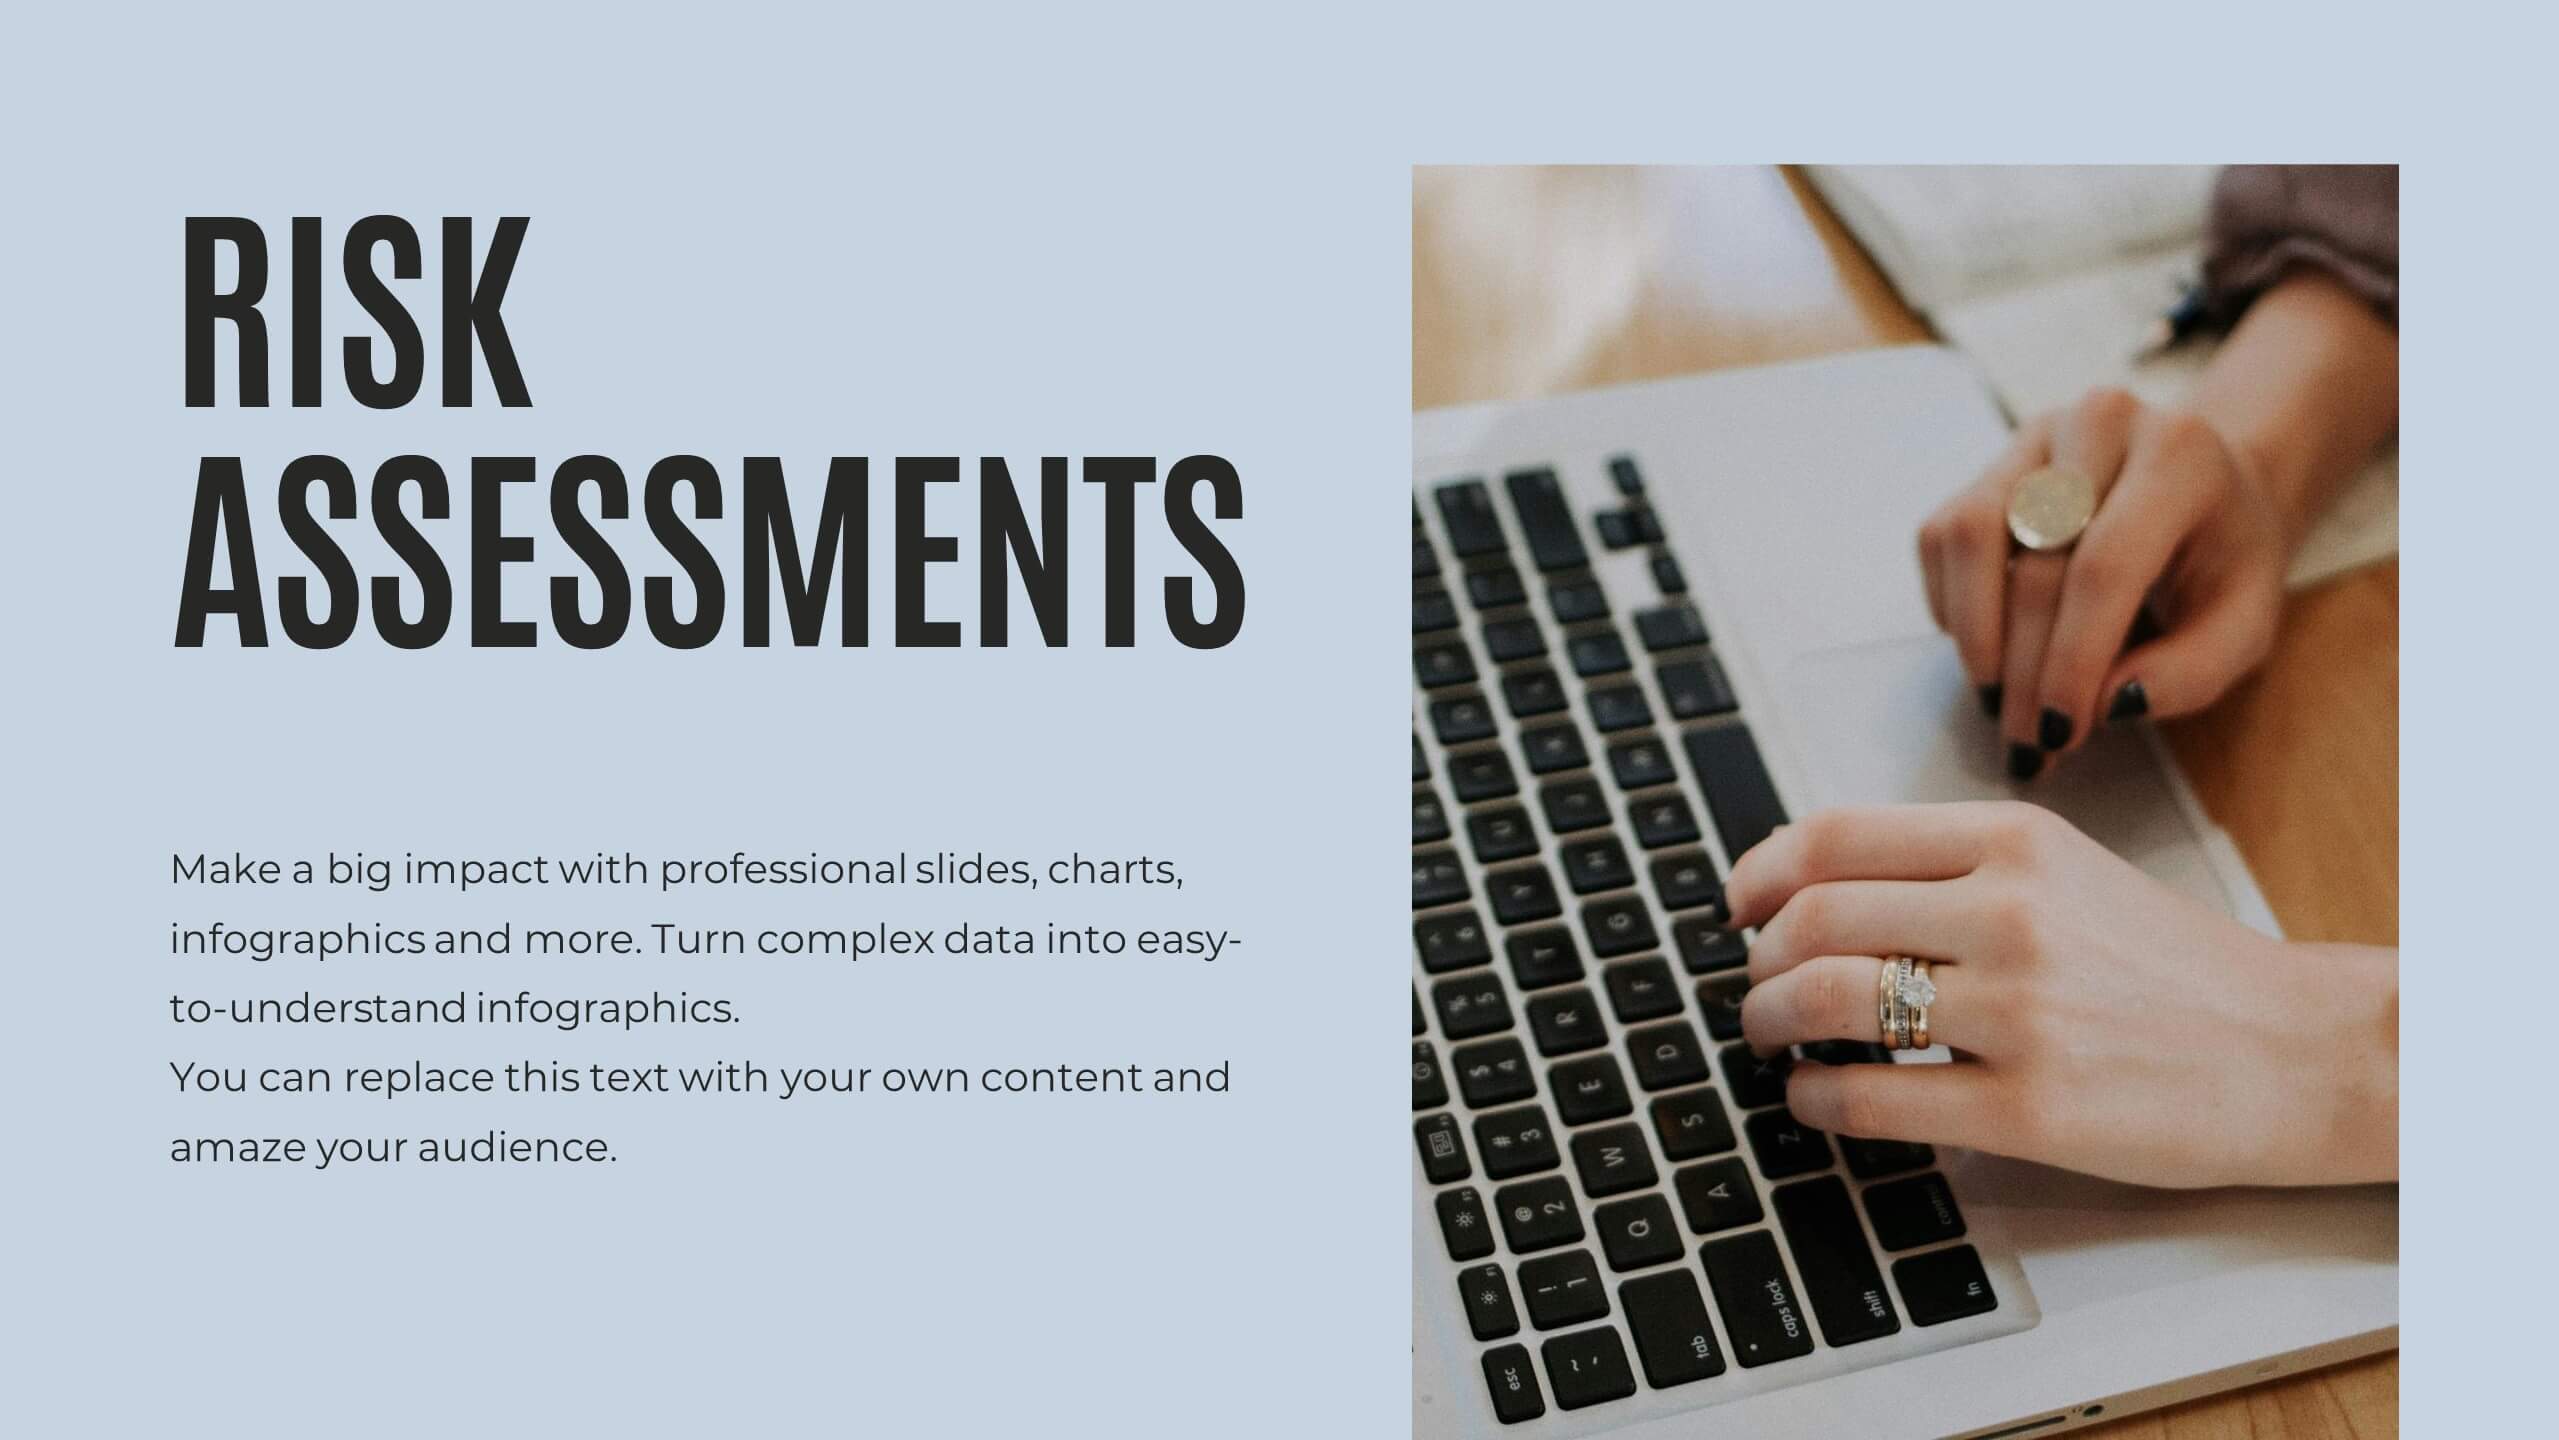
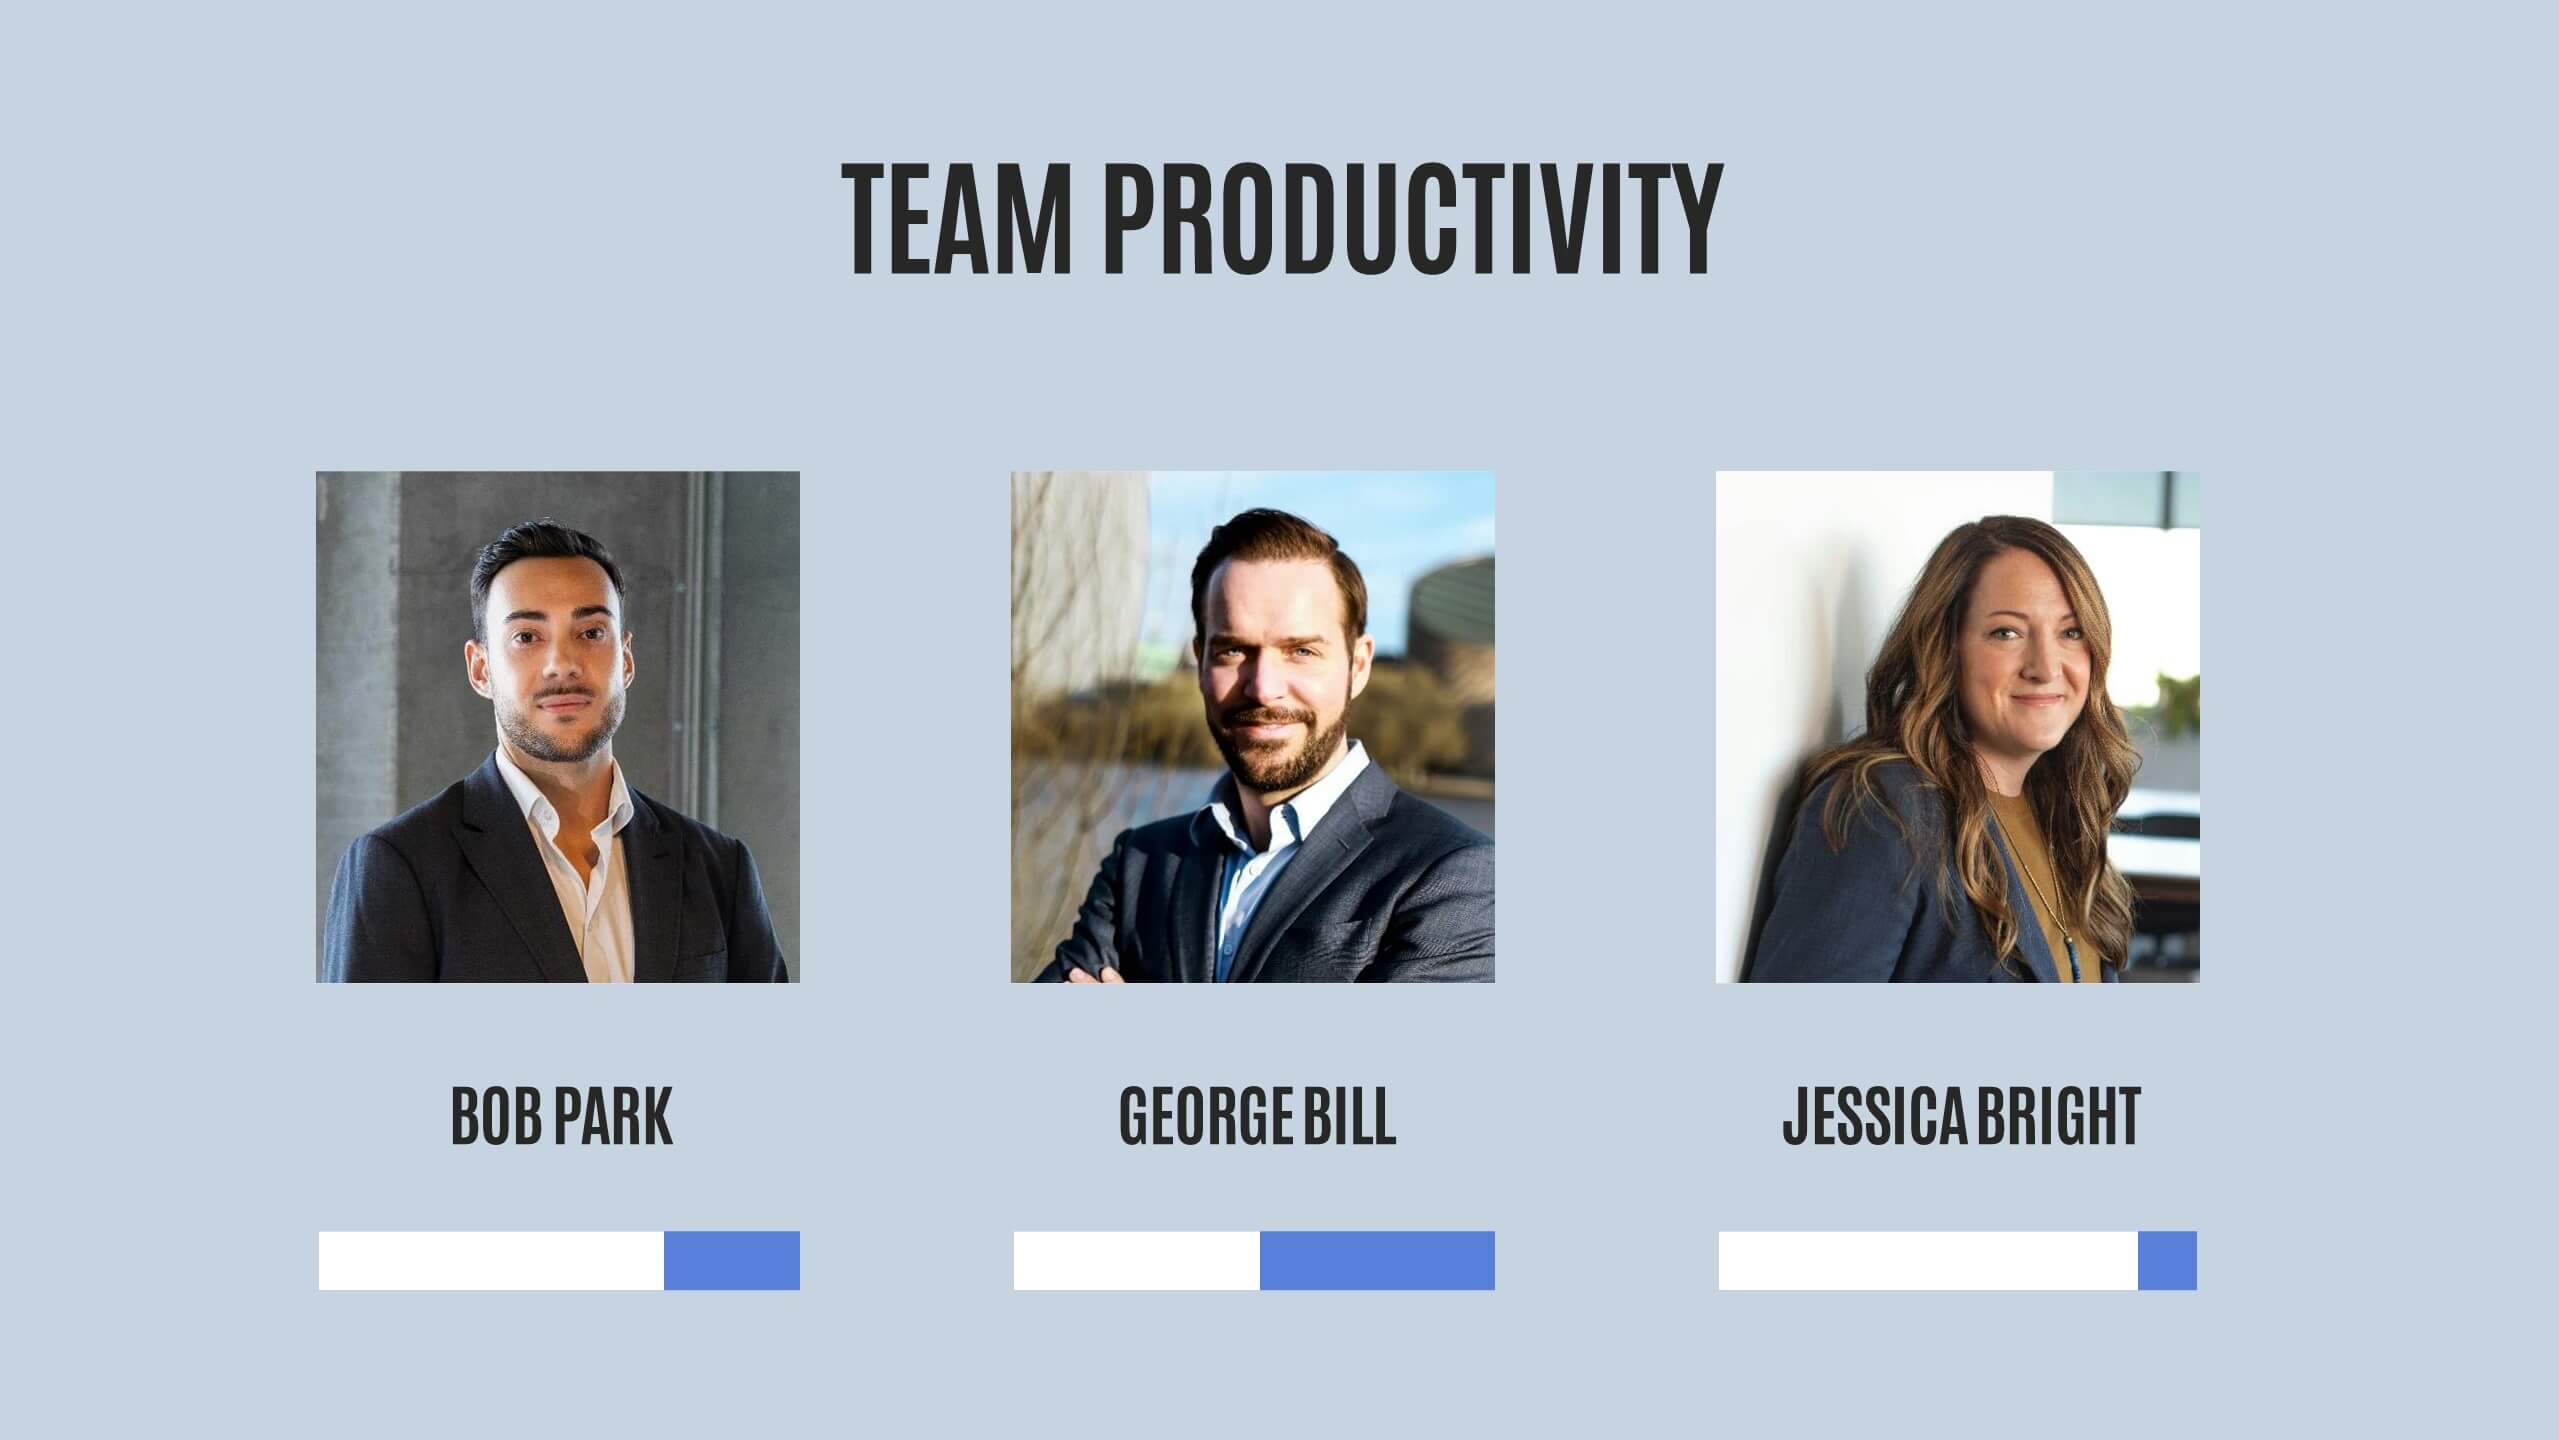
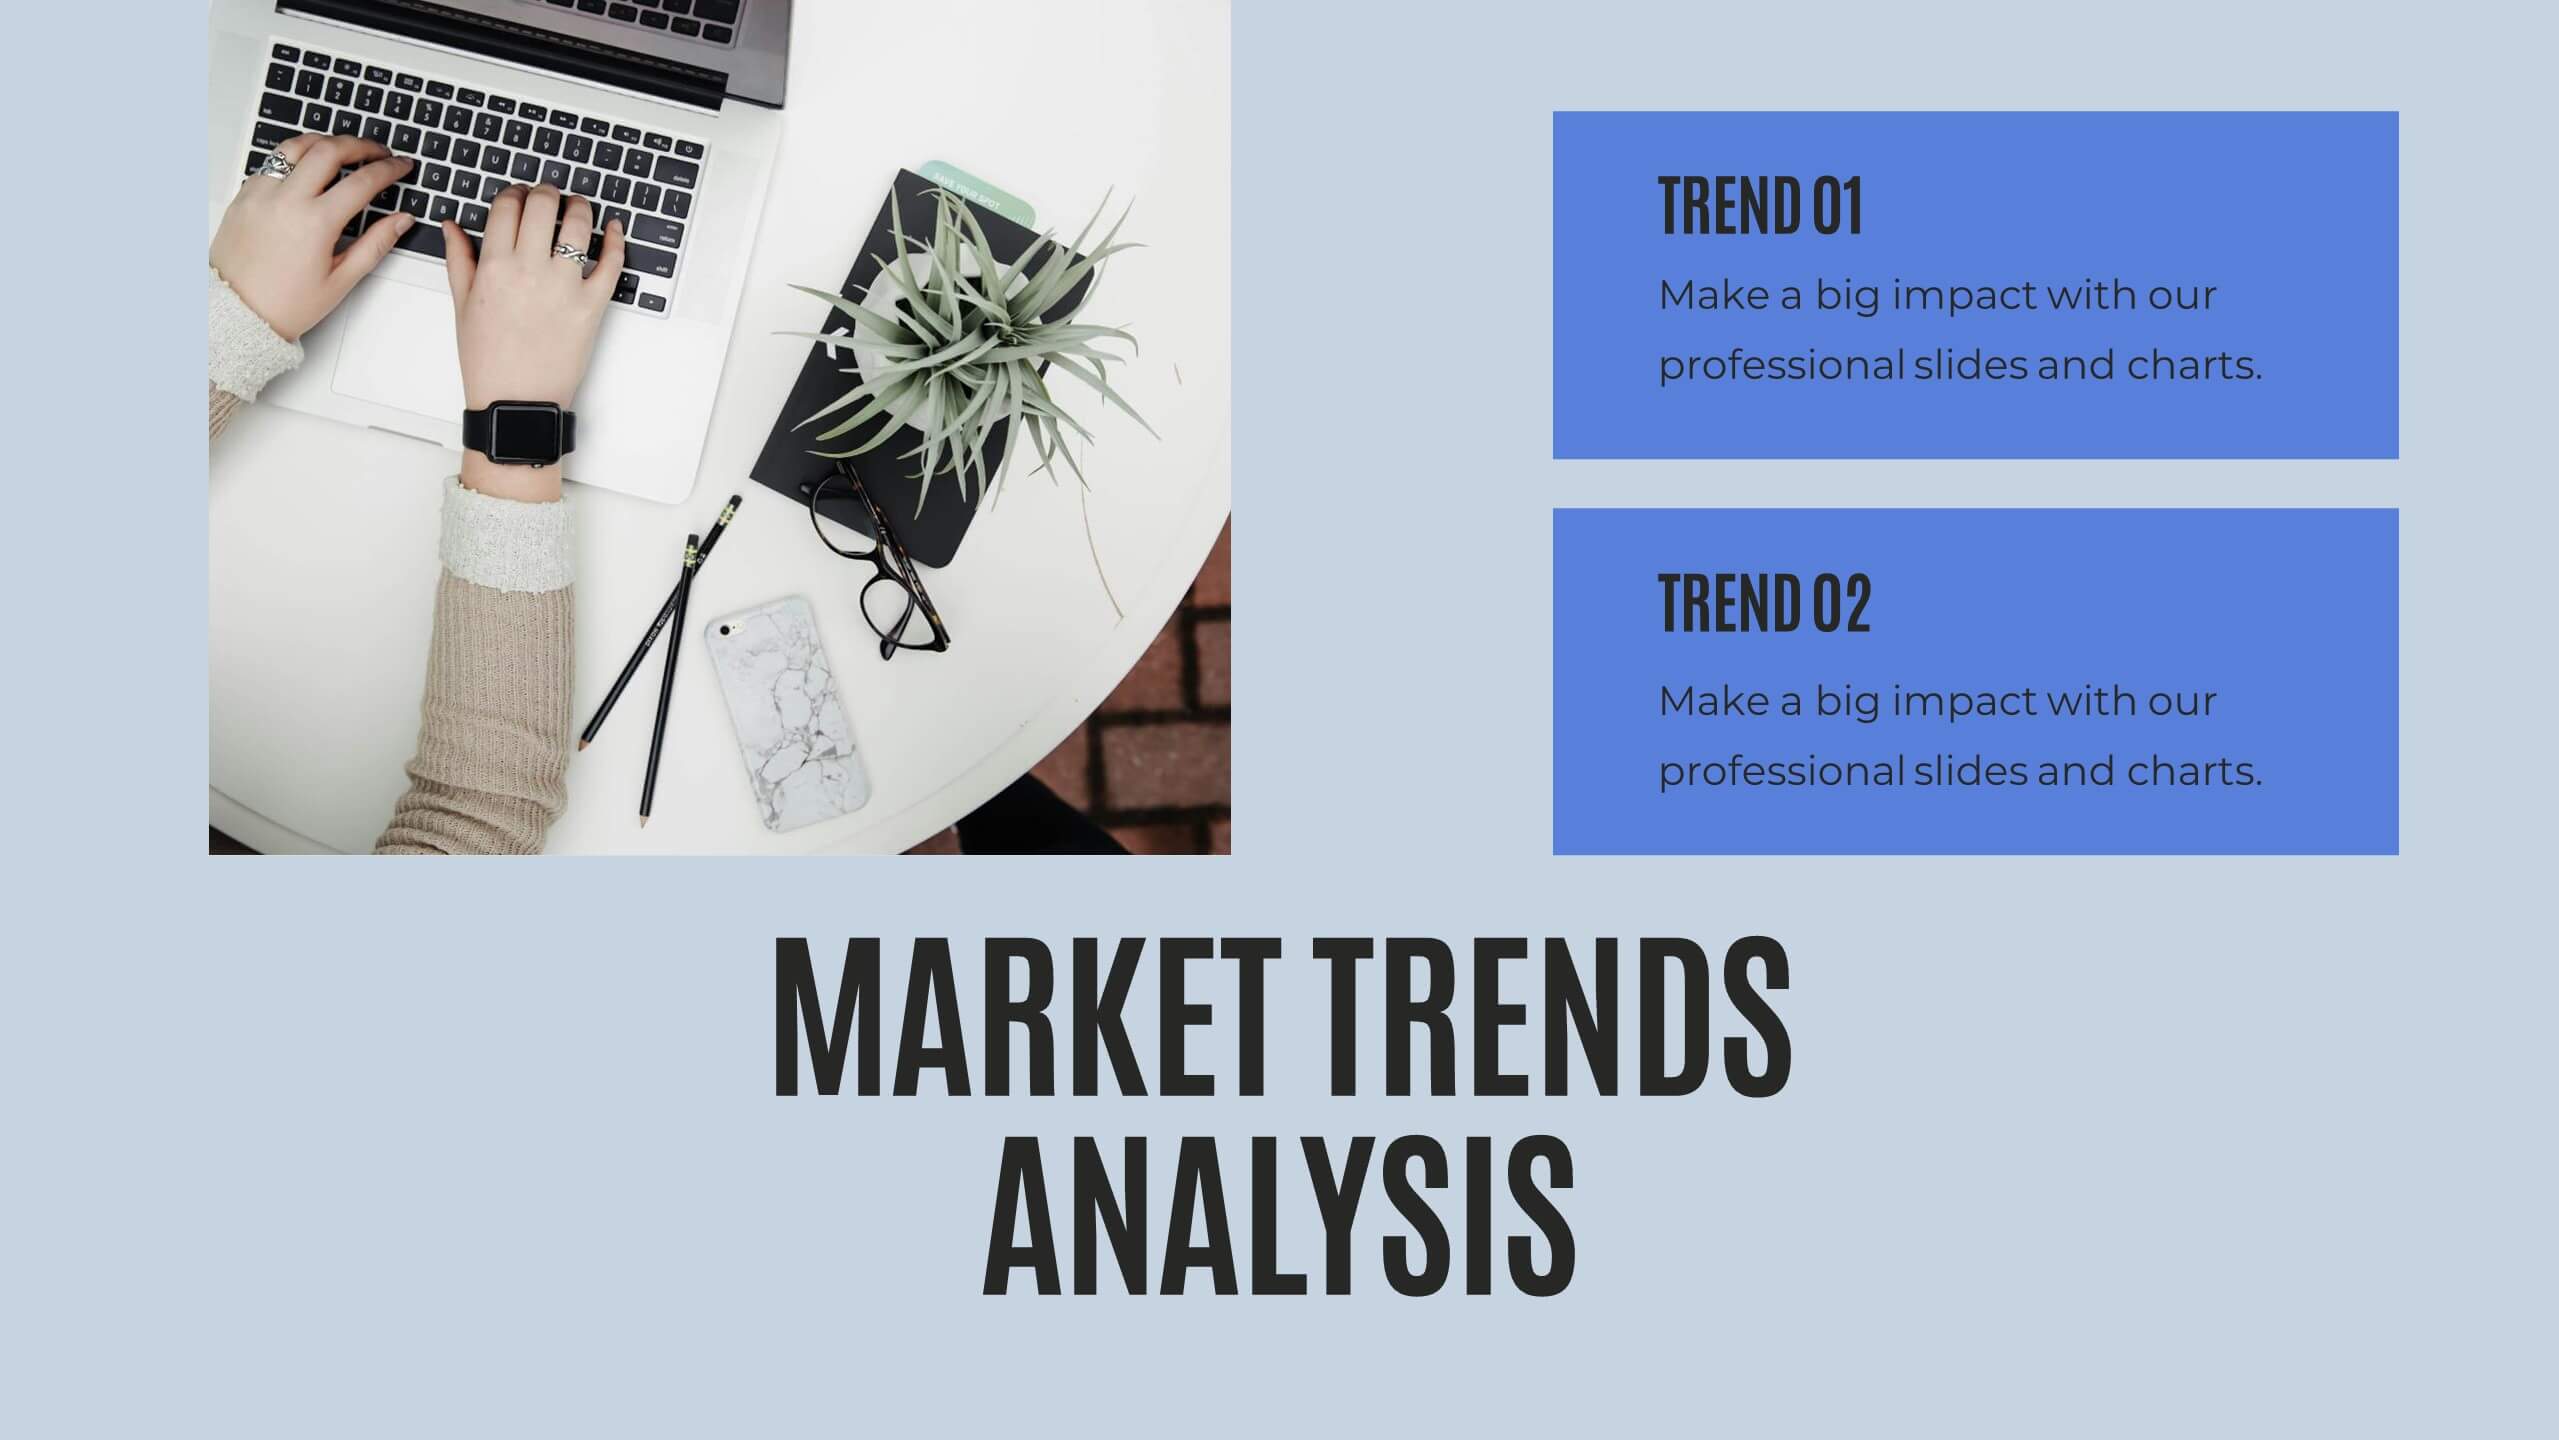
Quill Research Findings Report Presentation
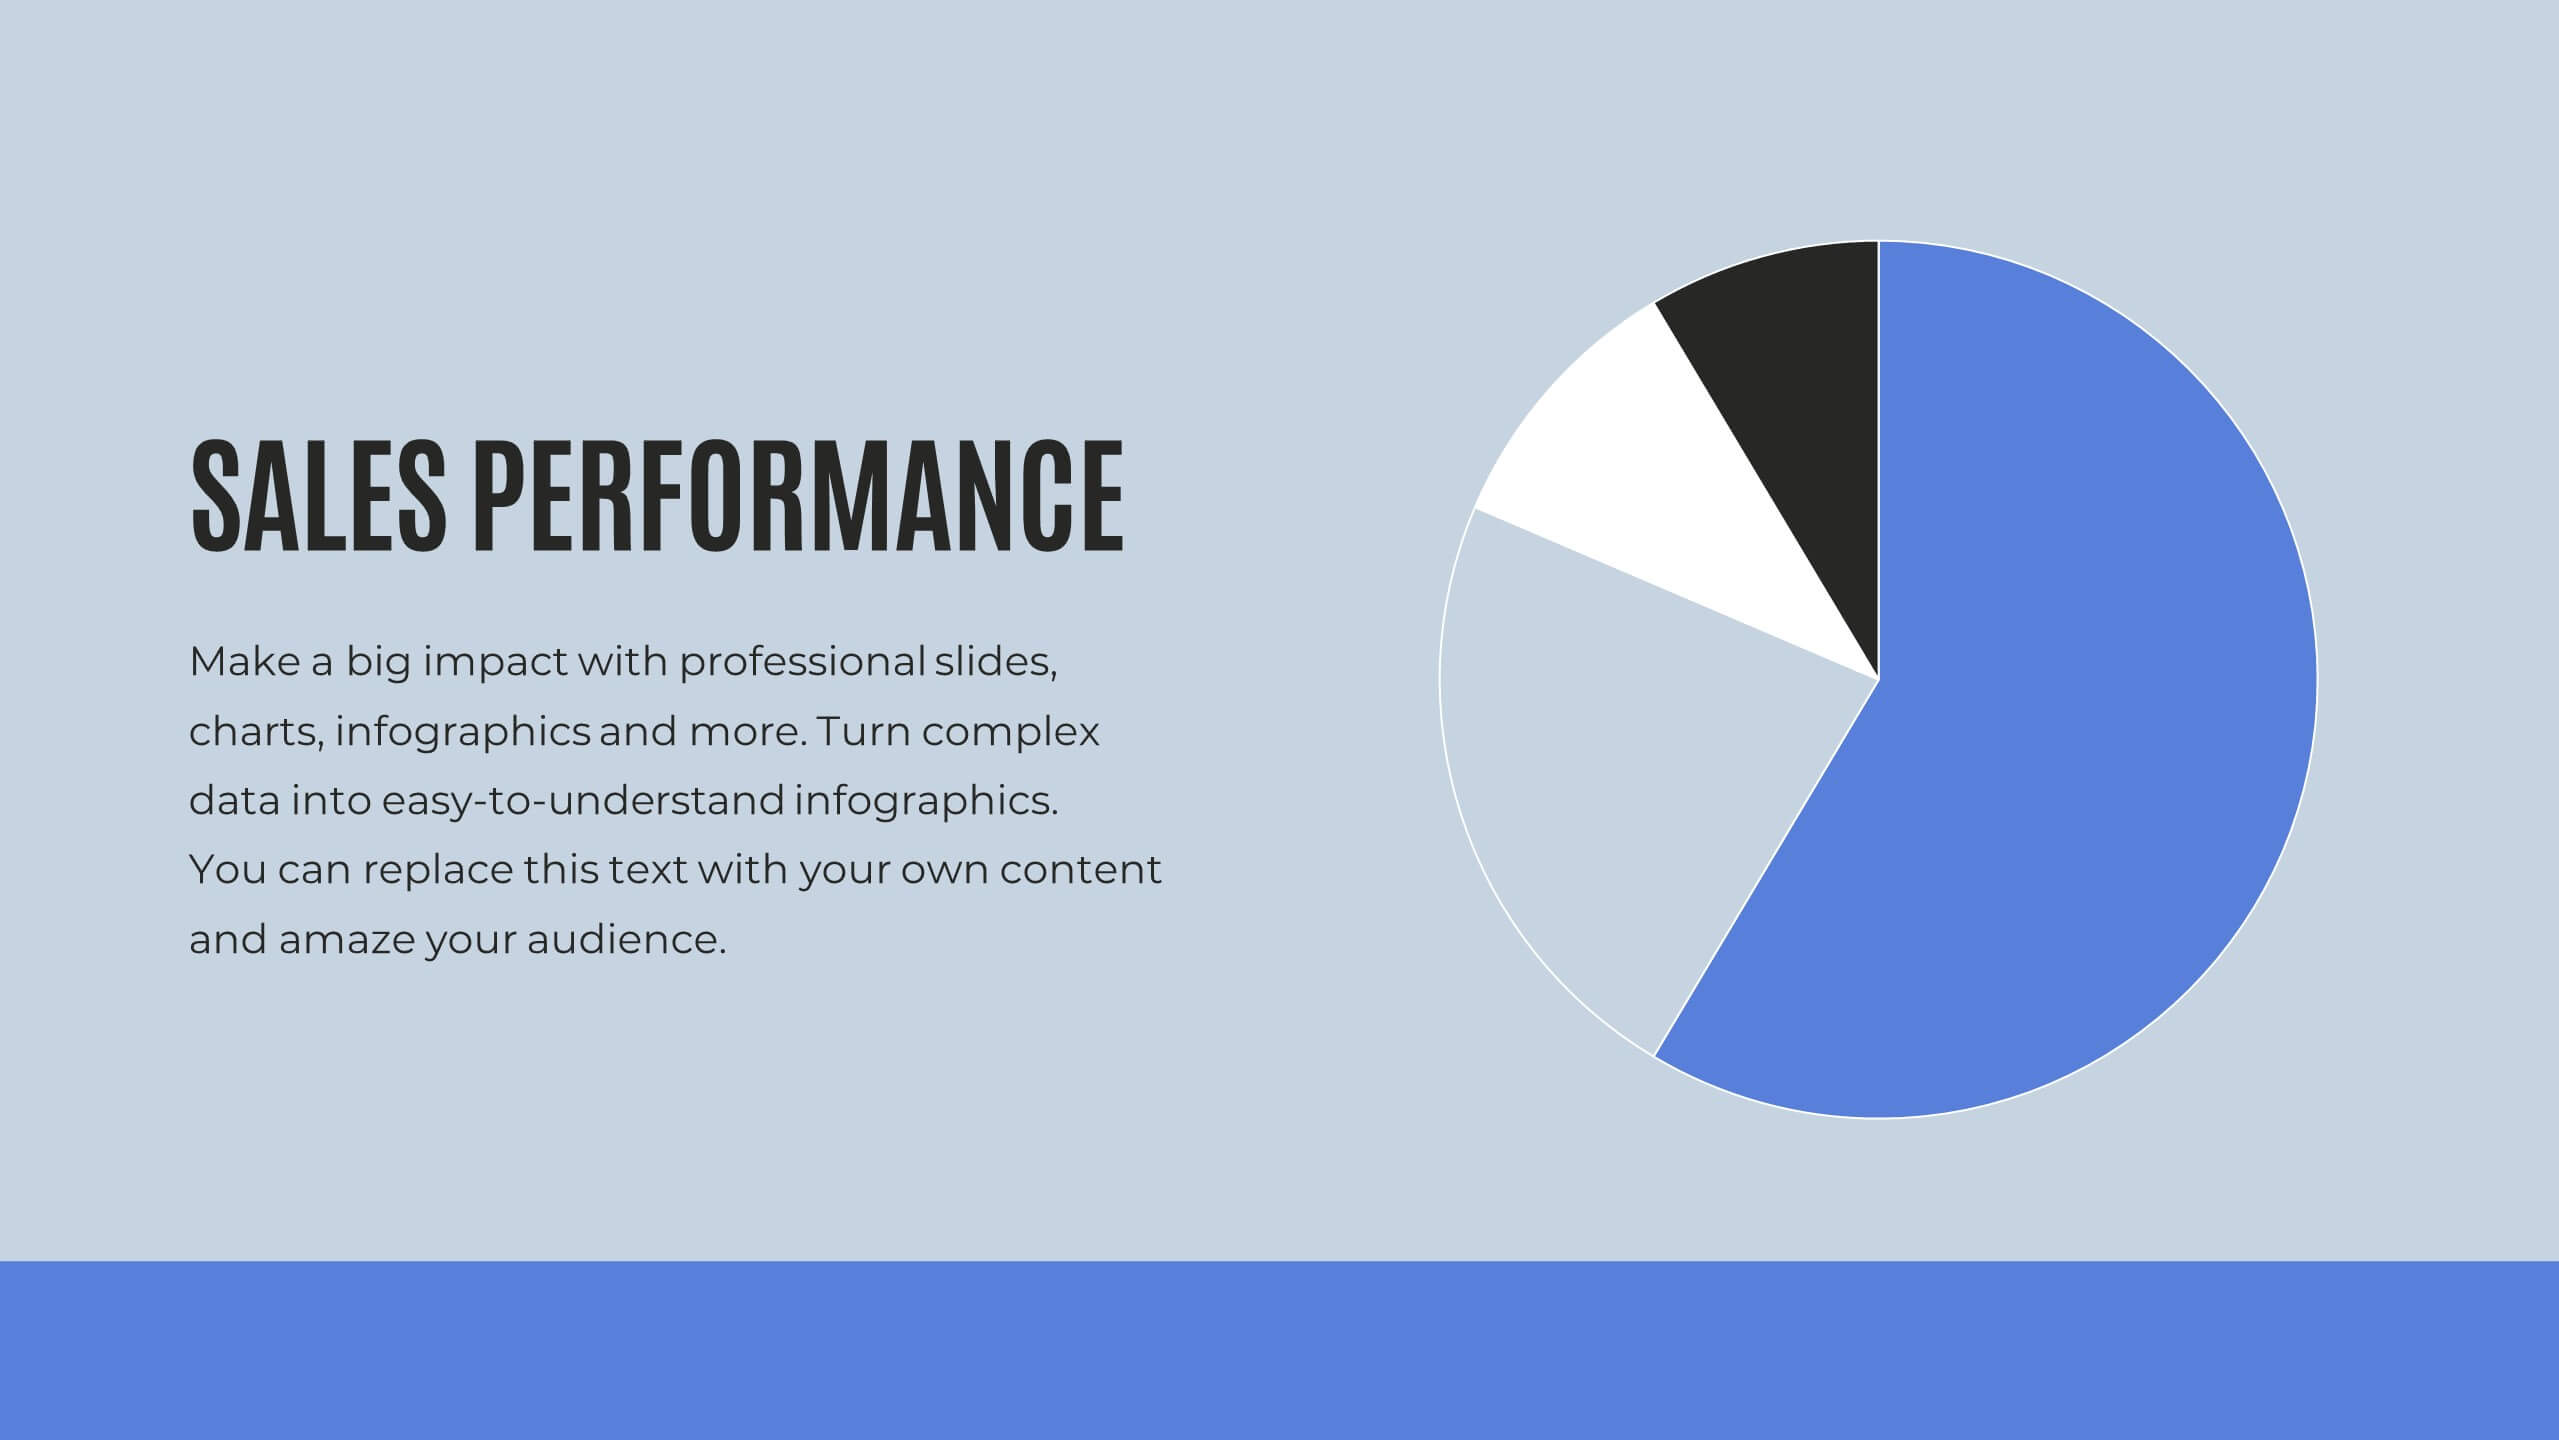
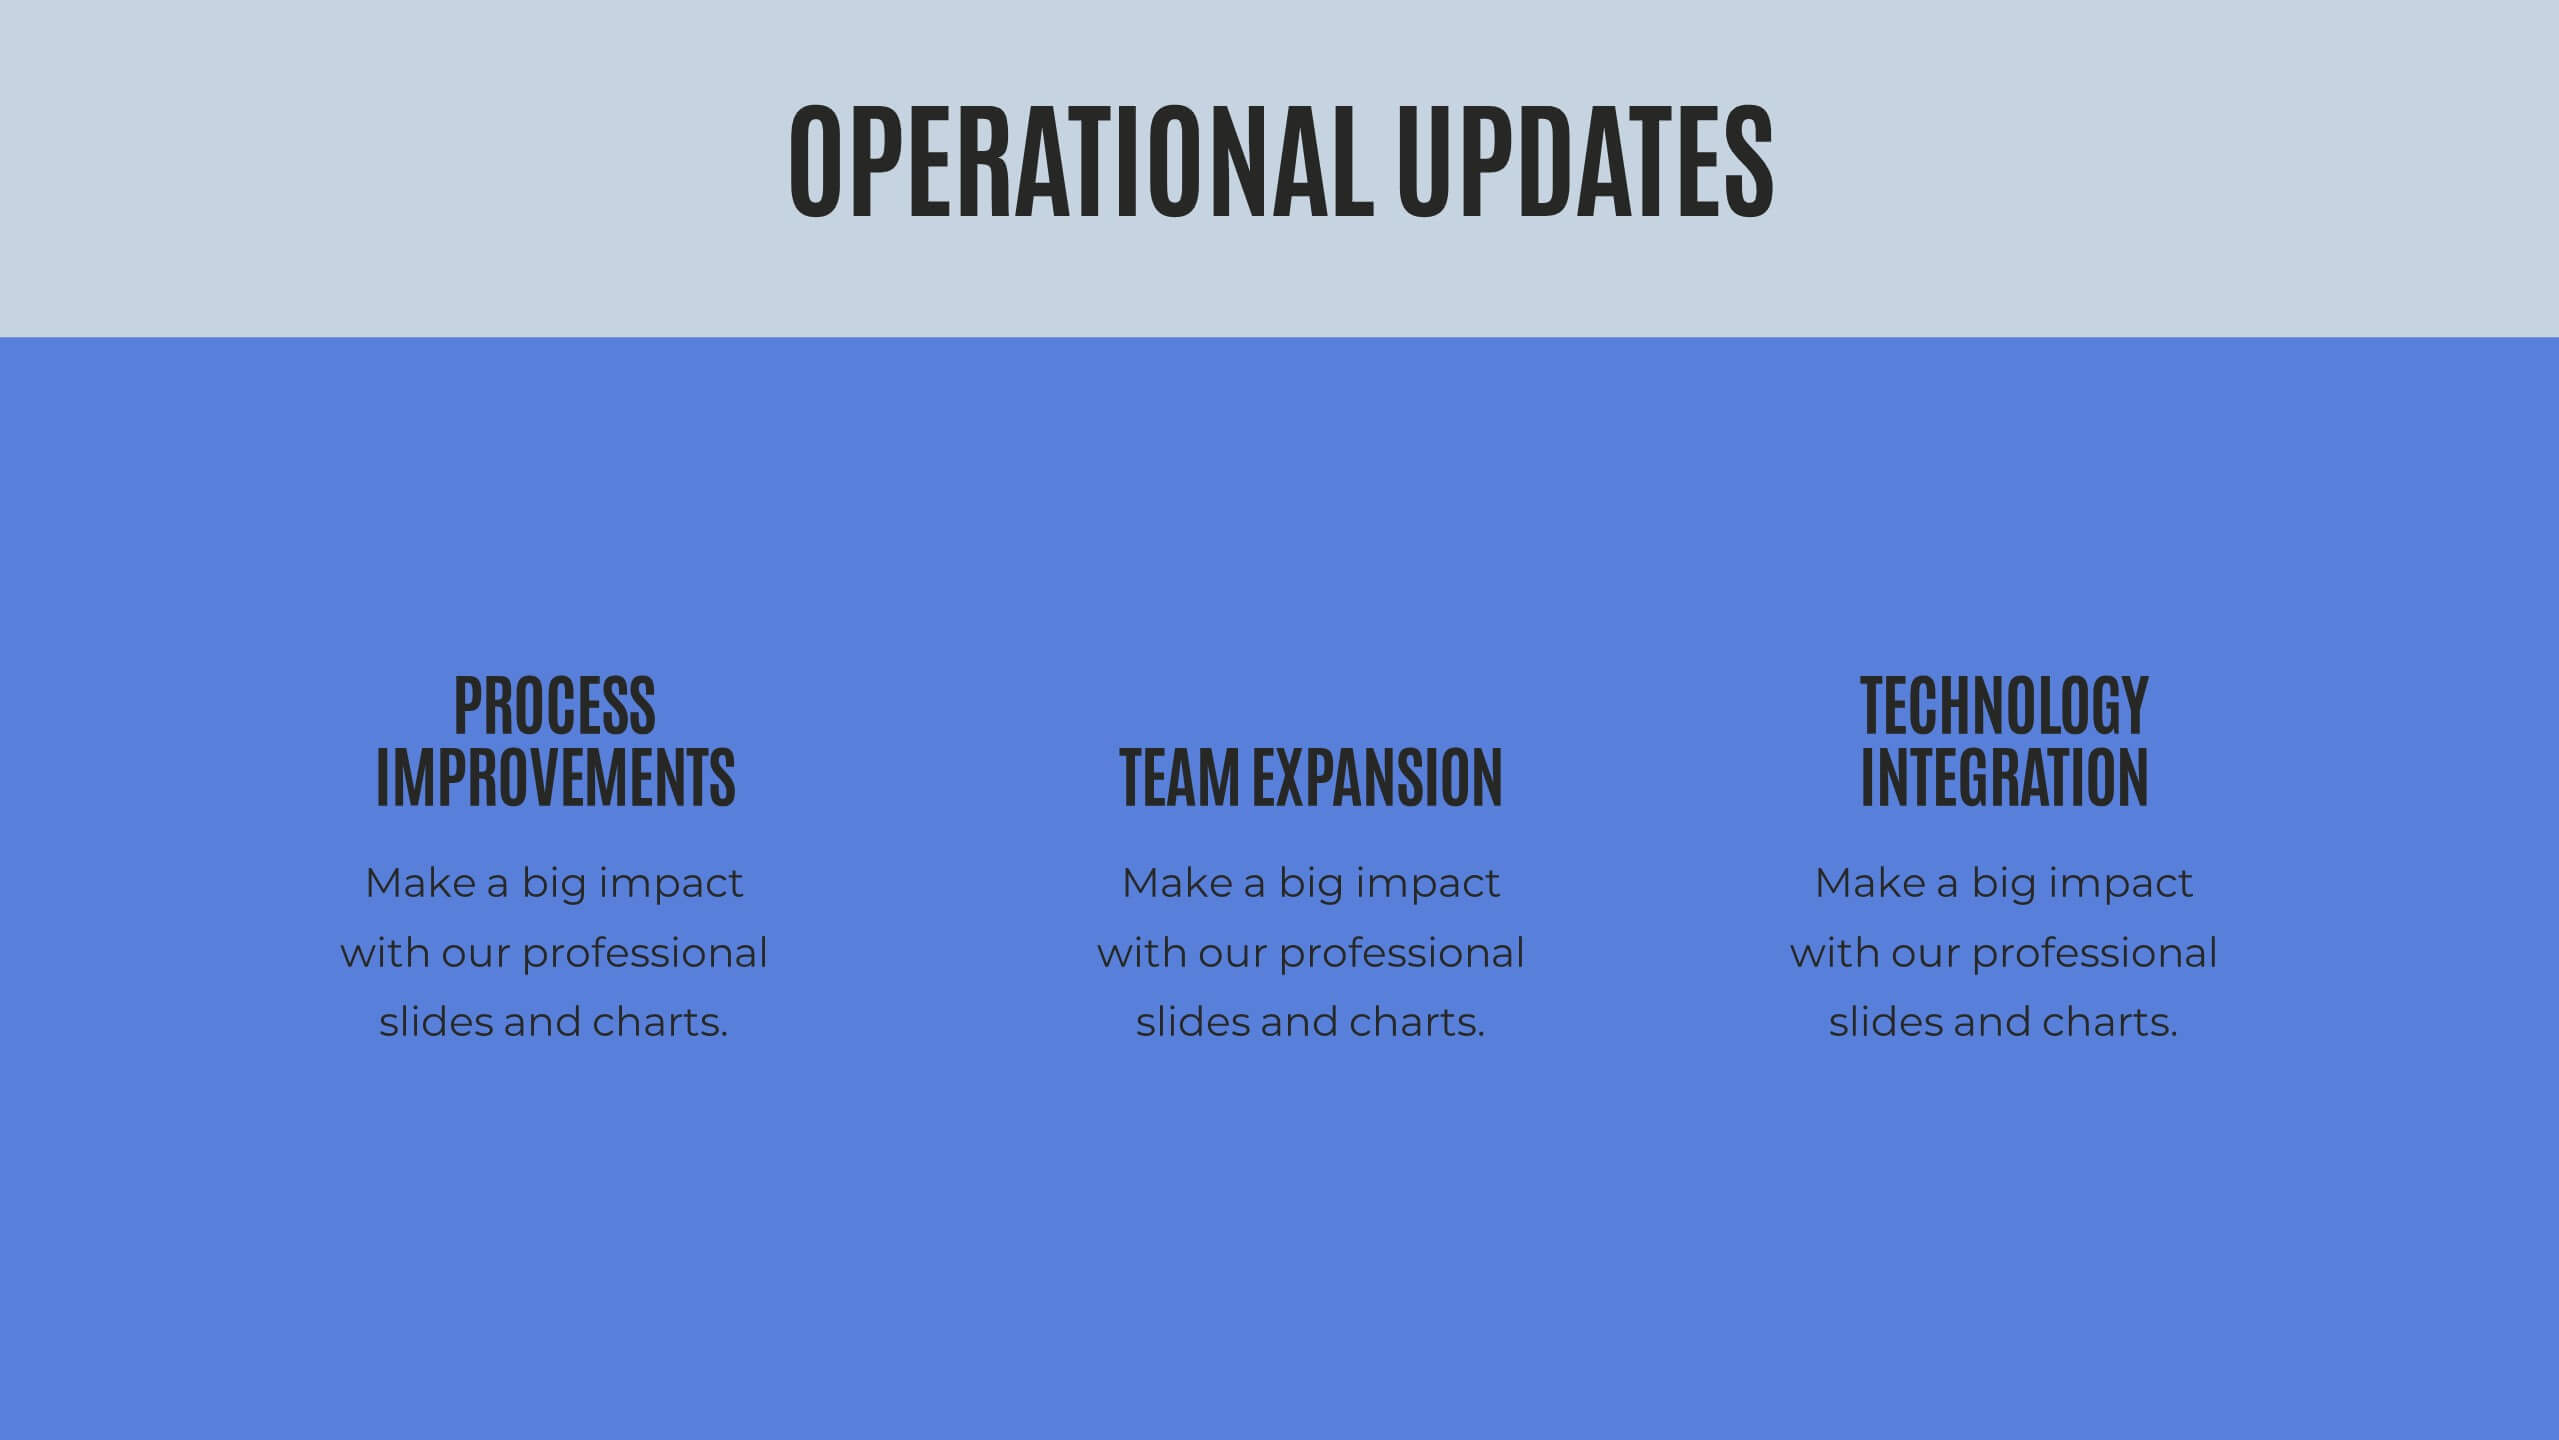
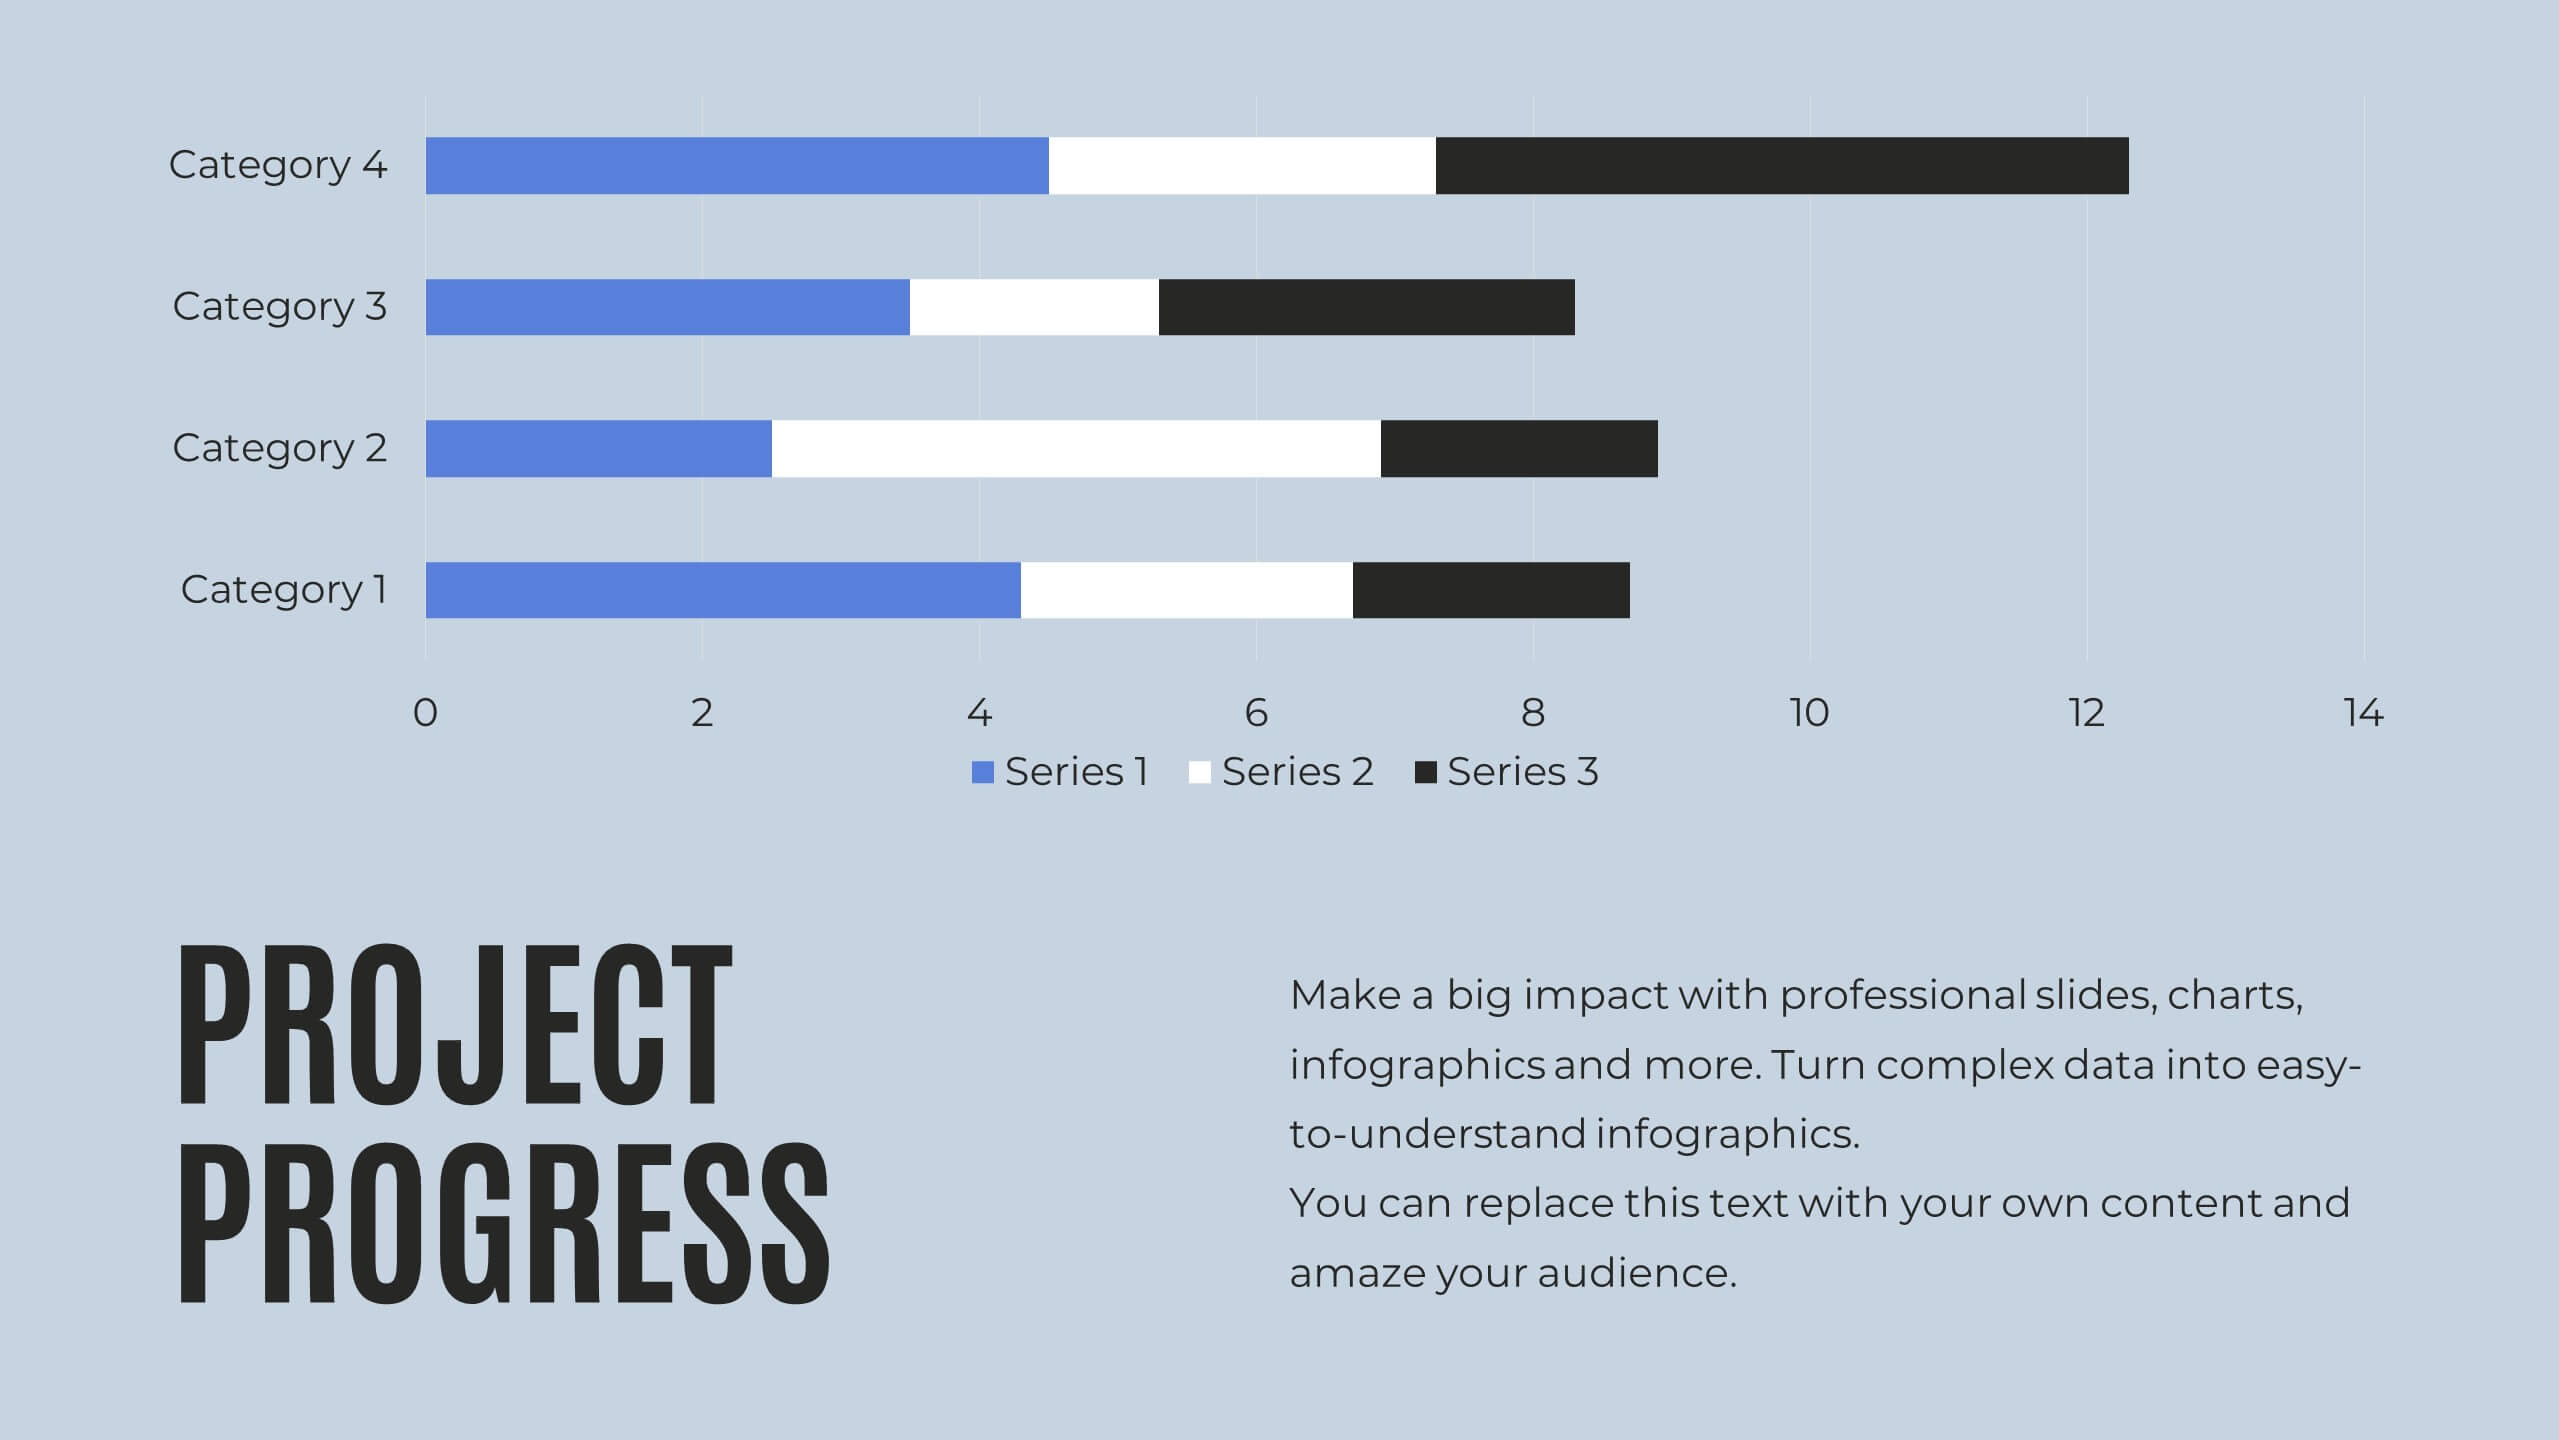
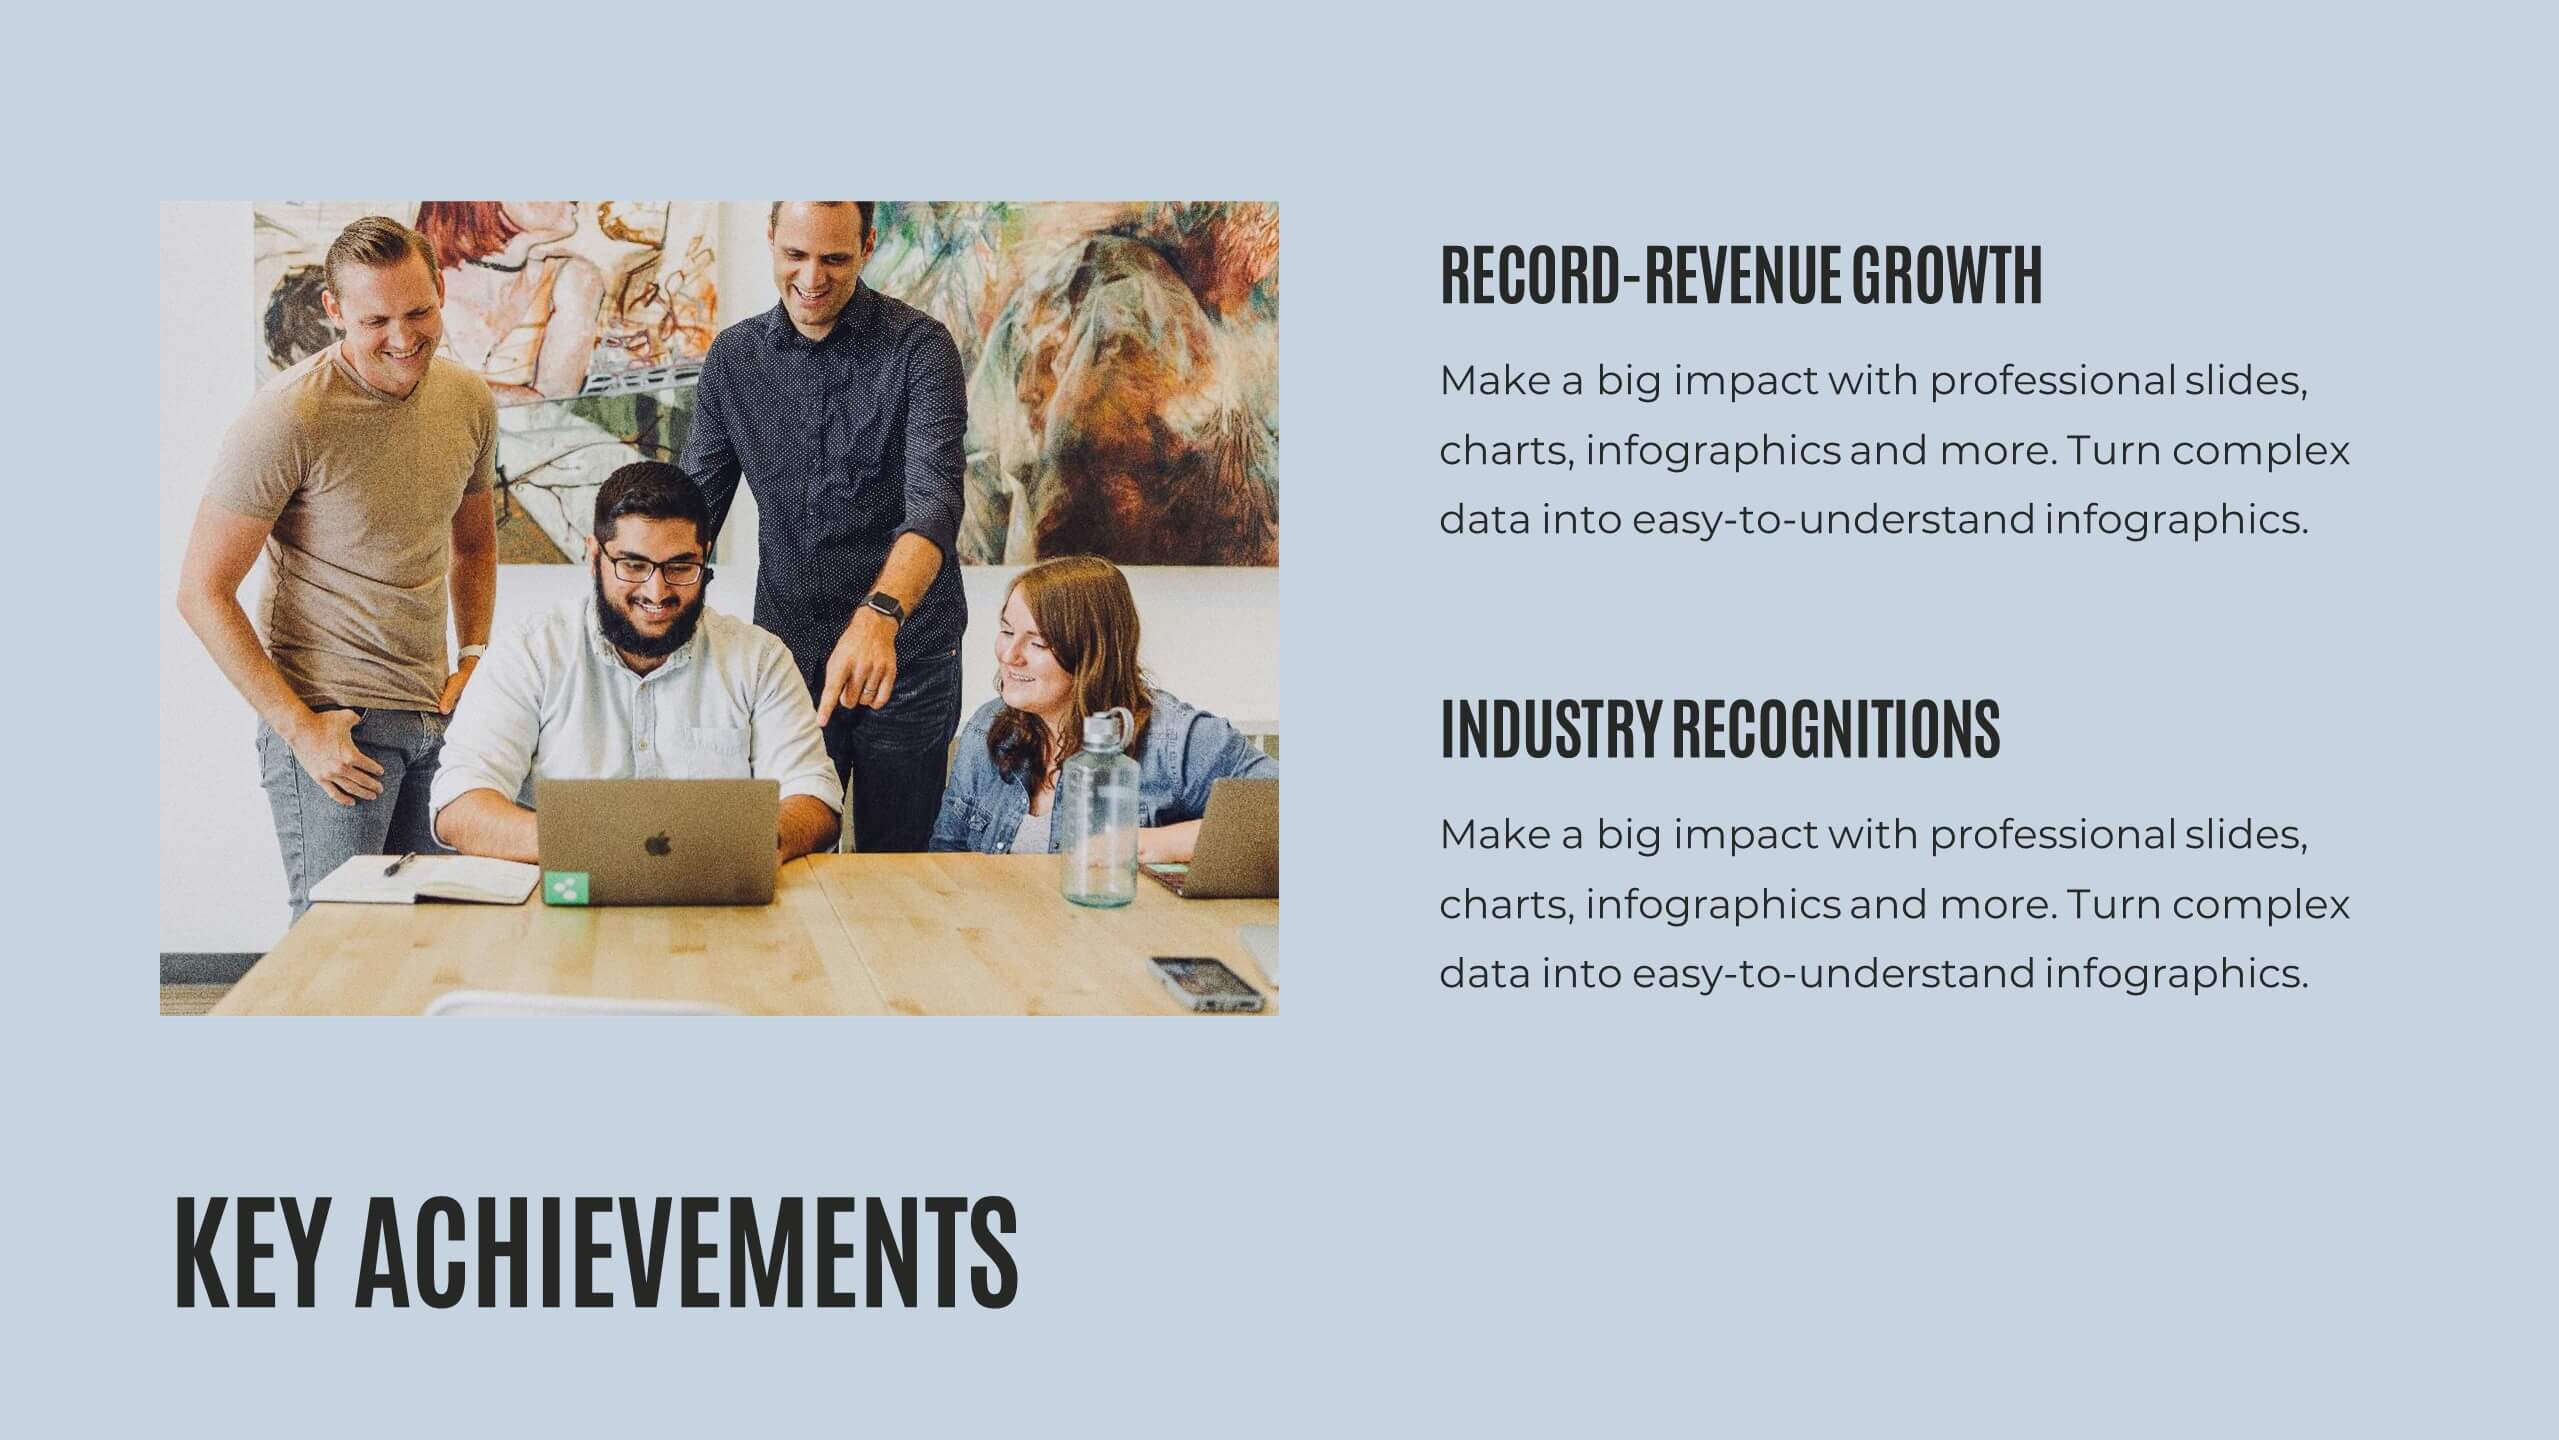
Illuminate your findings with this comprehensive research report template! Perfect for presenting key highlights, performance metrics, and financial summaries, it features professional slides for project progress, risk assessments, and market trends analysis. Engage your audience with clear visuals and detailed content. Compatible with PowerPoint, Keynote, and Google Slides for seamless presentations on any platform.


19 diapositivas
Zenith Sales Proposal Presentation
Get ready to blow your clients away with this electrifying sales proposal template! Packed with sections on project scope, bold objectives, timelines, and jaw-dropping pricing, it’s designed to make a powerful impact. The sleek, cutting-edge design ensures you’ll leave a lasting impression. Fully compatible with PowerPoint, Keynote, and Google Slides!


4 diapositivas
Medical Theme Slides for Healthcare Presentation
Bring clarity and care to your data storytelling with this modern healthcare-themed presentation. Designed for hospitals, clinics, or medical professionals, it helps you present health data, research findings, and patient care insights with professionalism and trust. Fully customizable and compatible with PowerPoint, Keynote, and Google Slides for seamless editing.


7 diapositivas
Target Market Segmentation Infographic Presentation
A Target Market refers to a specific group of customers or consumers that a company or organization aims to sell its products or services too. This template has a design that can compliment your company's or organization's branding elements to make it a professional looking presentation. This template is perfect for the audience with in-depth knowledge of marketing; the template allows you to include important facts and statistics that will make it easily understandable by all types of audiences. The template comes with different chart slides, nice color combinations and graphs!


7 diapositivas
Rotational Process Flow in Wheel Layout Presentation
Showcase continuous workflows, lifecycle stages, or strategic loops with the Rotational Process Flow in Wheel Layout Presentation. This visually engaging circular diagram breaks down processes into six distinct segments, each with editable icons, colors, and titles—ideal for marketing funnels, product development stages, or team cycles. Fully compatible with PowerPoint, Keynote, and Google Slides.


6 diapositivas
Root Cause Investigation Framework Presentation
Uncover the "why" behind your challenges with the Root Cause Investigation Framework Presentation. Designed around the classic fishbone (Ishikawa) diagram, this slide helps teams visually identify and organize contributing factors across multiple categories. With editable sections and bold color coding, it’s ideal for quality management, Six Sigma, and process improvement. Compatible with PowerPoint, Keynote, and Google Slides.


6 diapositivas
Big Data Insights Visual Presentation
Transform complex analytics into clear, engaging visuals that tell a compelling story. This modern layout is perfect for showcasing data connections, performance metrics, and analytical insights in a visually balanced way. Fully editable and compatible with PowerPoint, Keynote, and Google Slides for seamless customization and professional presentations.


4 diapositivas
Productivity and Task Prioritization Presentation
Streamline efficiency with structured task prioritization using this Productivity and Task Prioritization template. Designed with rating indicators, pie charts, and color-coded sections, this slide helps visualize task importance, workload distribution, and performance evaluations. Ideal for team leaders, project managers, and business strategists, this template is fully customizable and compatible with PowerPoint, Keynote, and Google Slides.


5 diapositivas
Relationship Mapping Diagram Presentation
Bring clarity to complex connections with this clean and modern visual layout designed to map relationships, processes, or ideas effortlessly. Perfect for presentations that require structure and flow, it balances simplicity with professionalism. Fully customizable and compatible with PowerPoint, Keynote, and Google Slides for seamless design flexibility.


23 diapositivas
Aegean UX Strategy Plan Presentation
The Aegean UX Strategy template is a vibrant and modern presentation tool designed for UX/UI designers, project managers, and creative teams. Its gradient pink and orange color scheme creates a visually appealing backdrop for discussing complex design strategies. This template includes slides for every step of the UX process, from defining user personas and journey maps to detailing wireframes, prototyping, and user testing. It also covers critical aspects like branding guidelines, accessibility, and usability, ensuring that your design considerations are comprehensive. Ideal for presenting design projects, strategies, or user experience audits, this template is fully compatible with PowerPoint, Keynote, and Google Slides, allowing for easy customization and seamless presentations across platforms. Use the Aegean UX Strategy template to convey your design vision clearly and compellingly, engaging your audience with a blend of style and substance.