Search results for infographic
Browse 4033 templates


6 slides
Creative Alphabetic Infographic
Bring your message to life with a bright, alphabet-inspired layout that turns simple letters into eye-catching storytelling elements. This presentation is perfect for organizing steps, categories, or key ideas in a memorable way while keeping everything clear and structured. Fully editable and compatible with PowerPoint, Keynote, and Google Slides.


21 slides
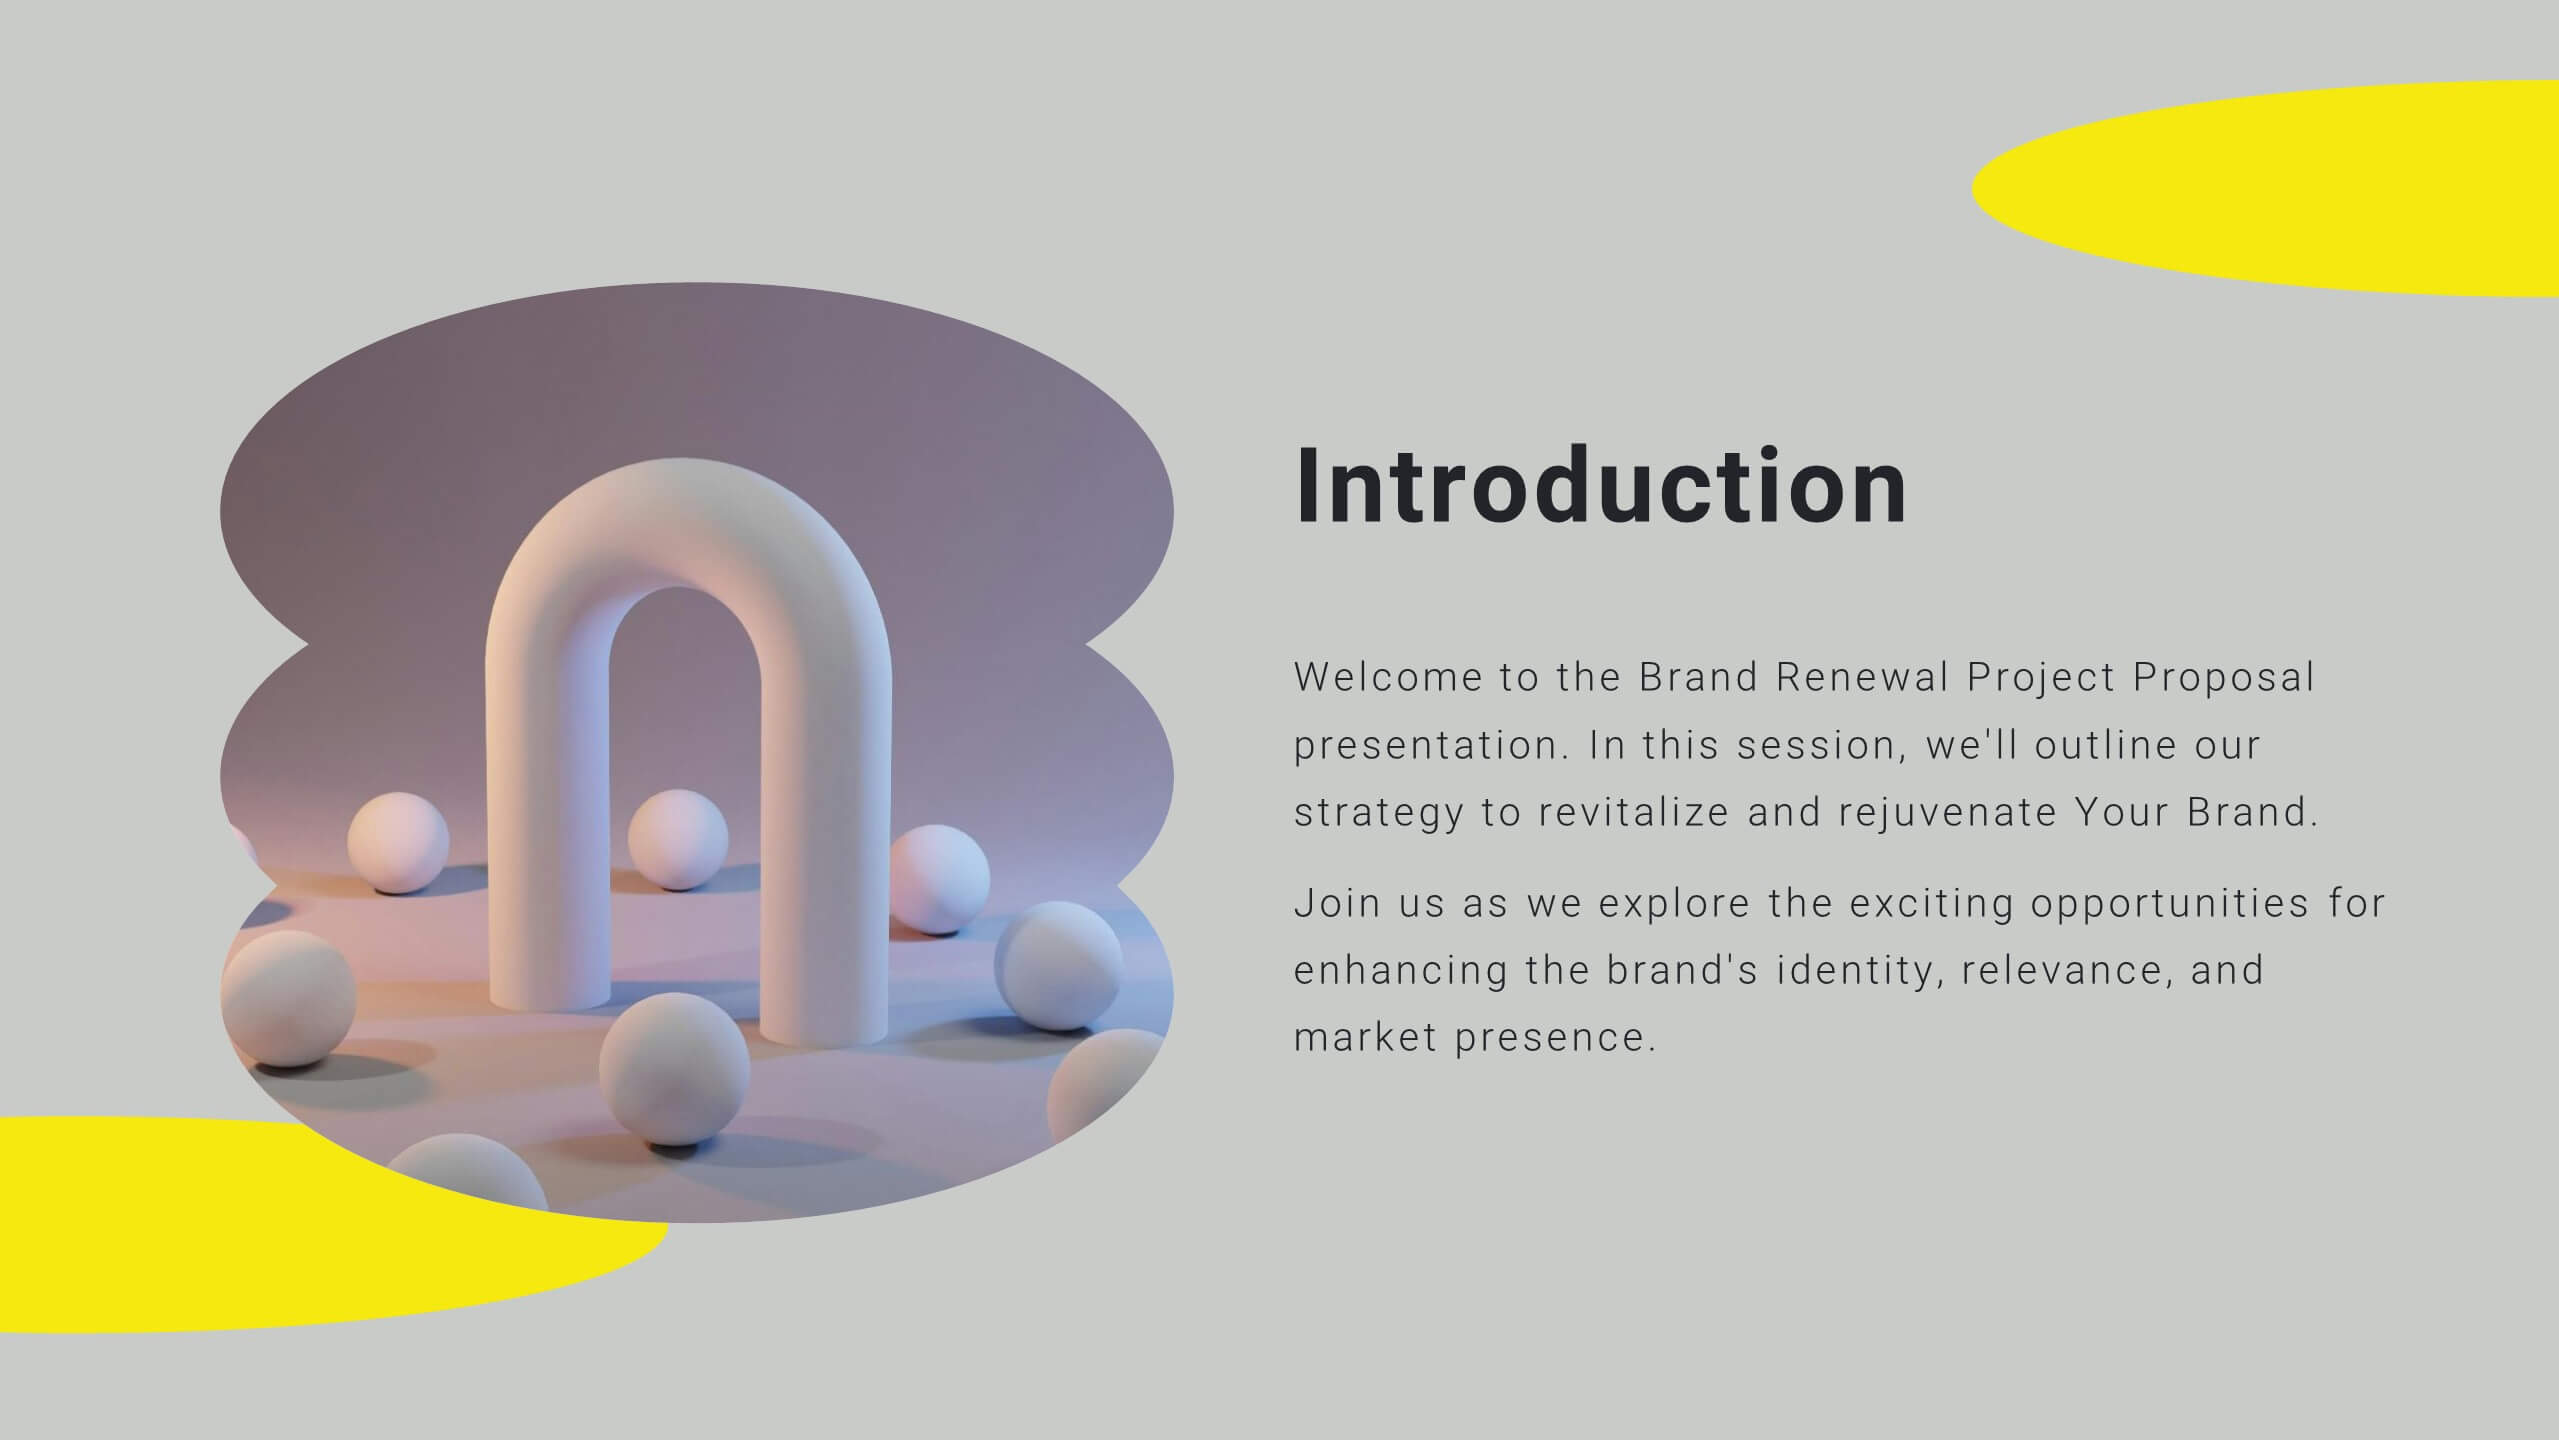
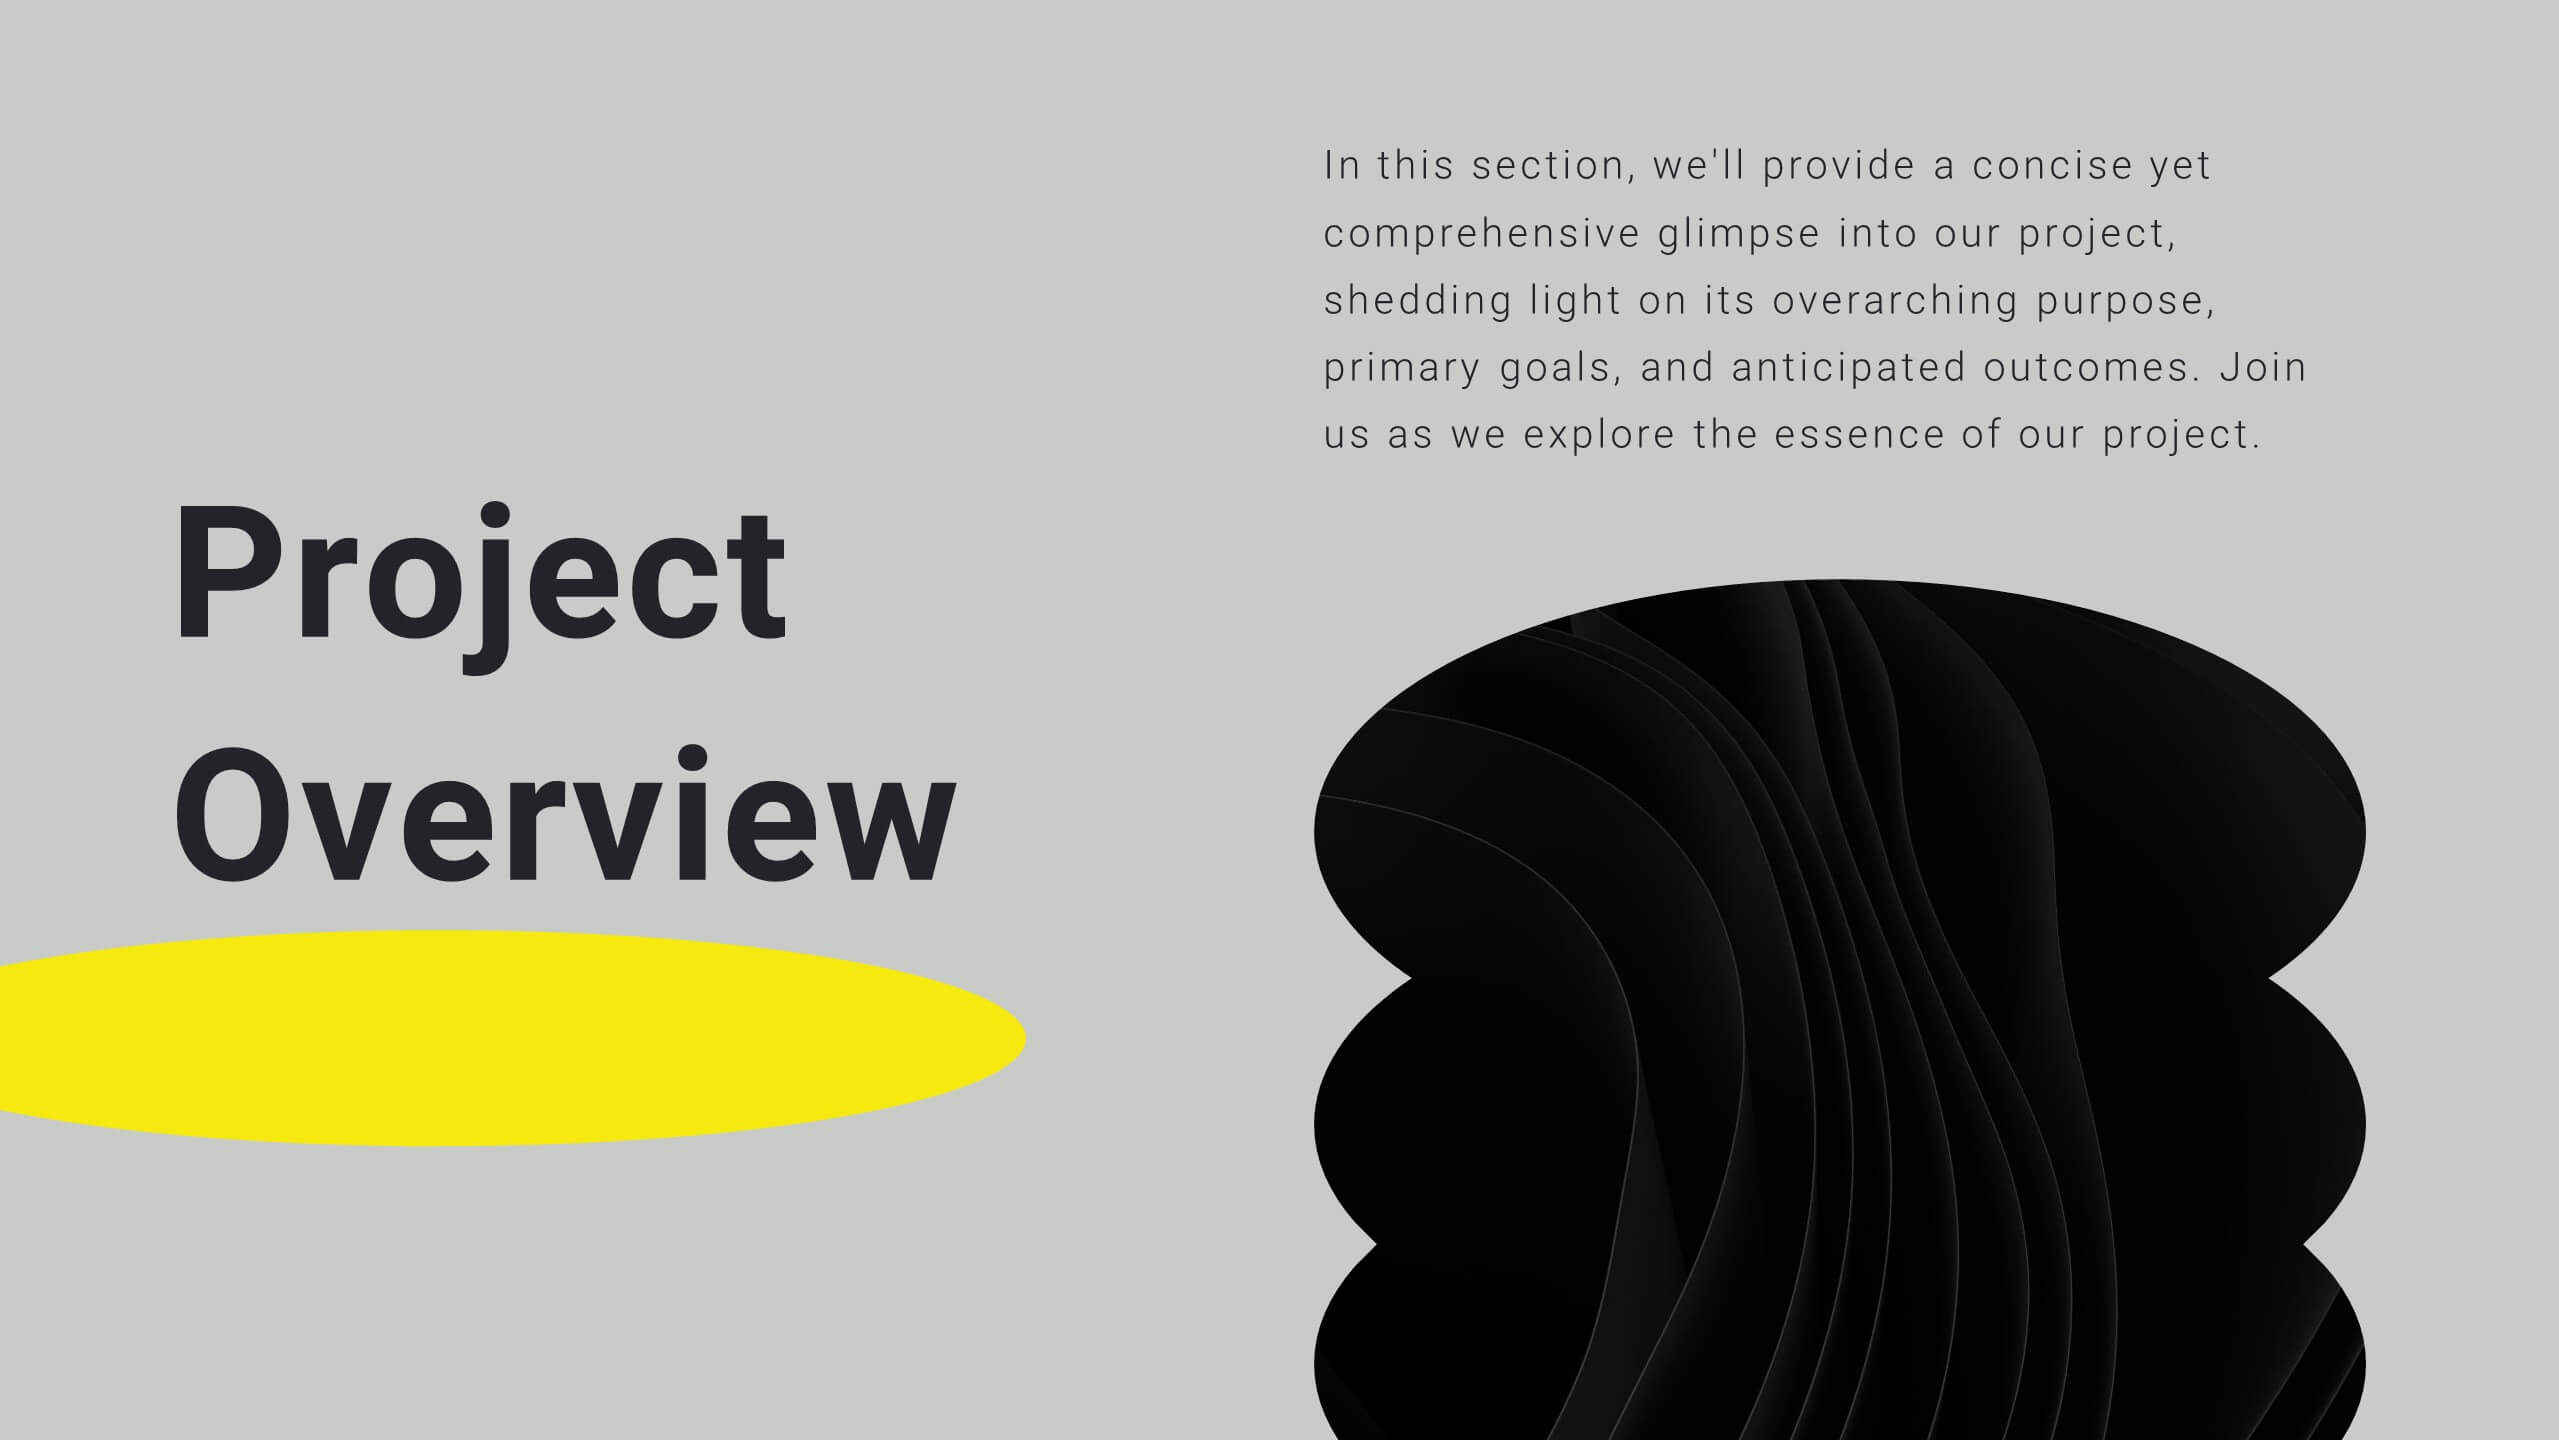
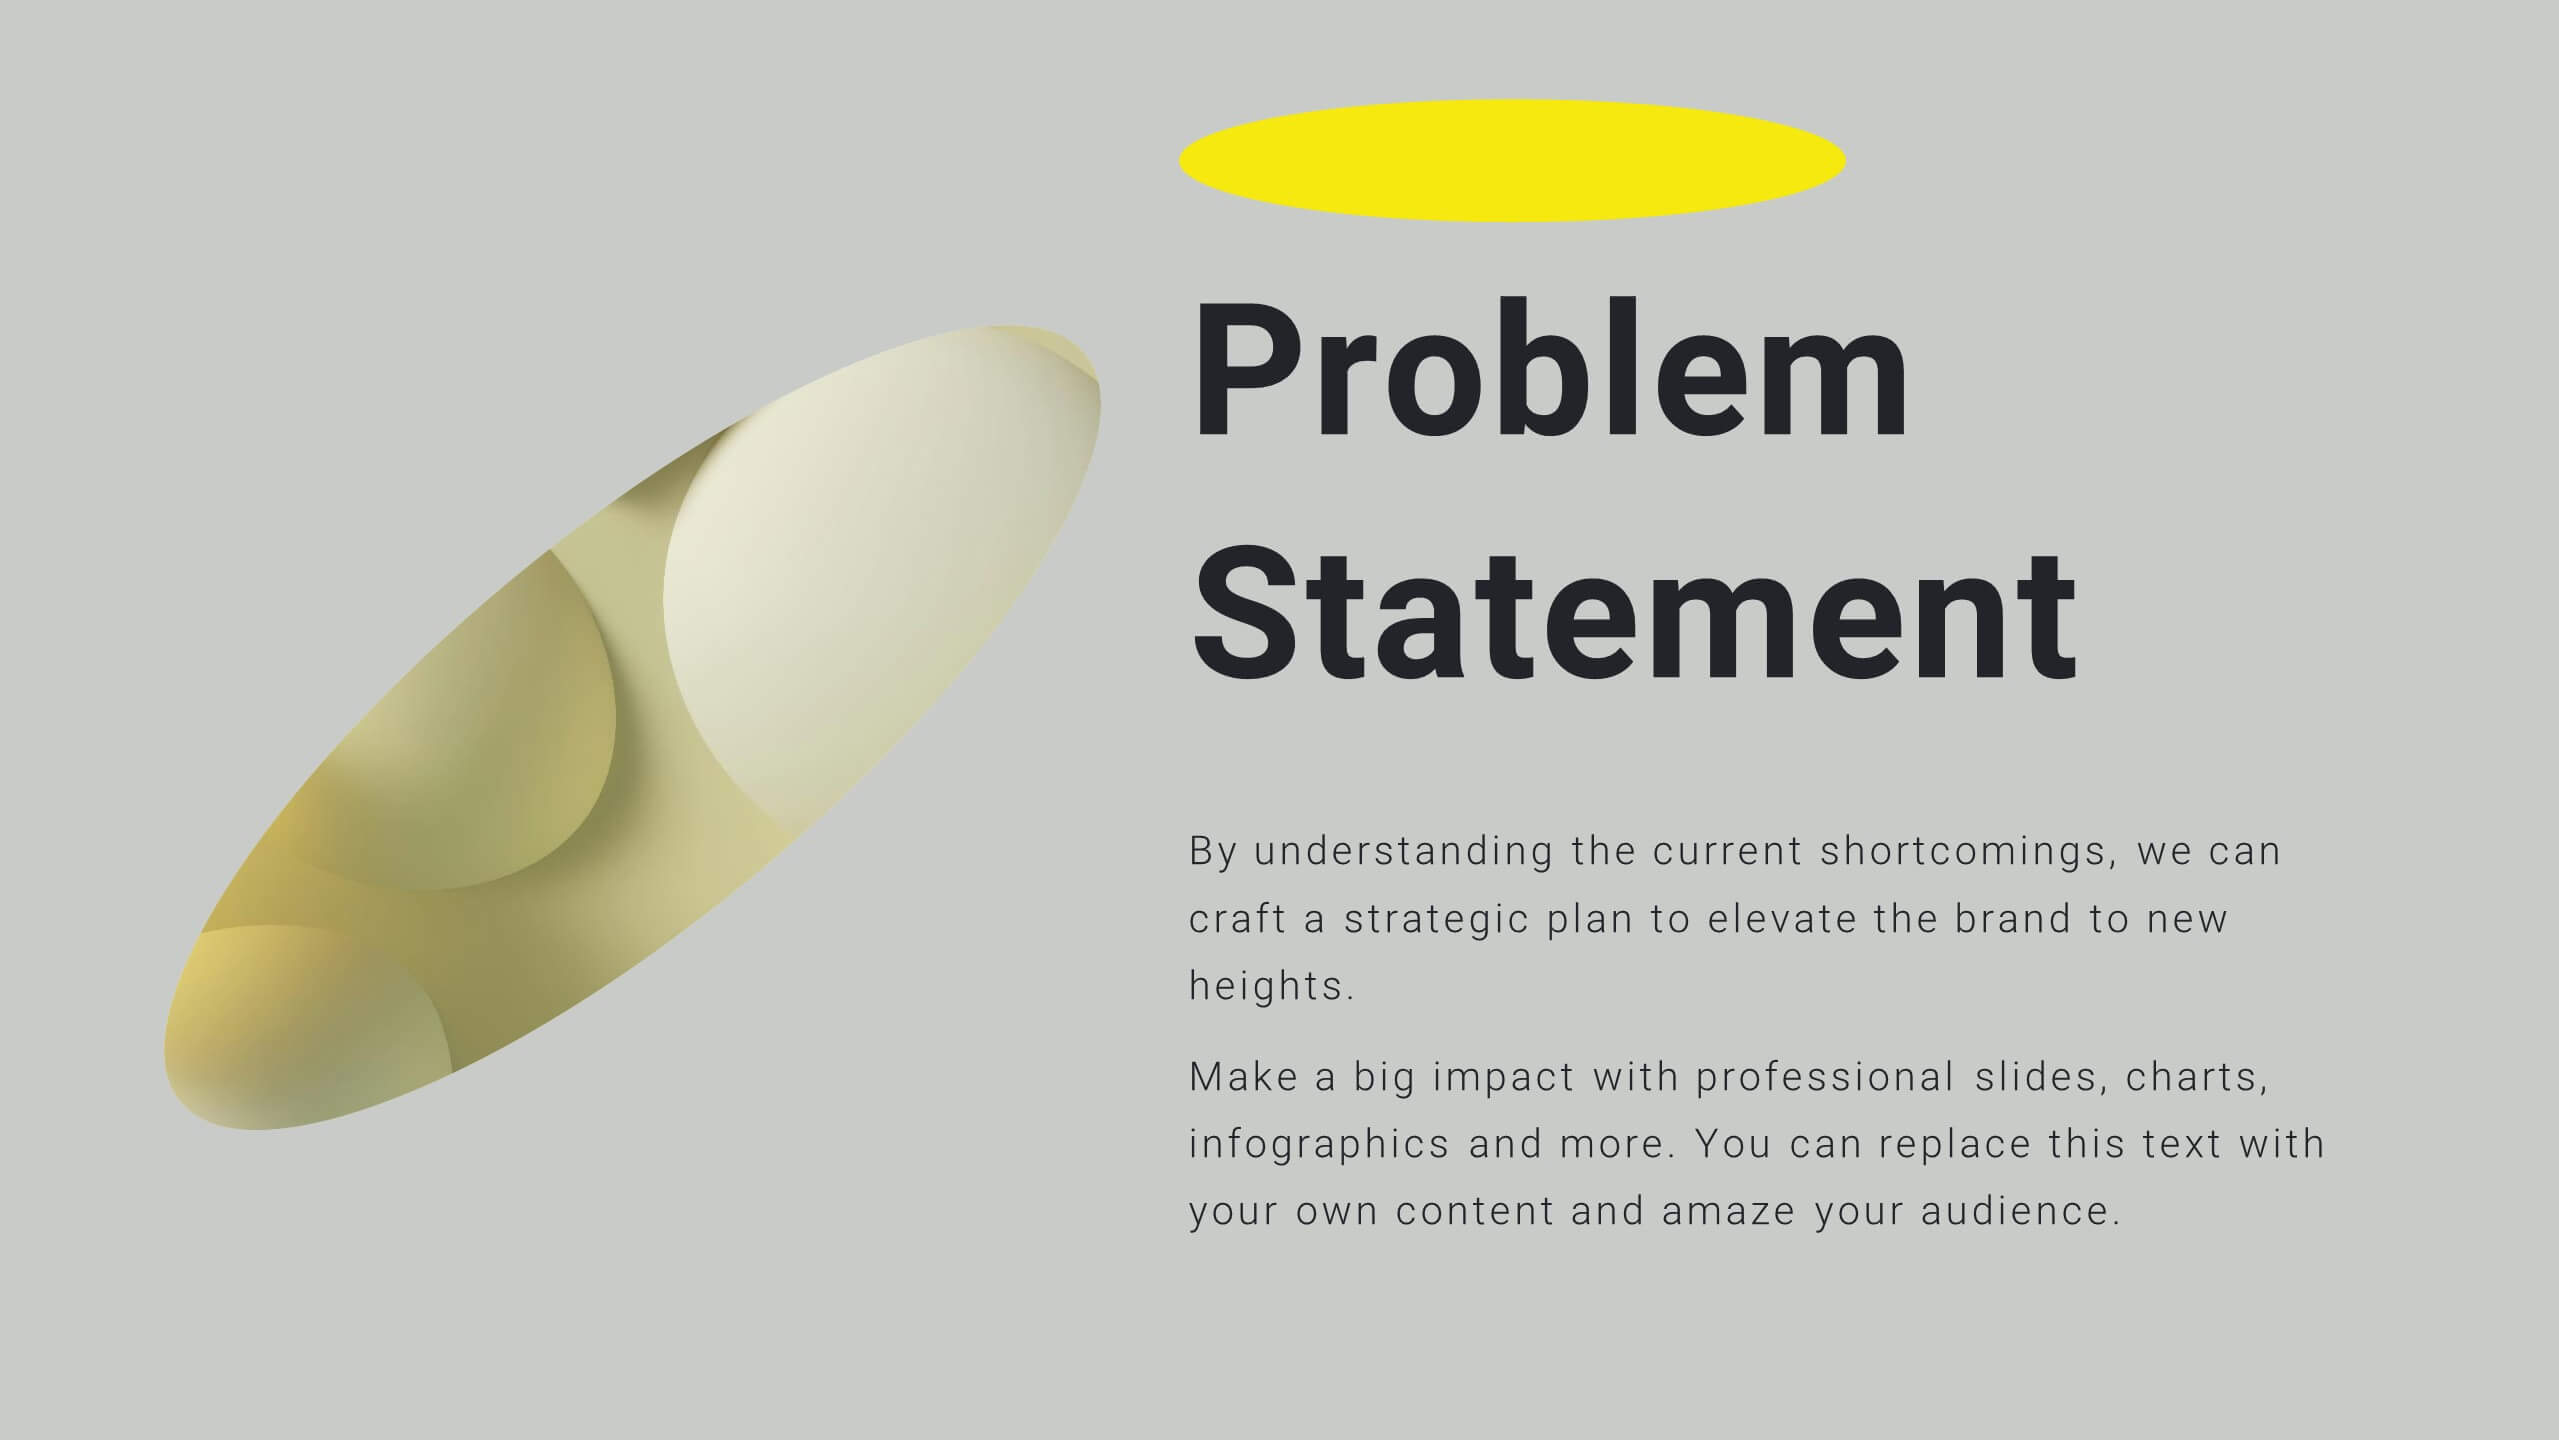
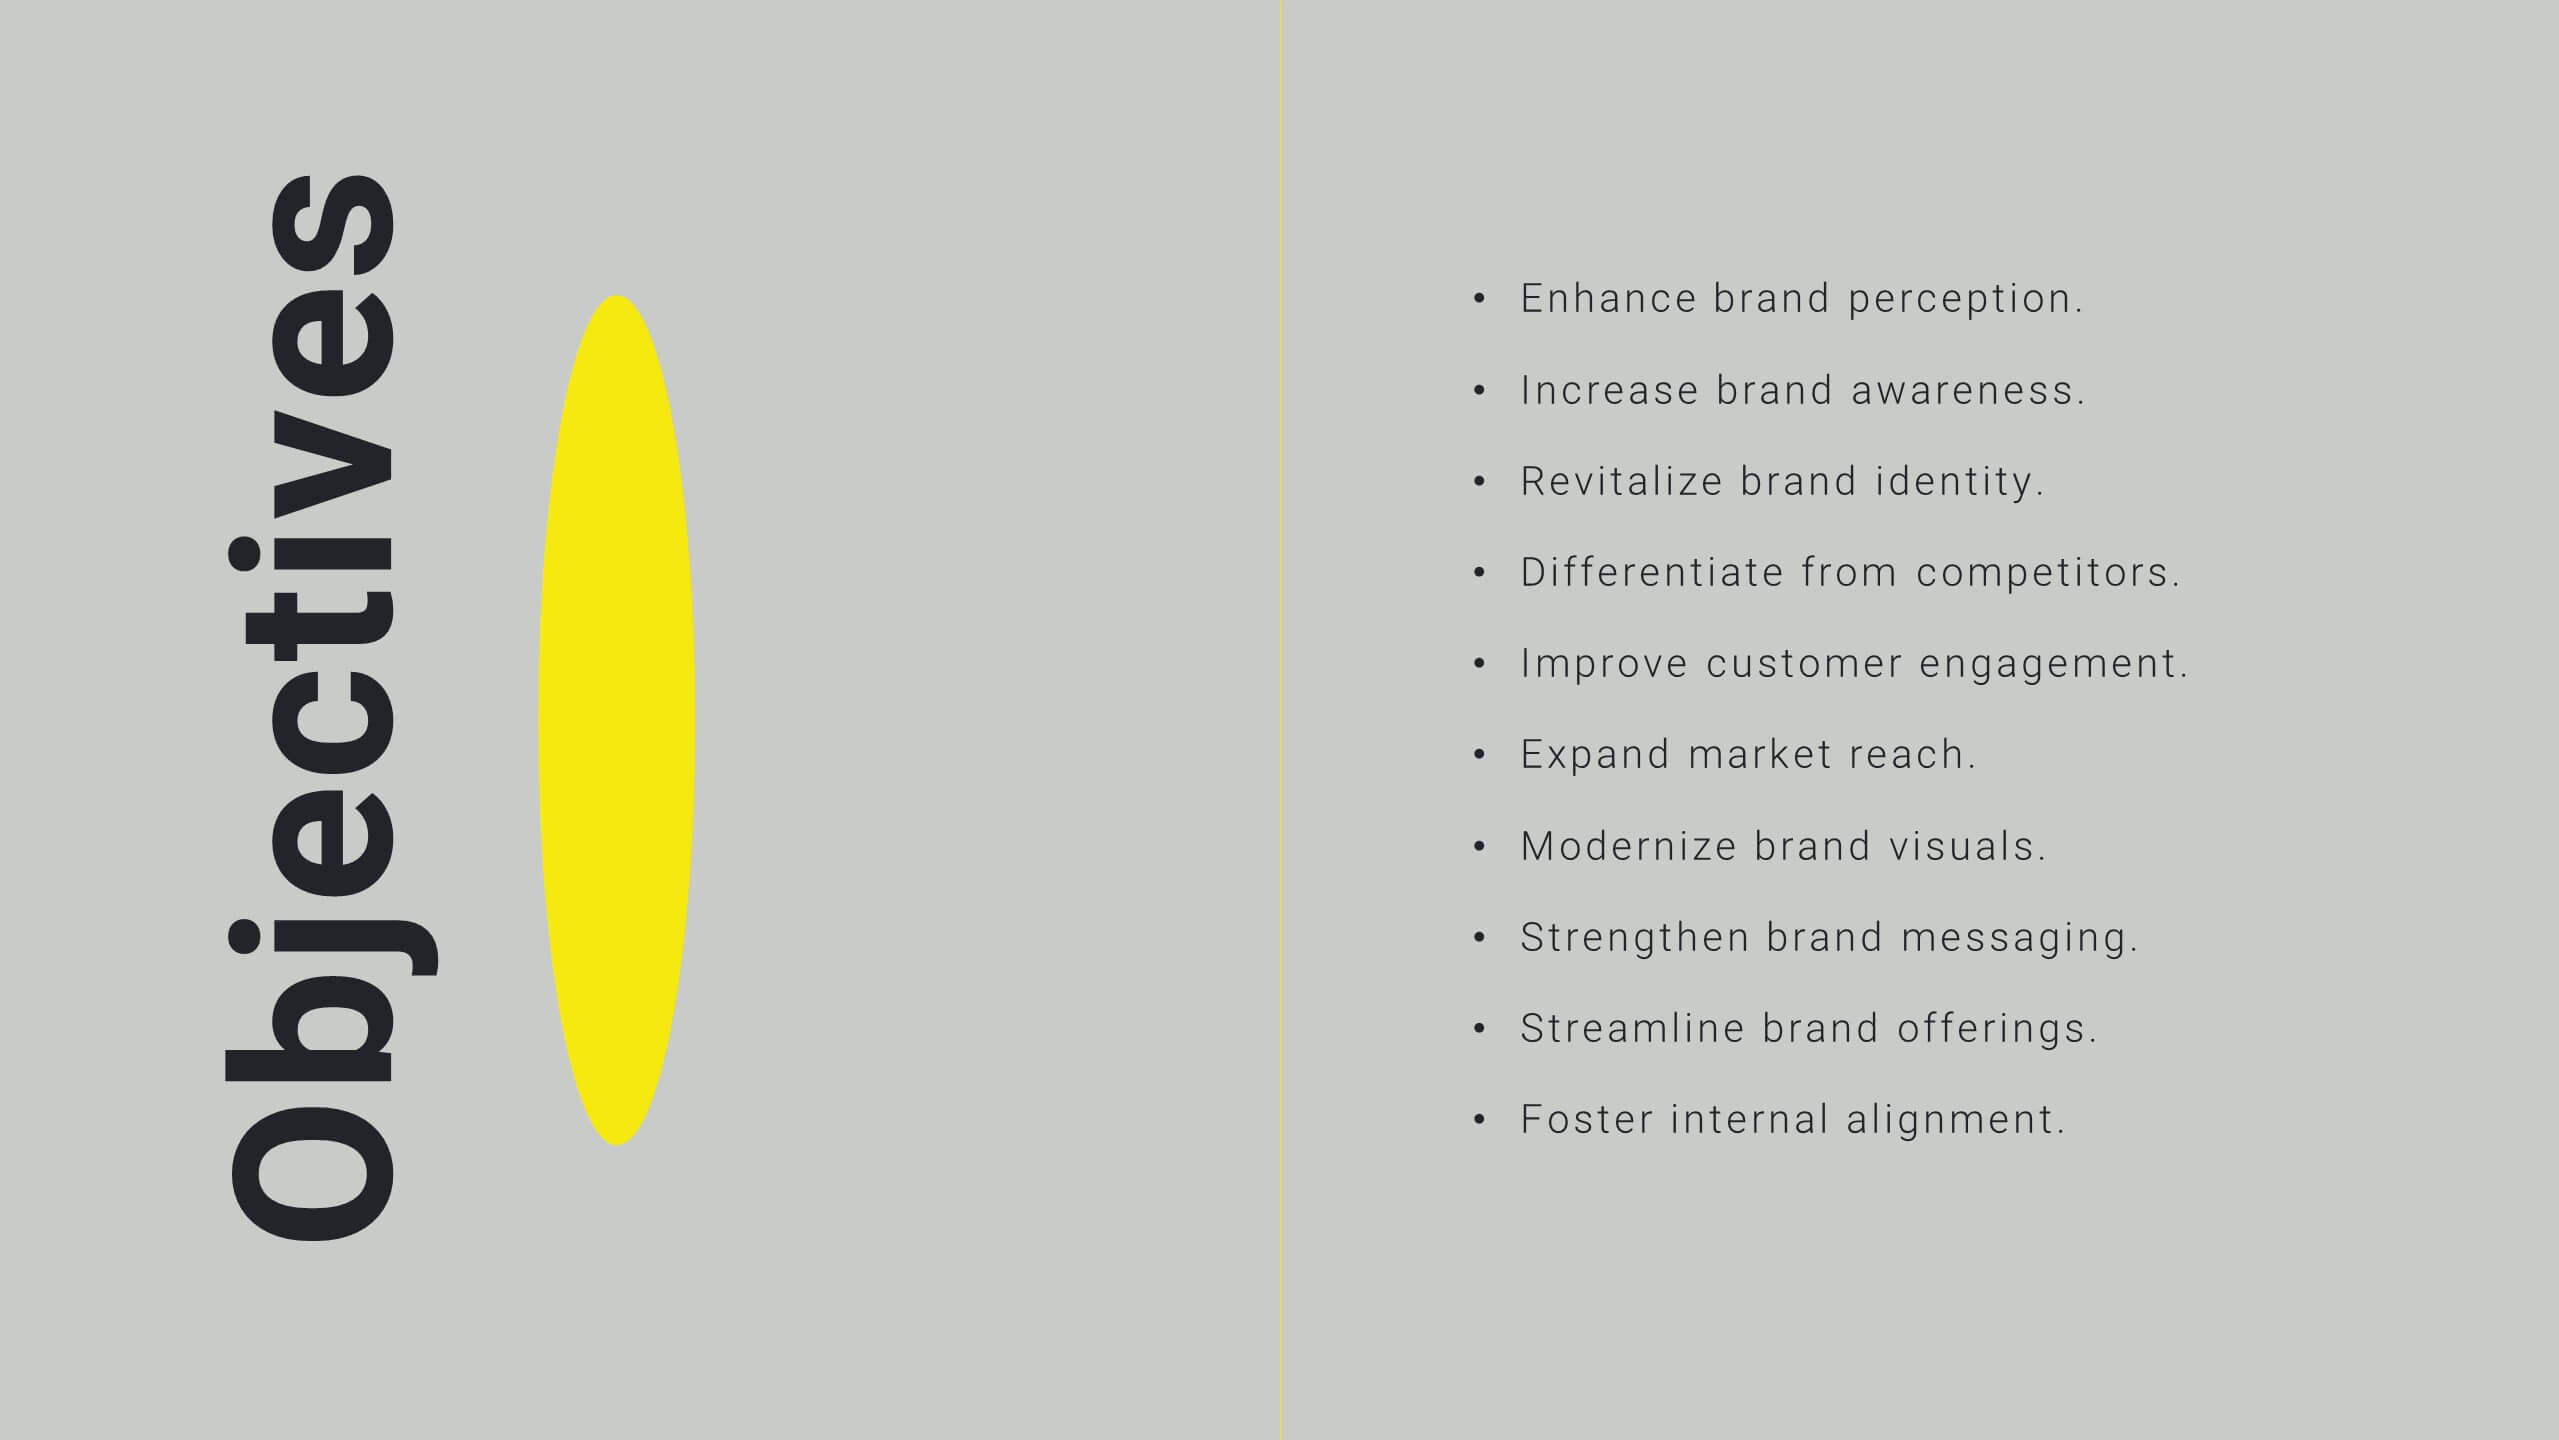
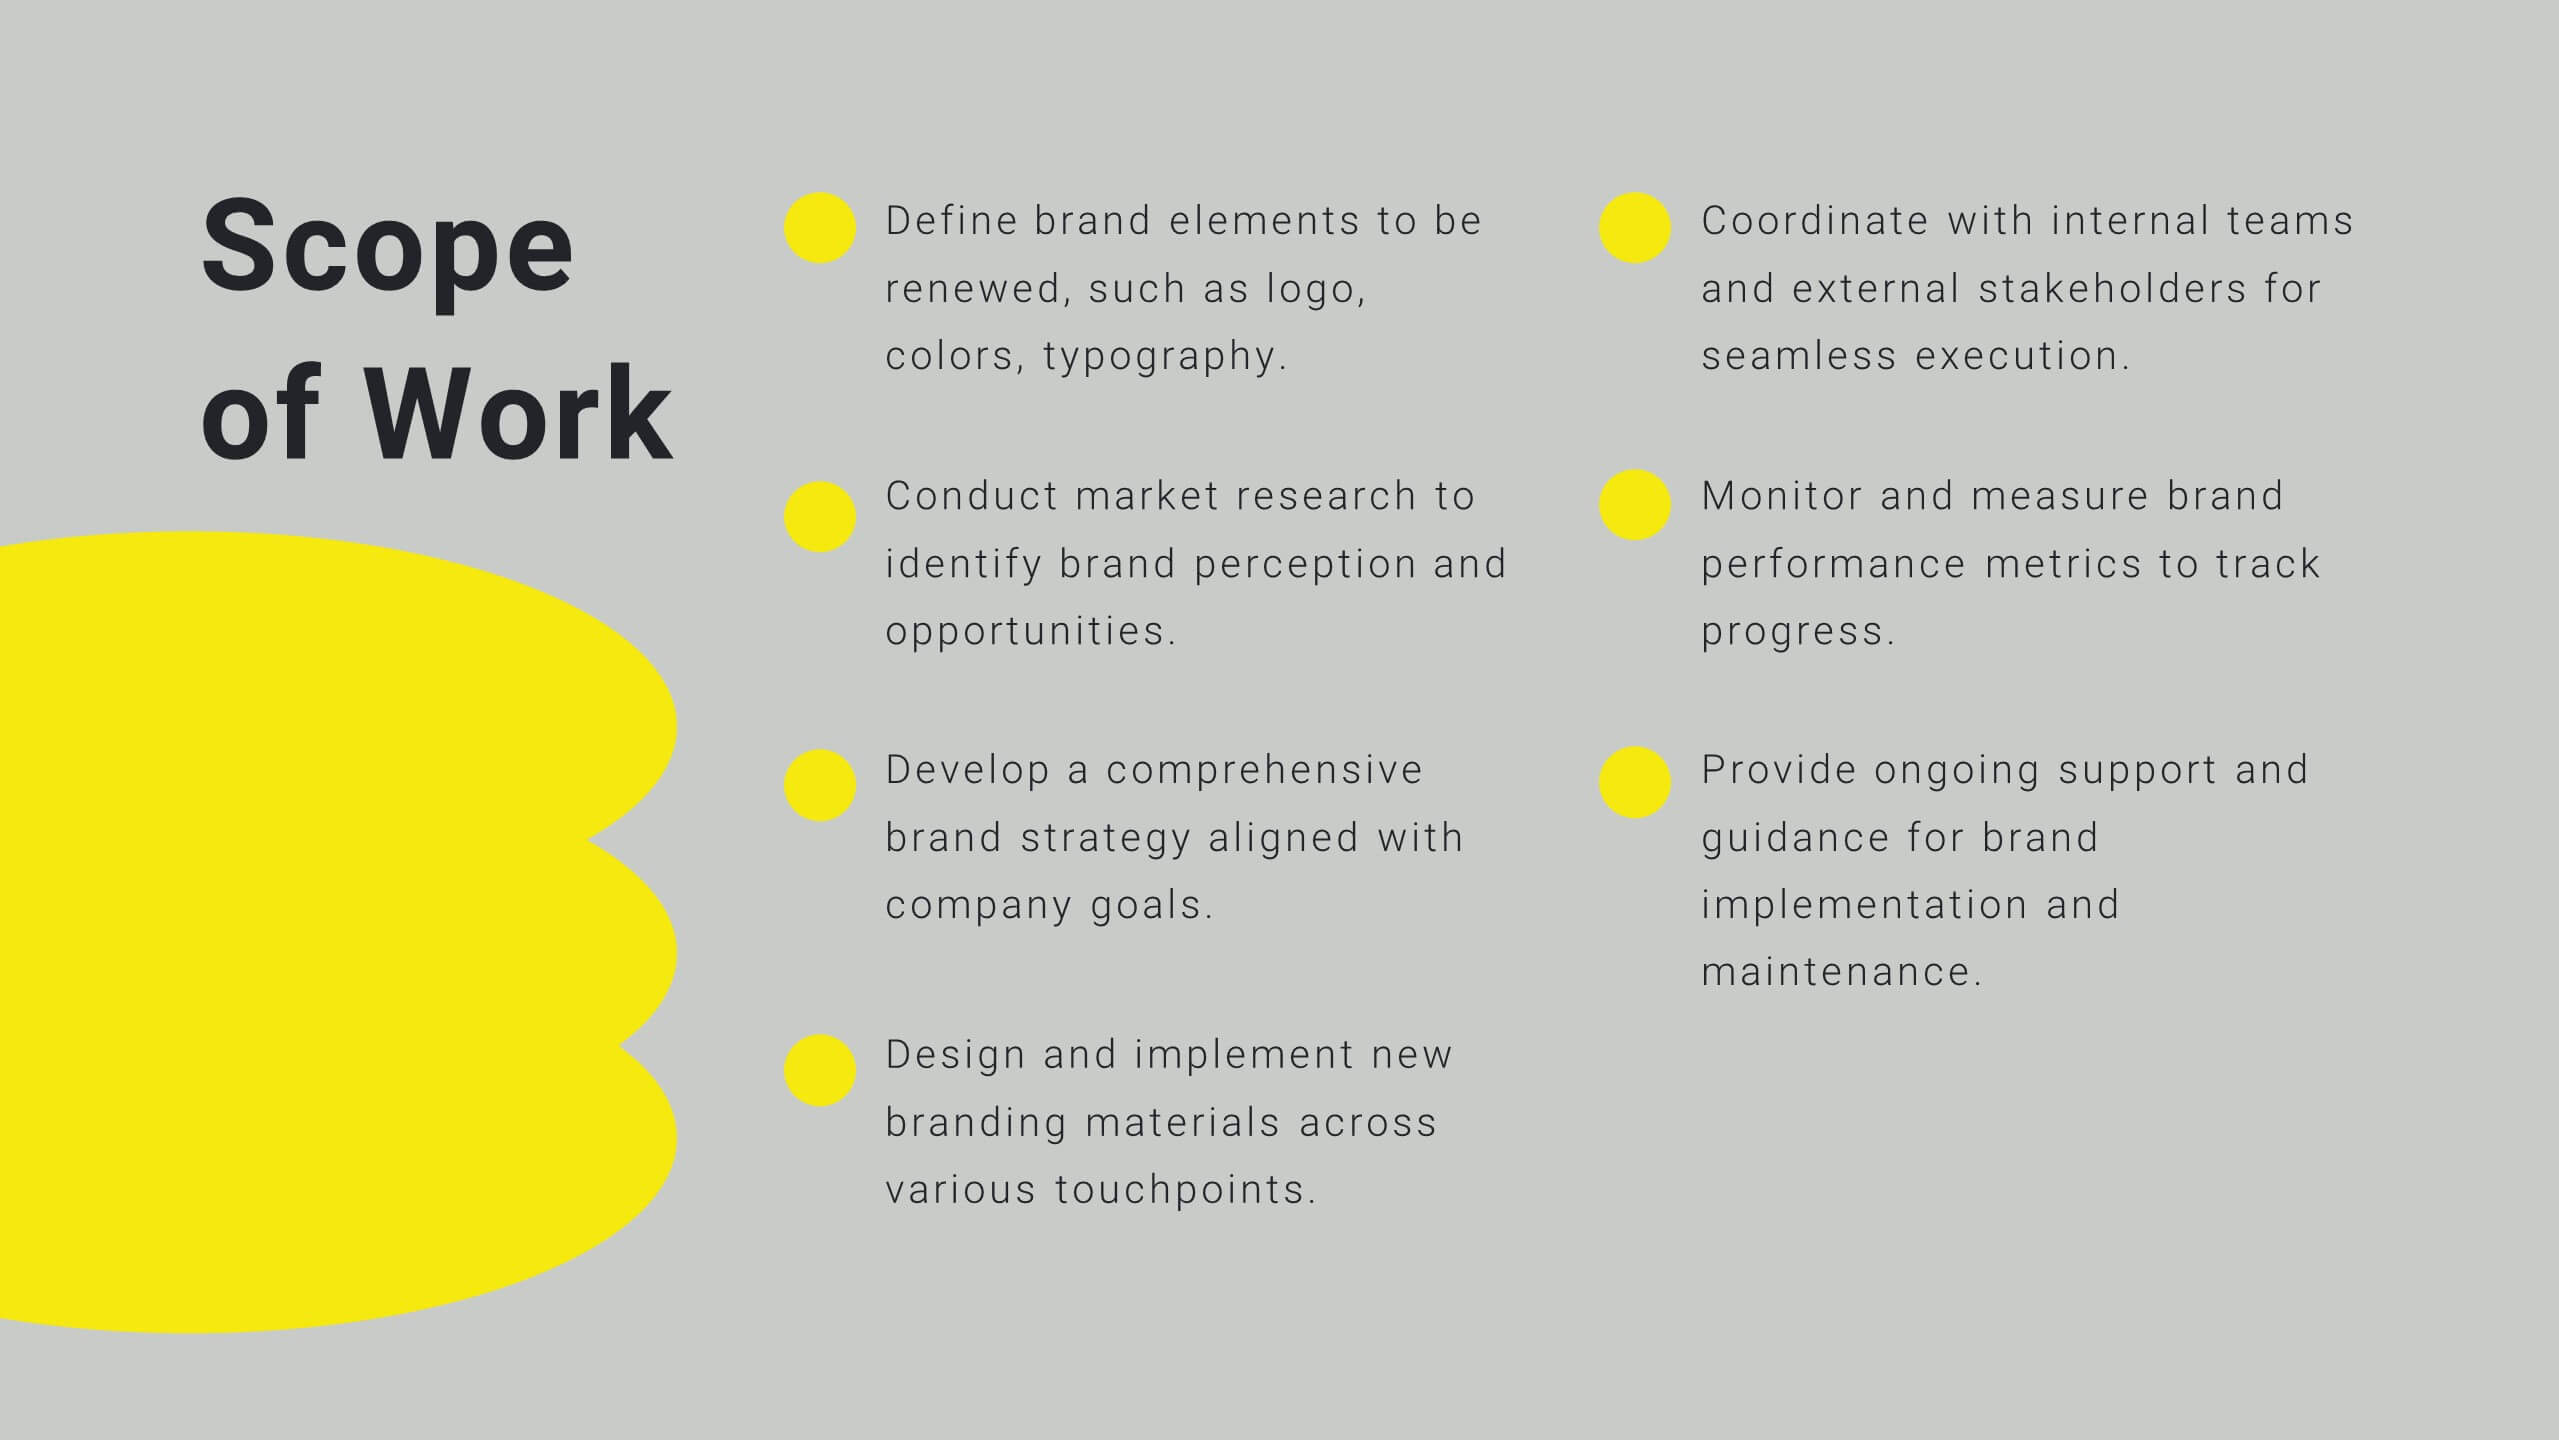
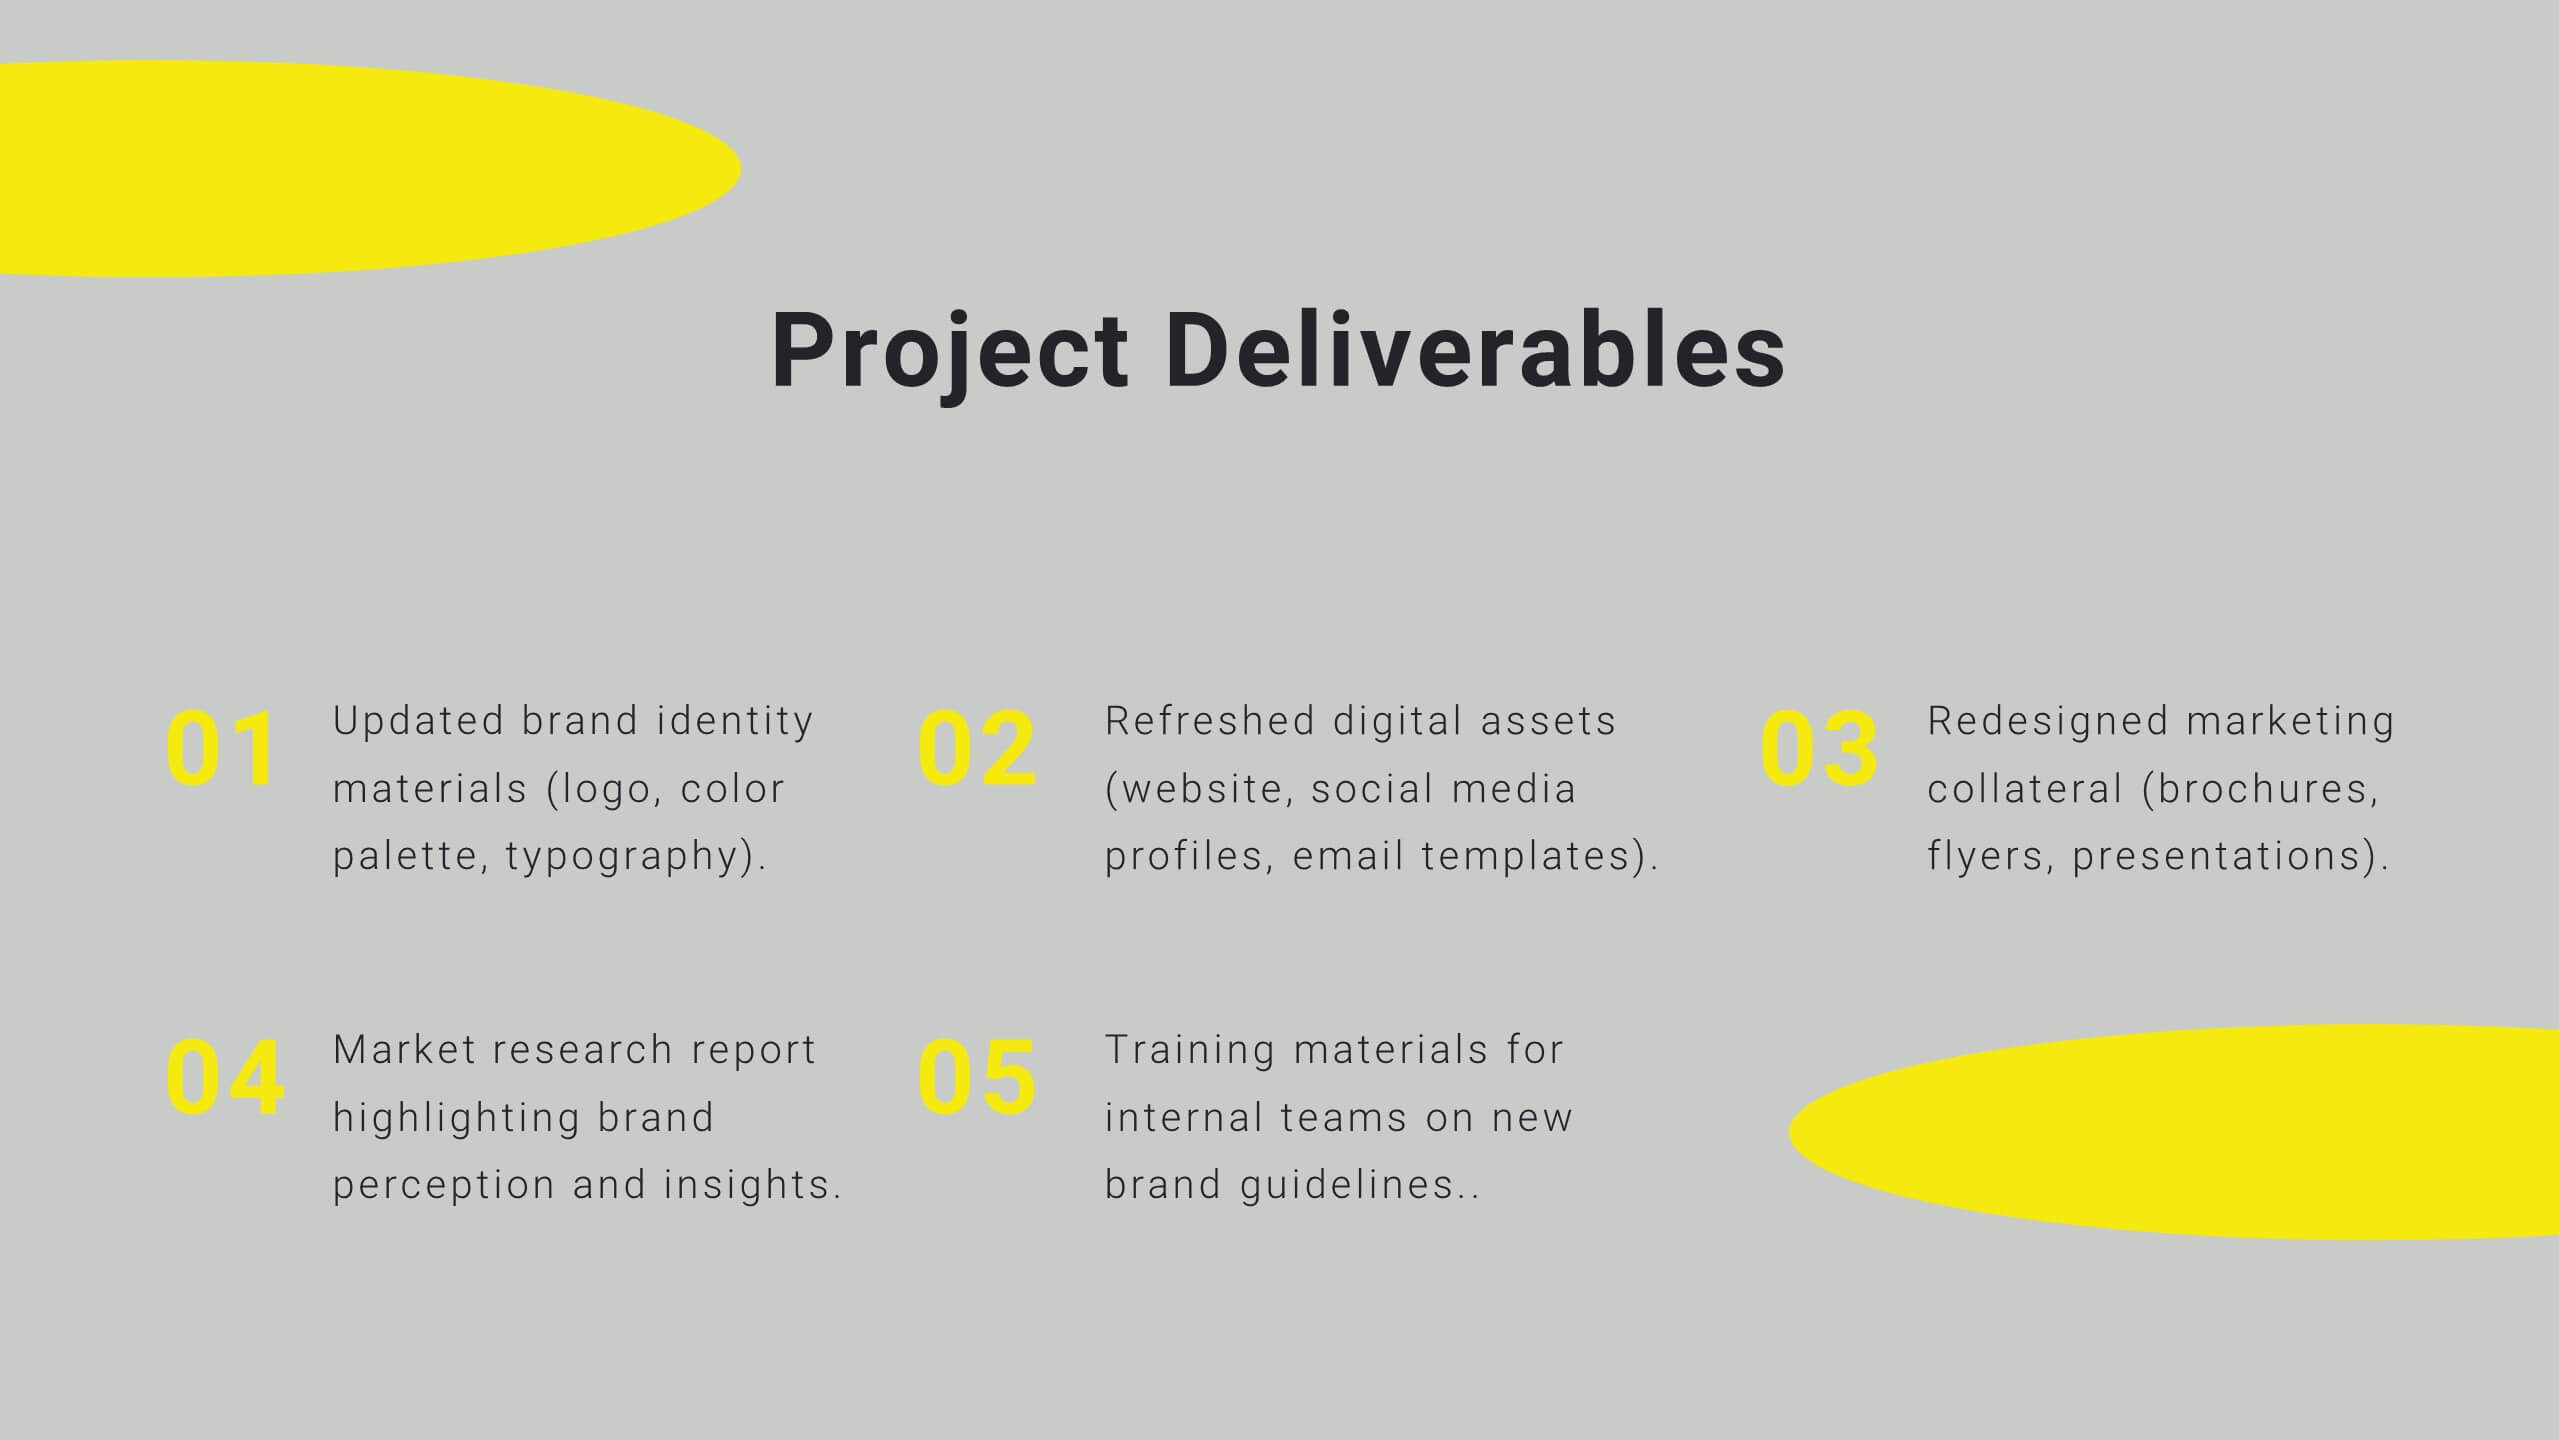
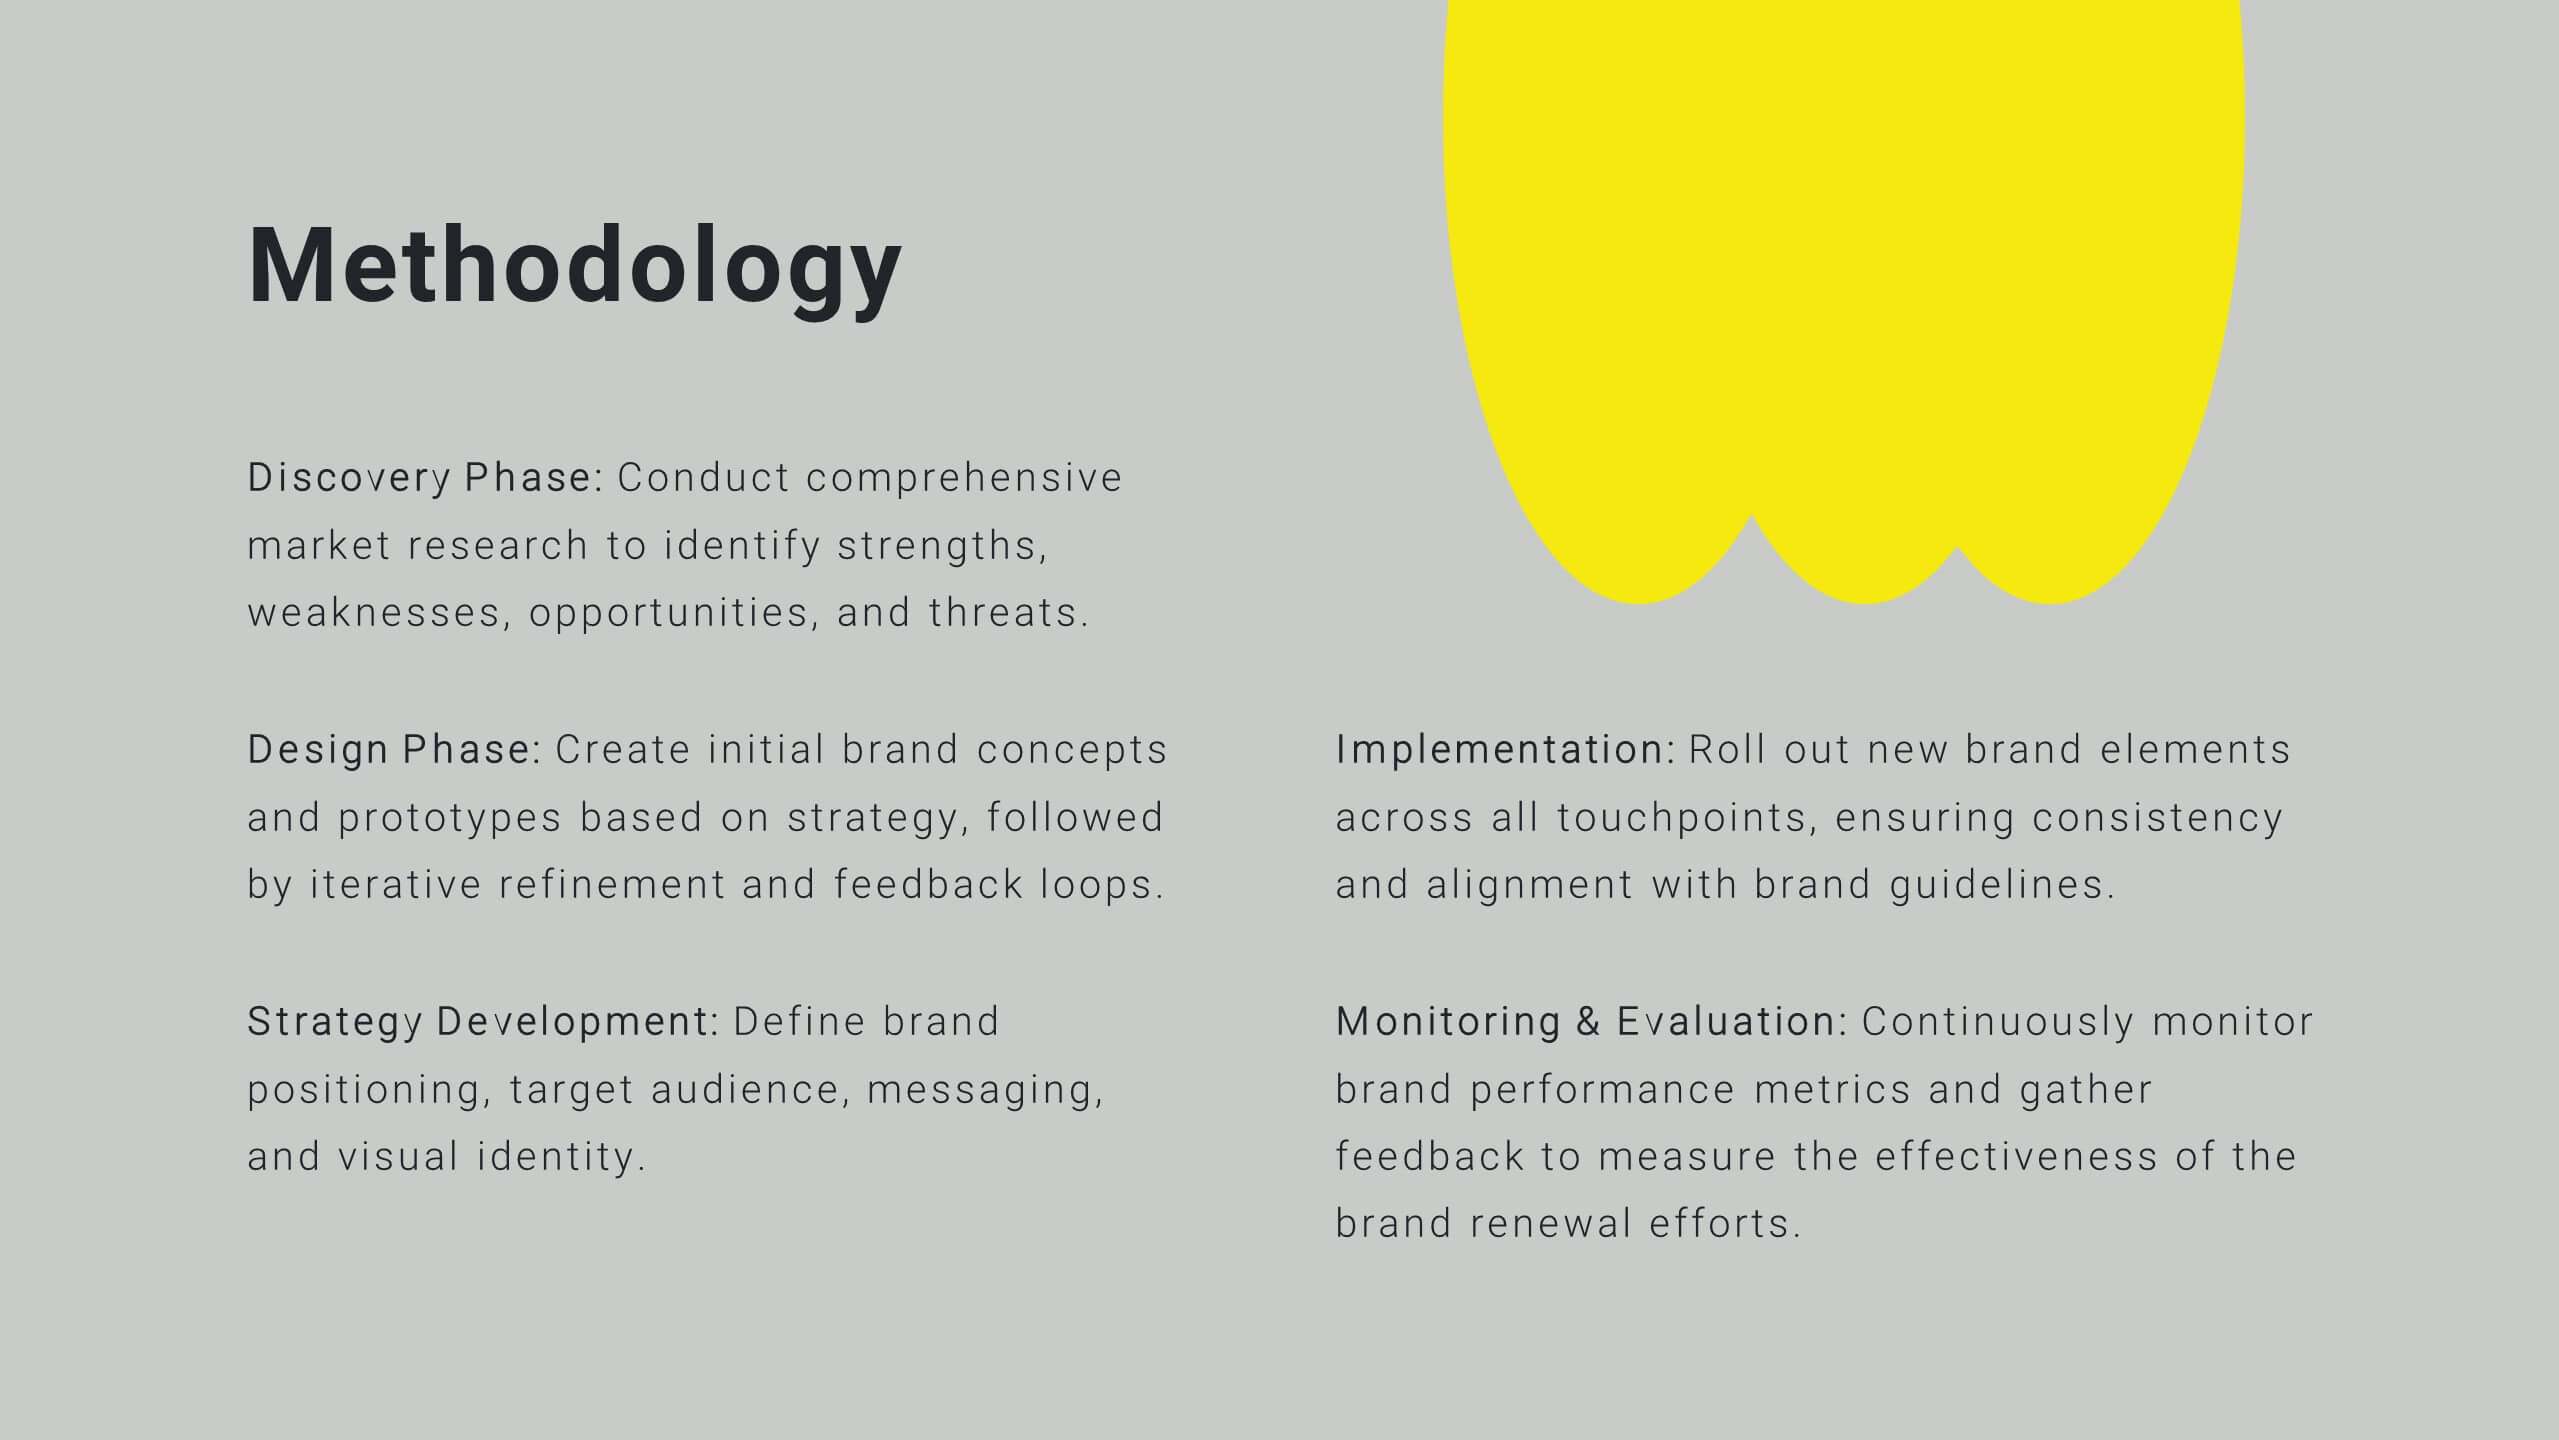
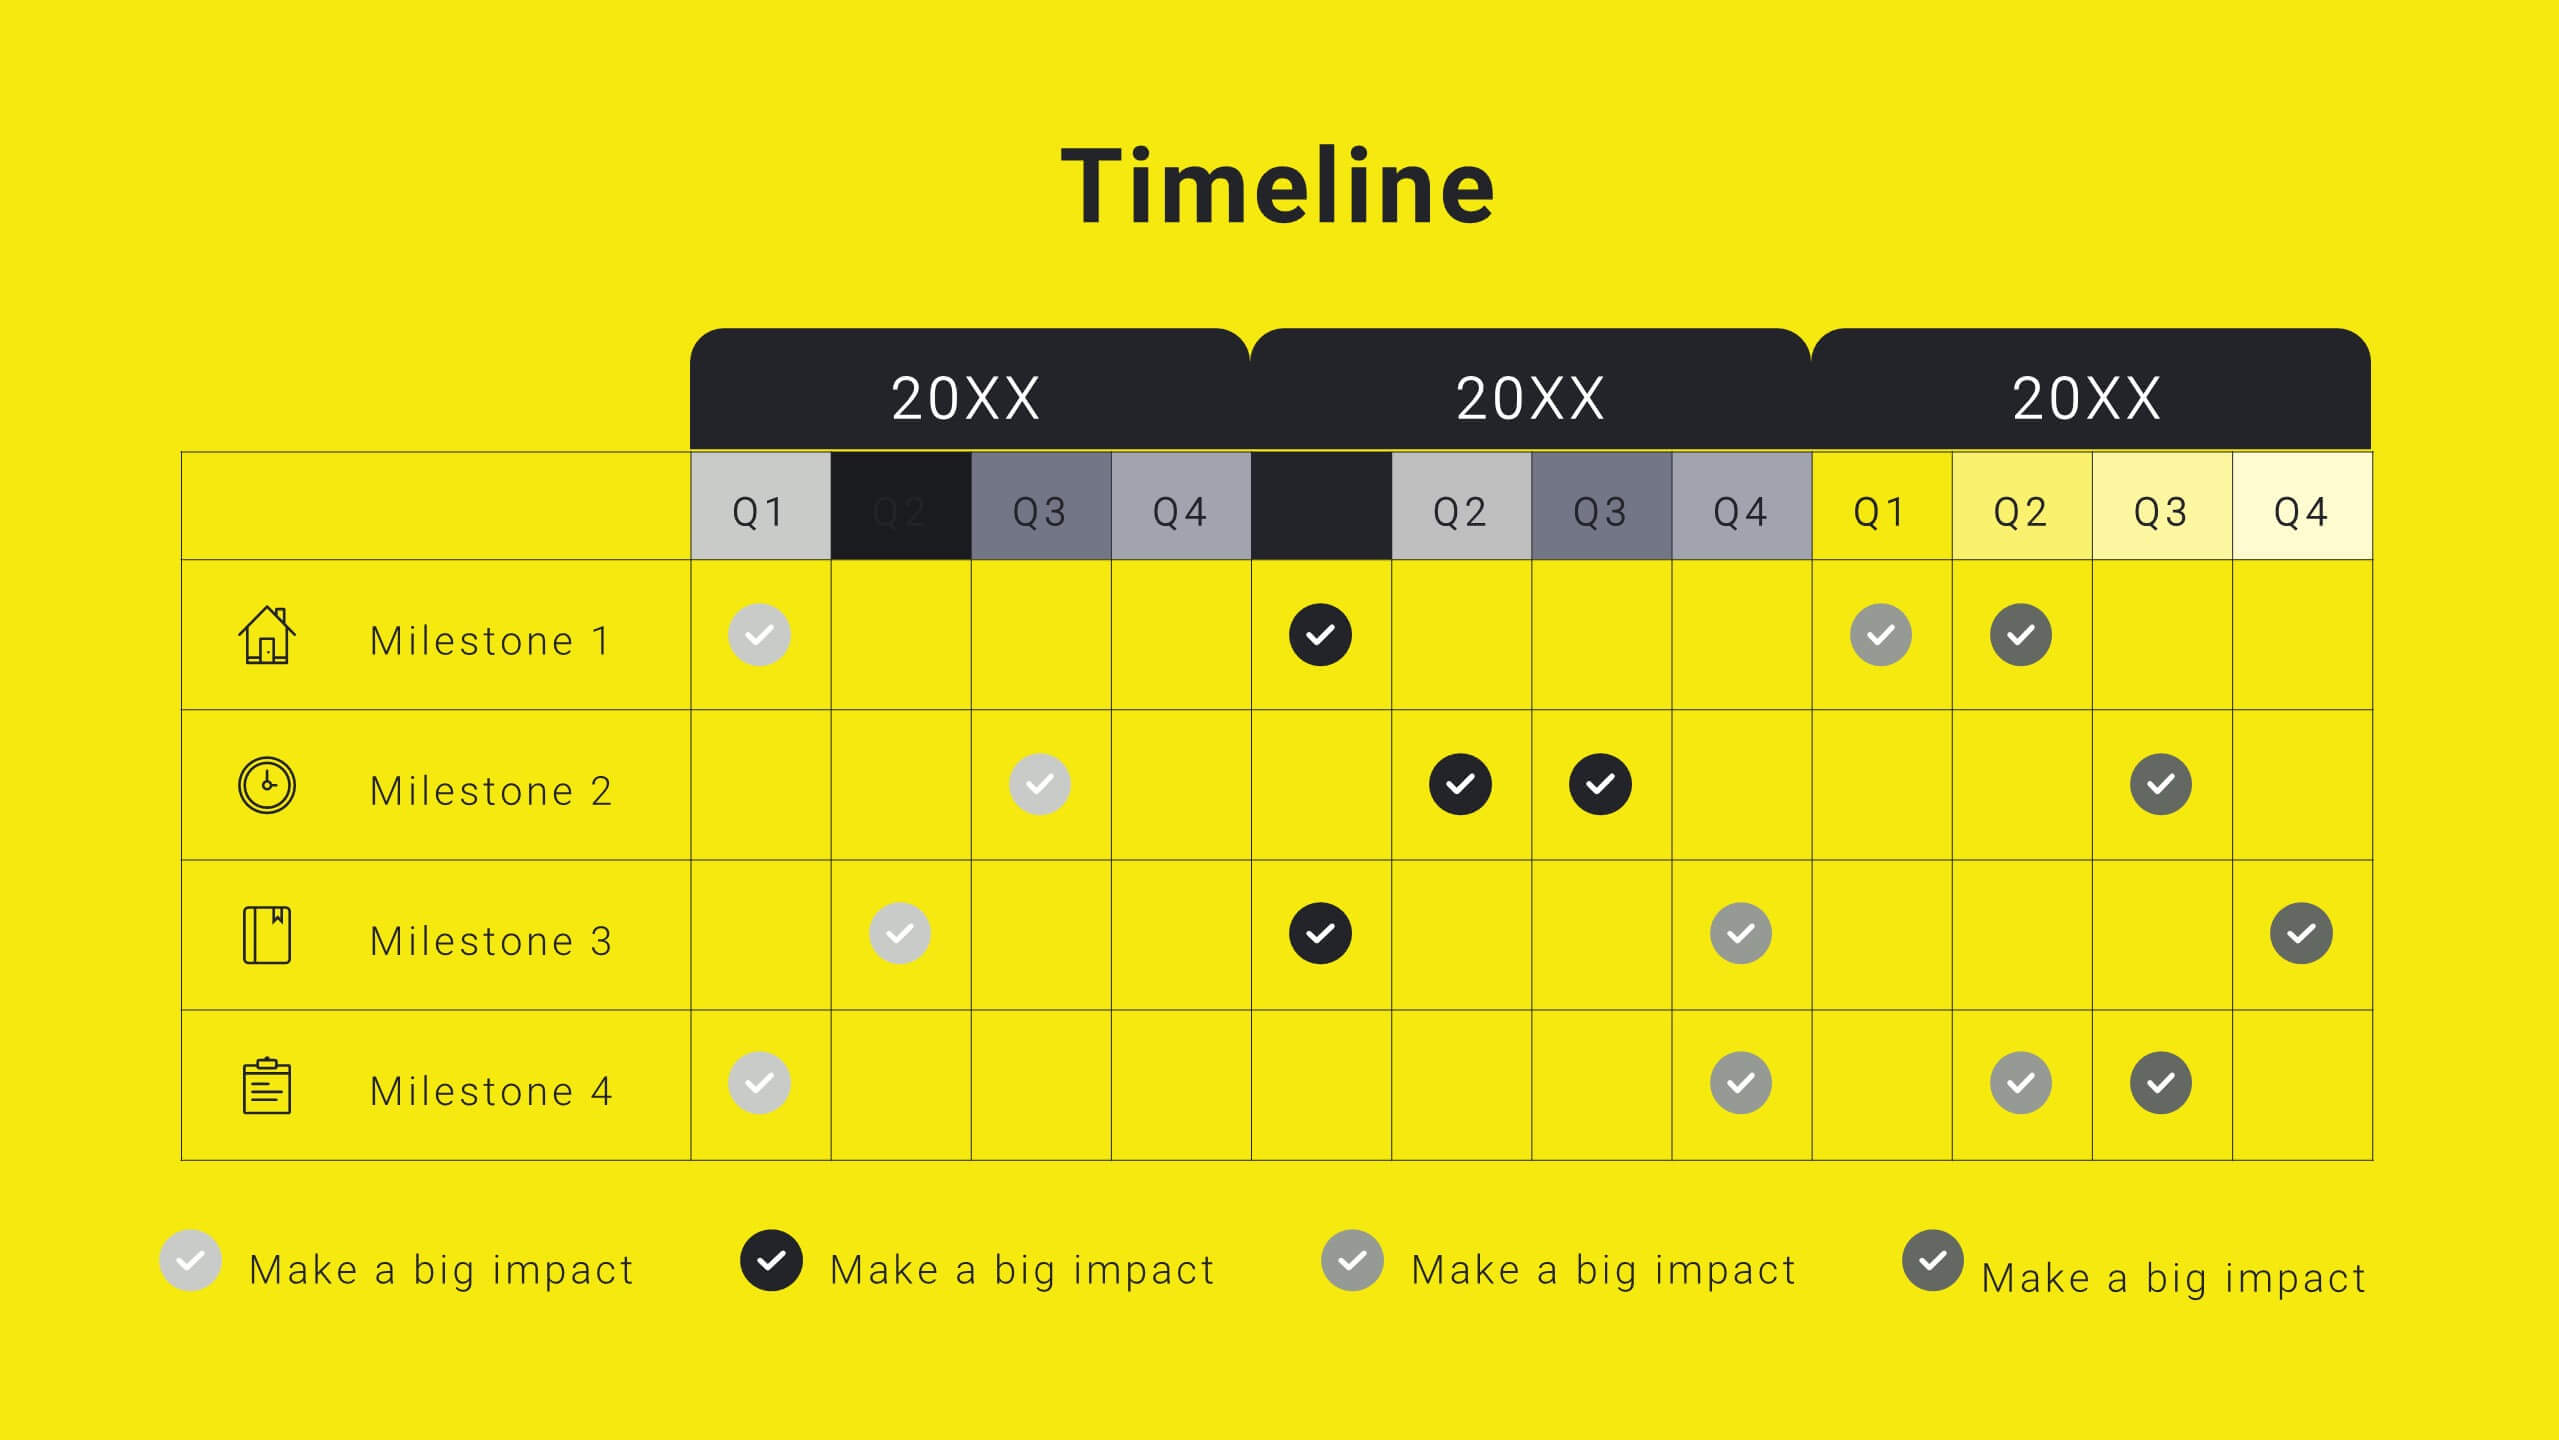
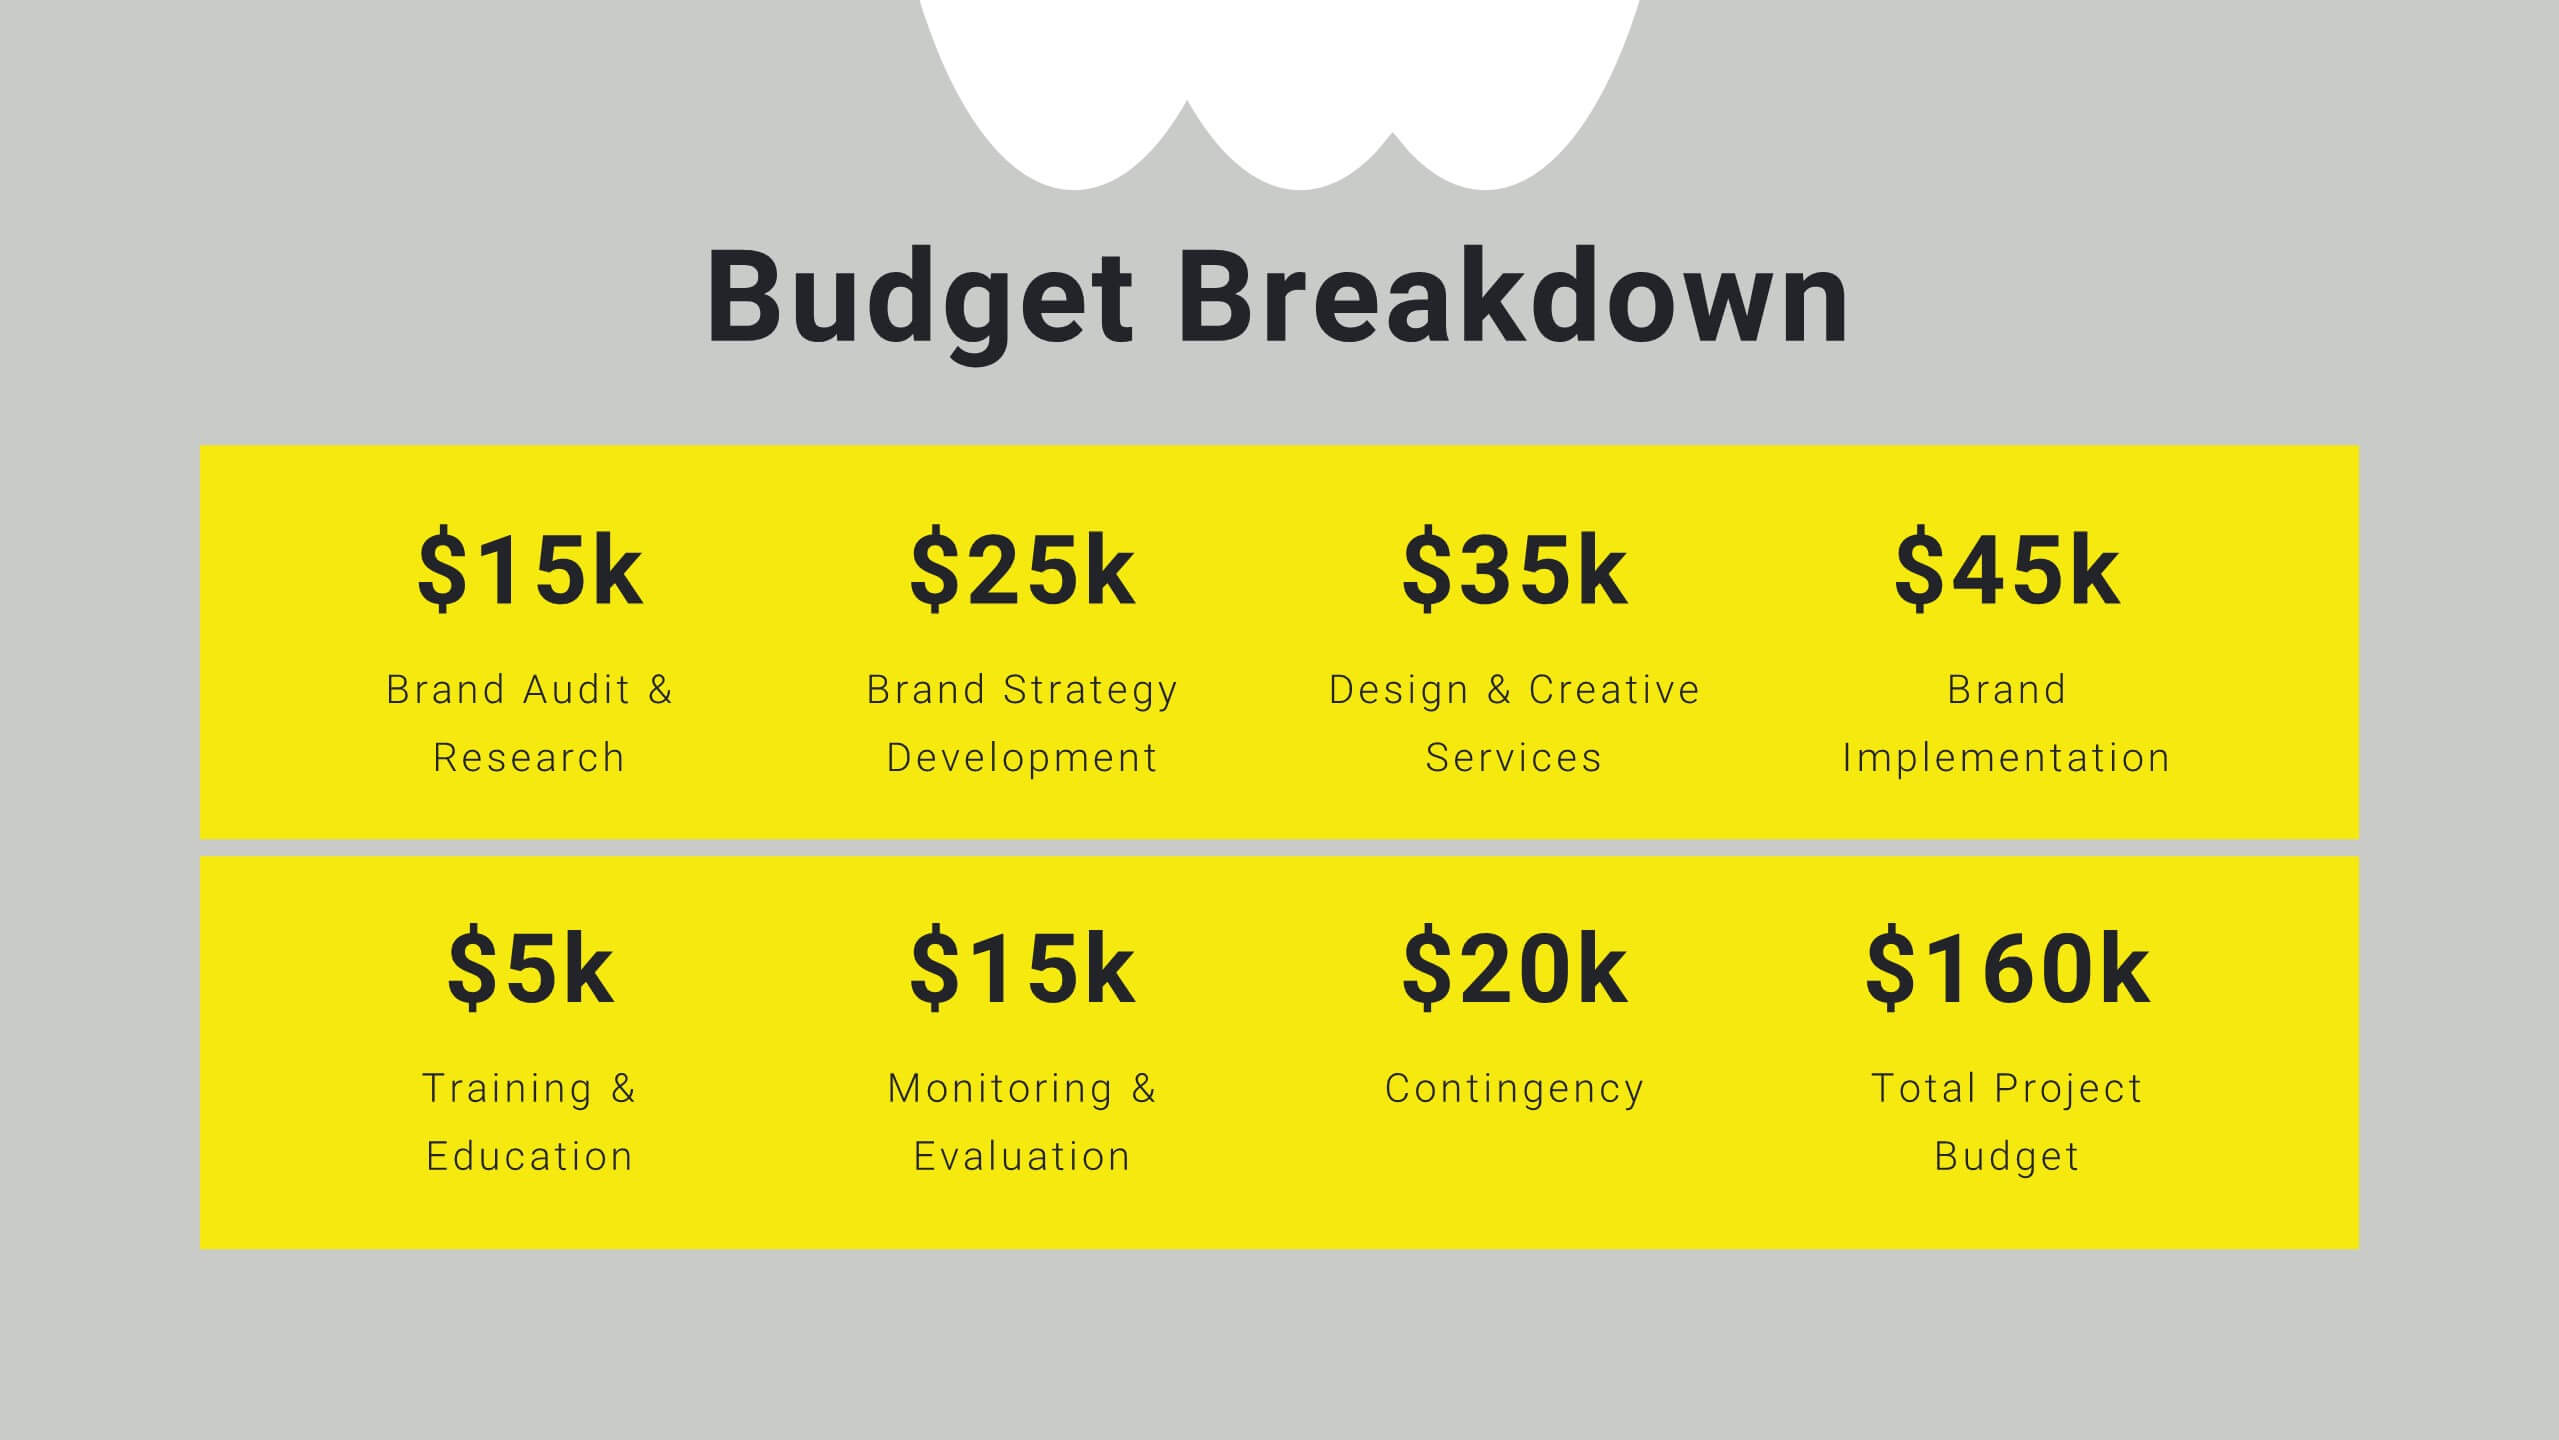
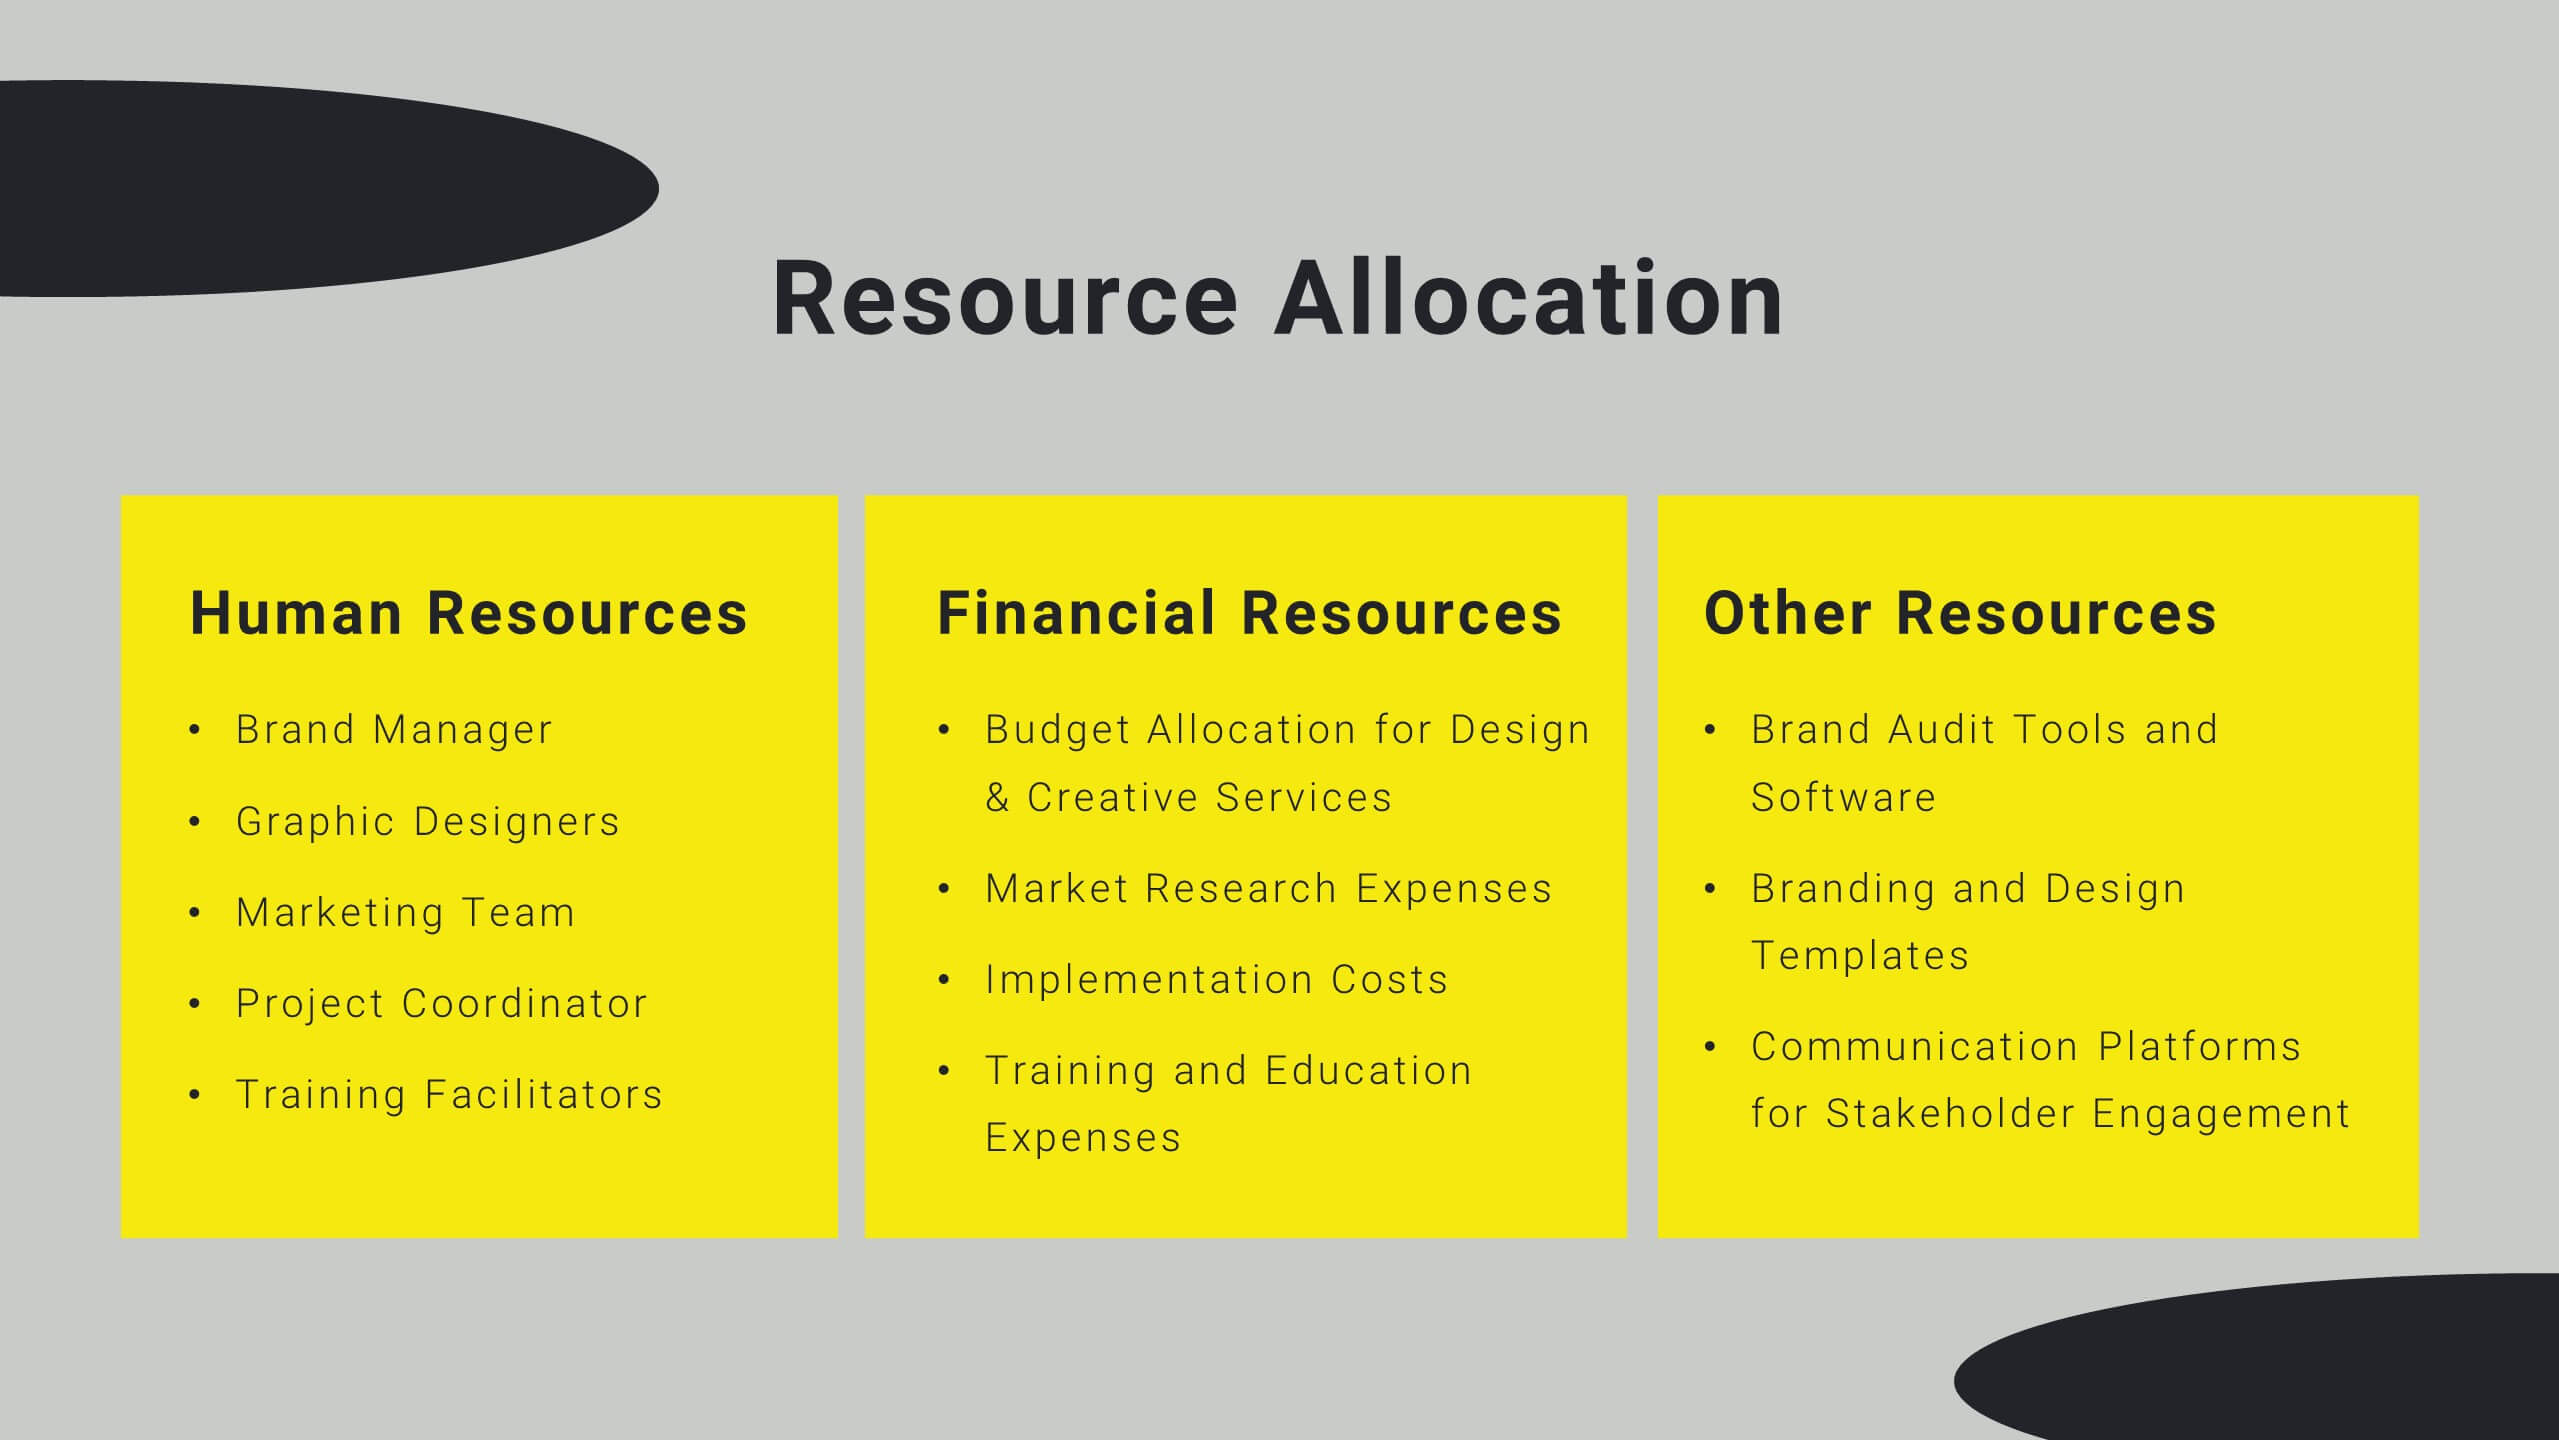
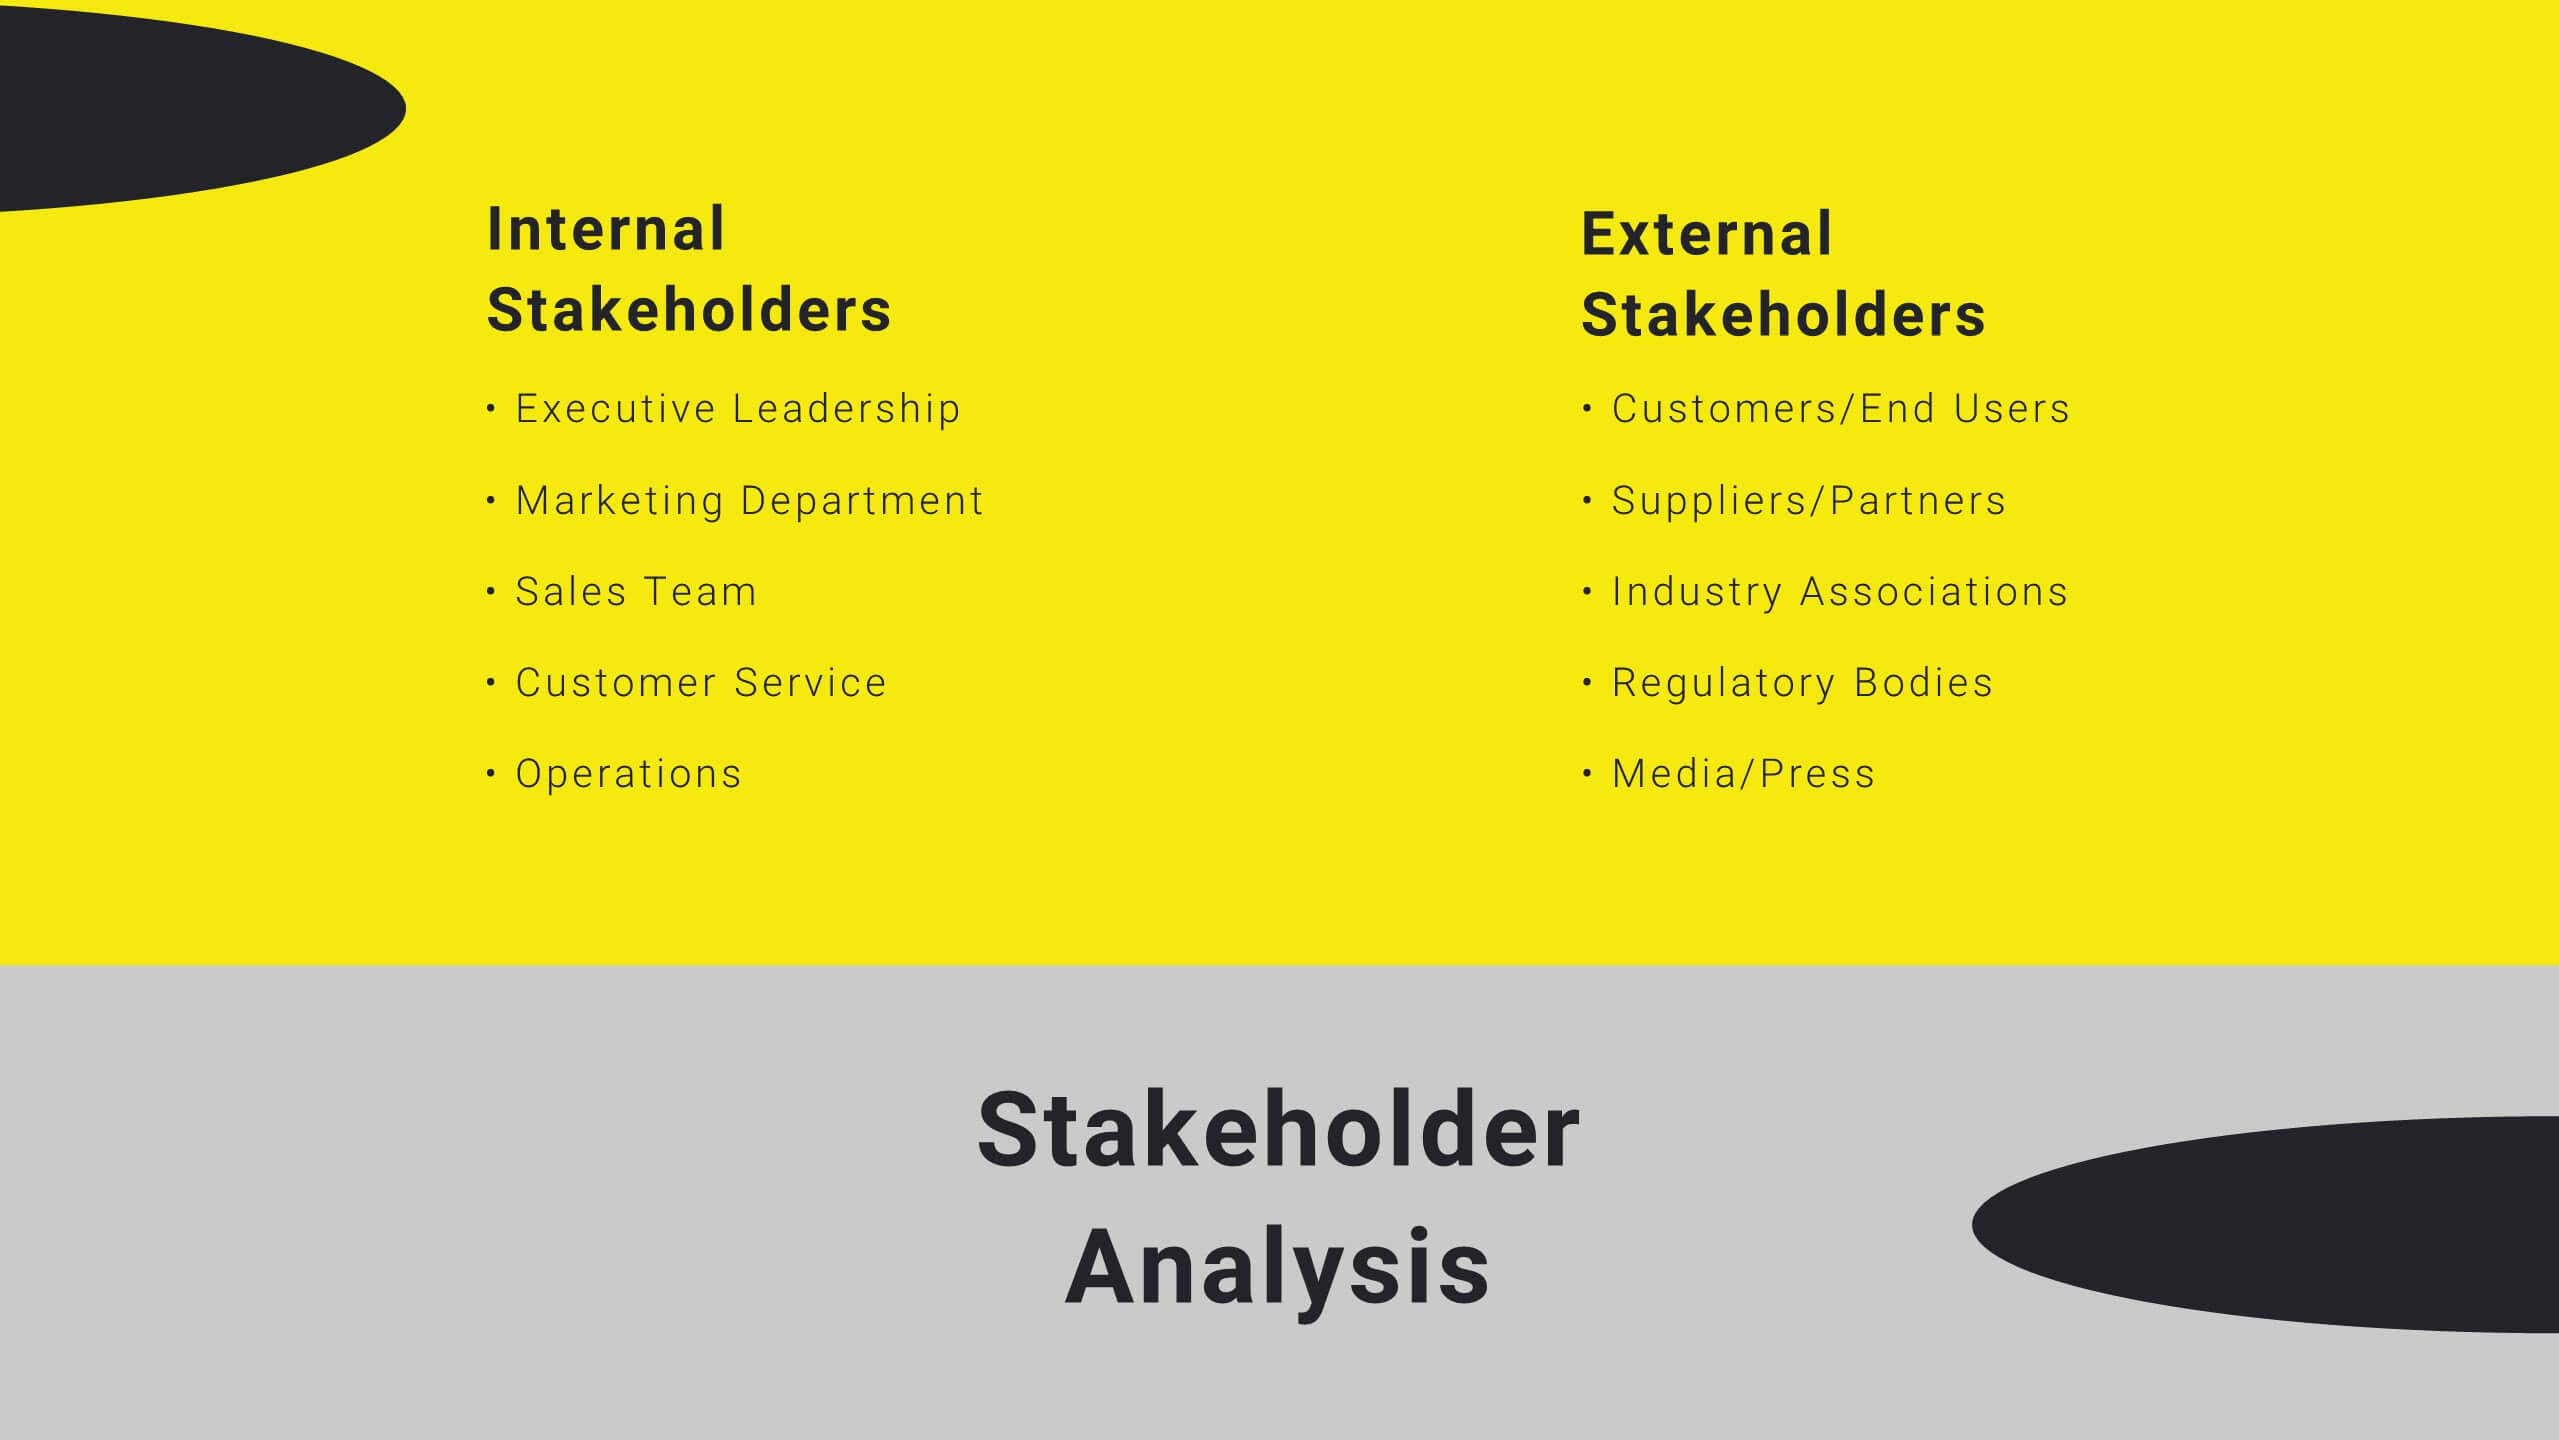
Sable Detailed Project Execution Plan Presentation
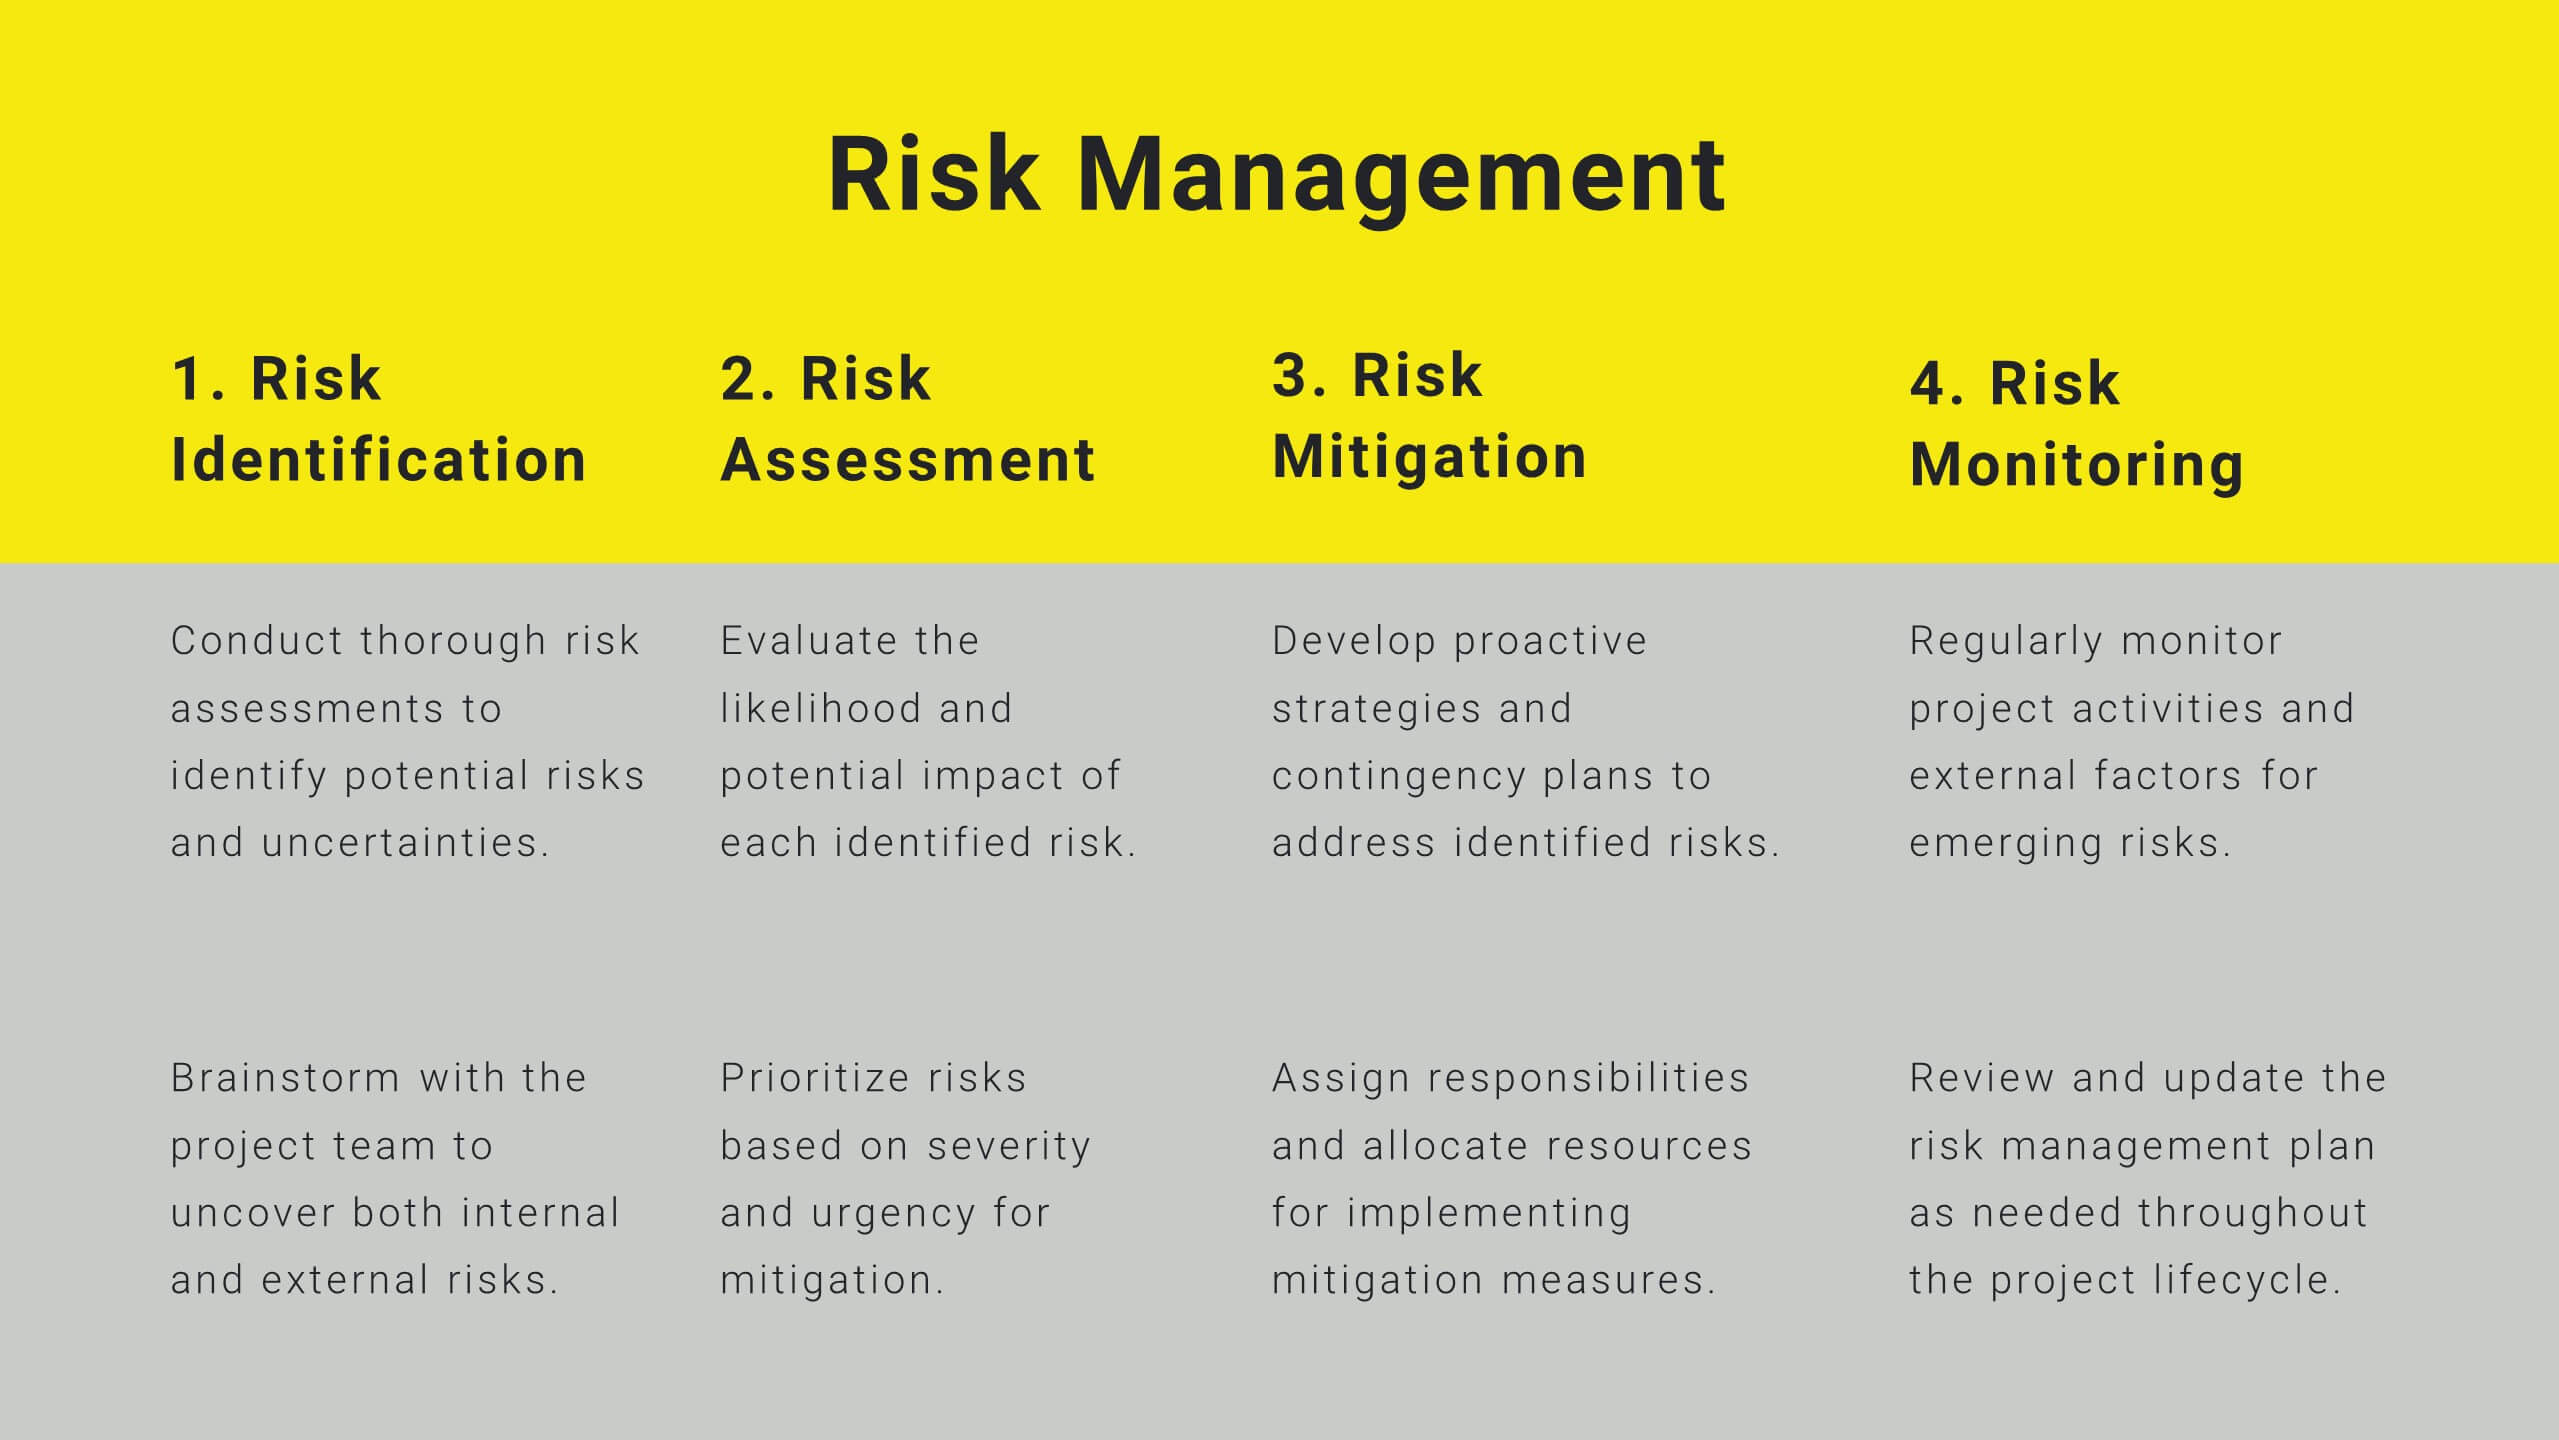
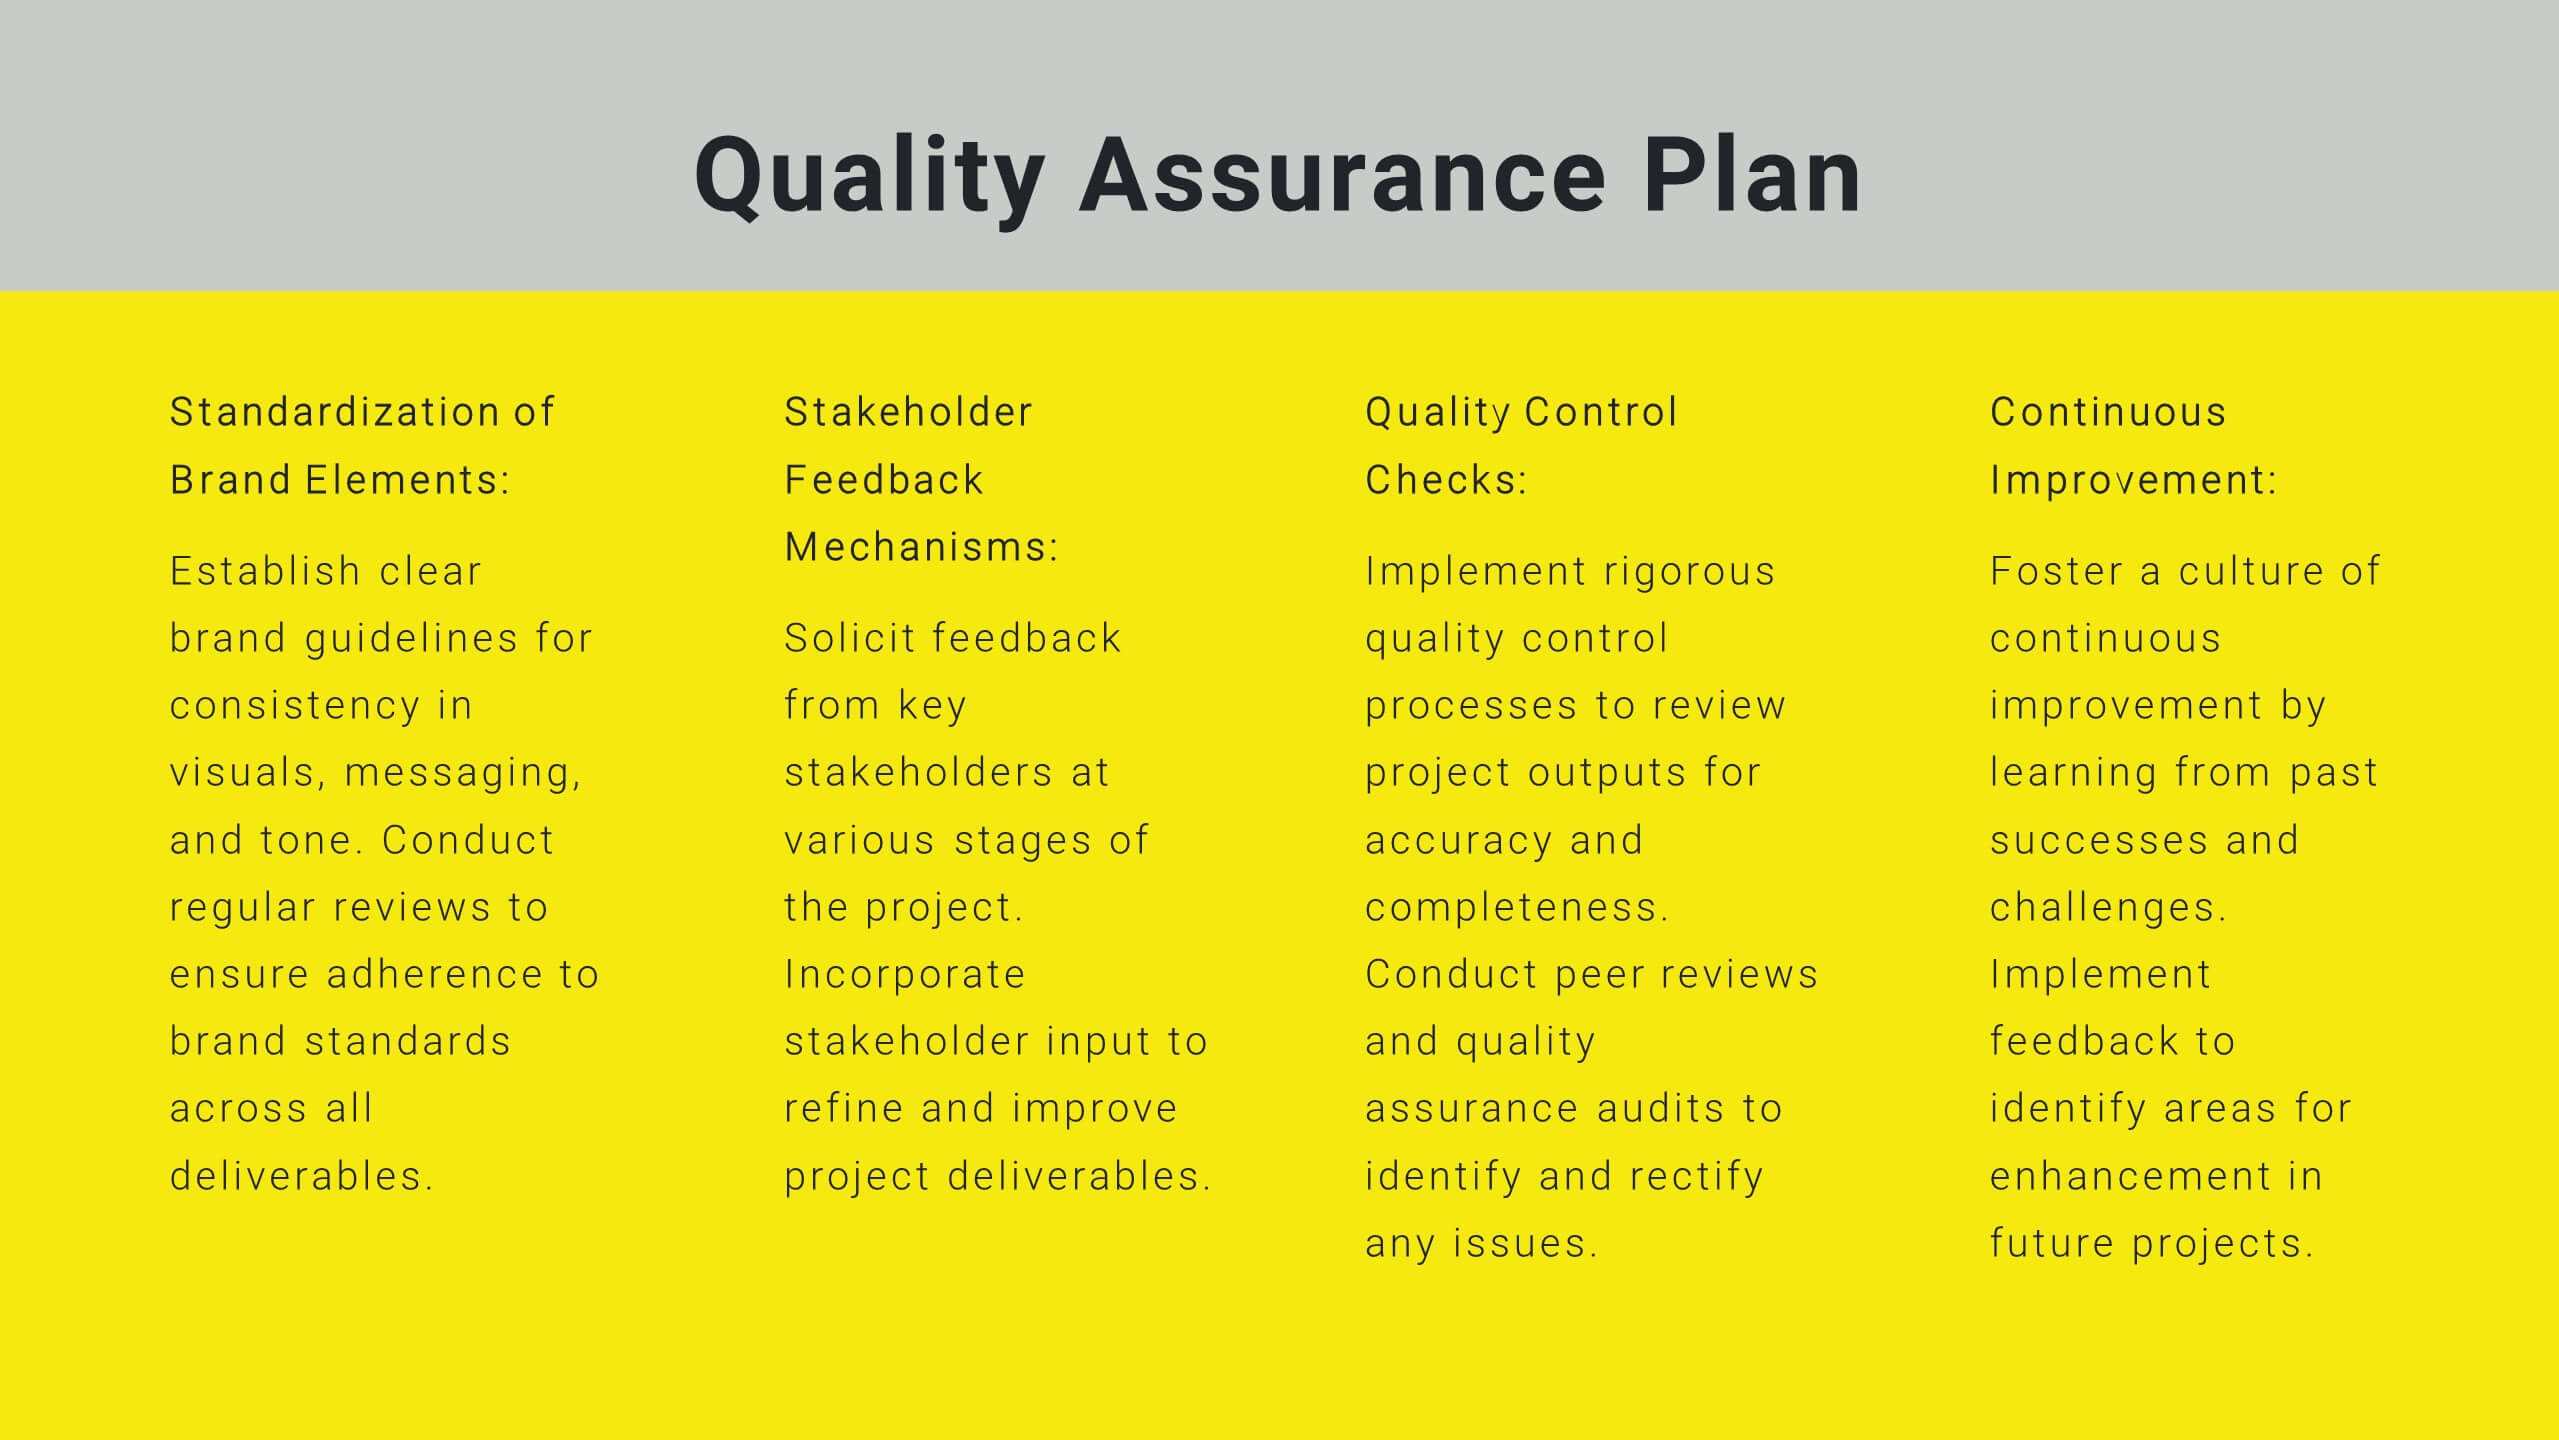
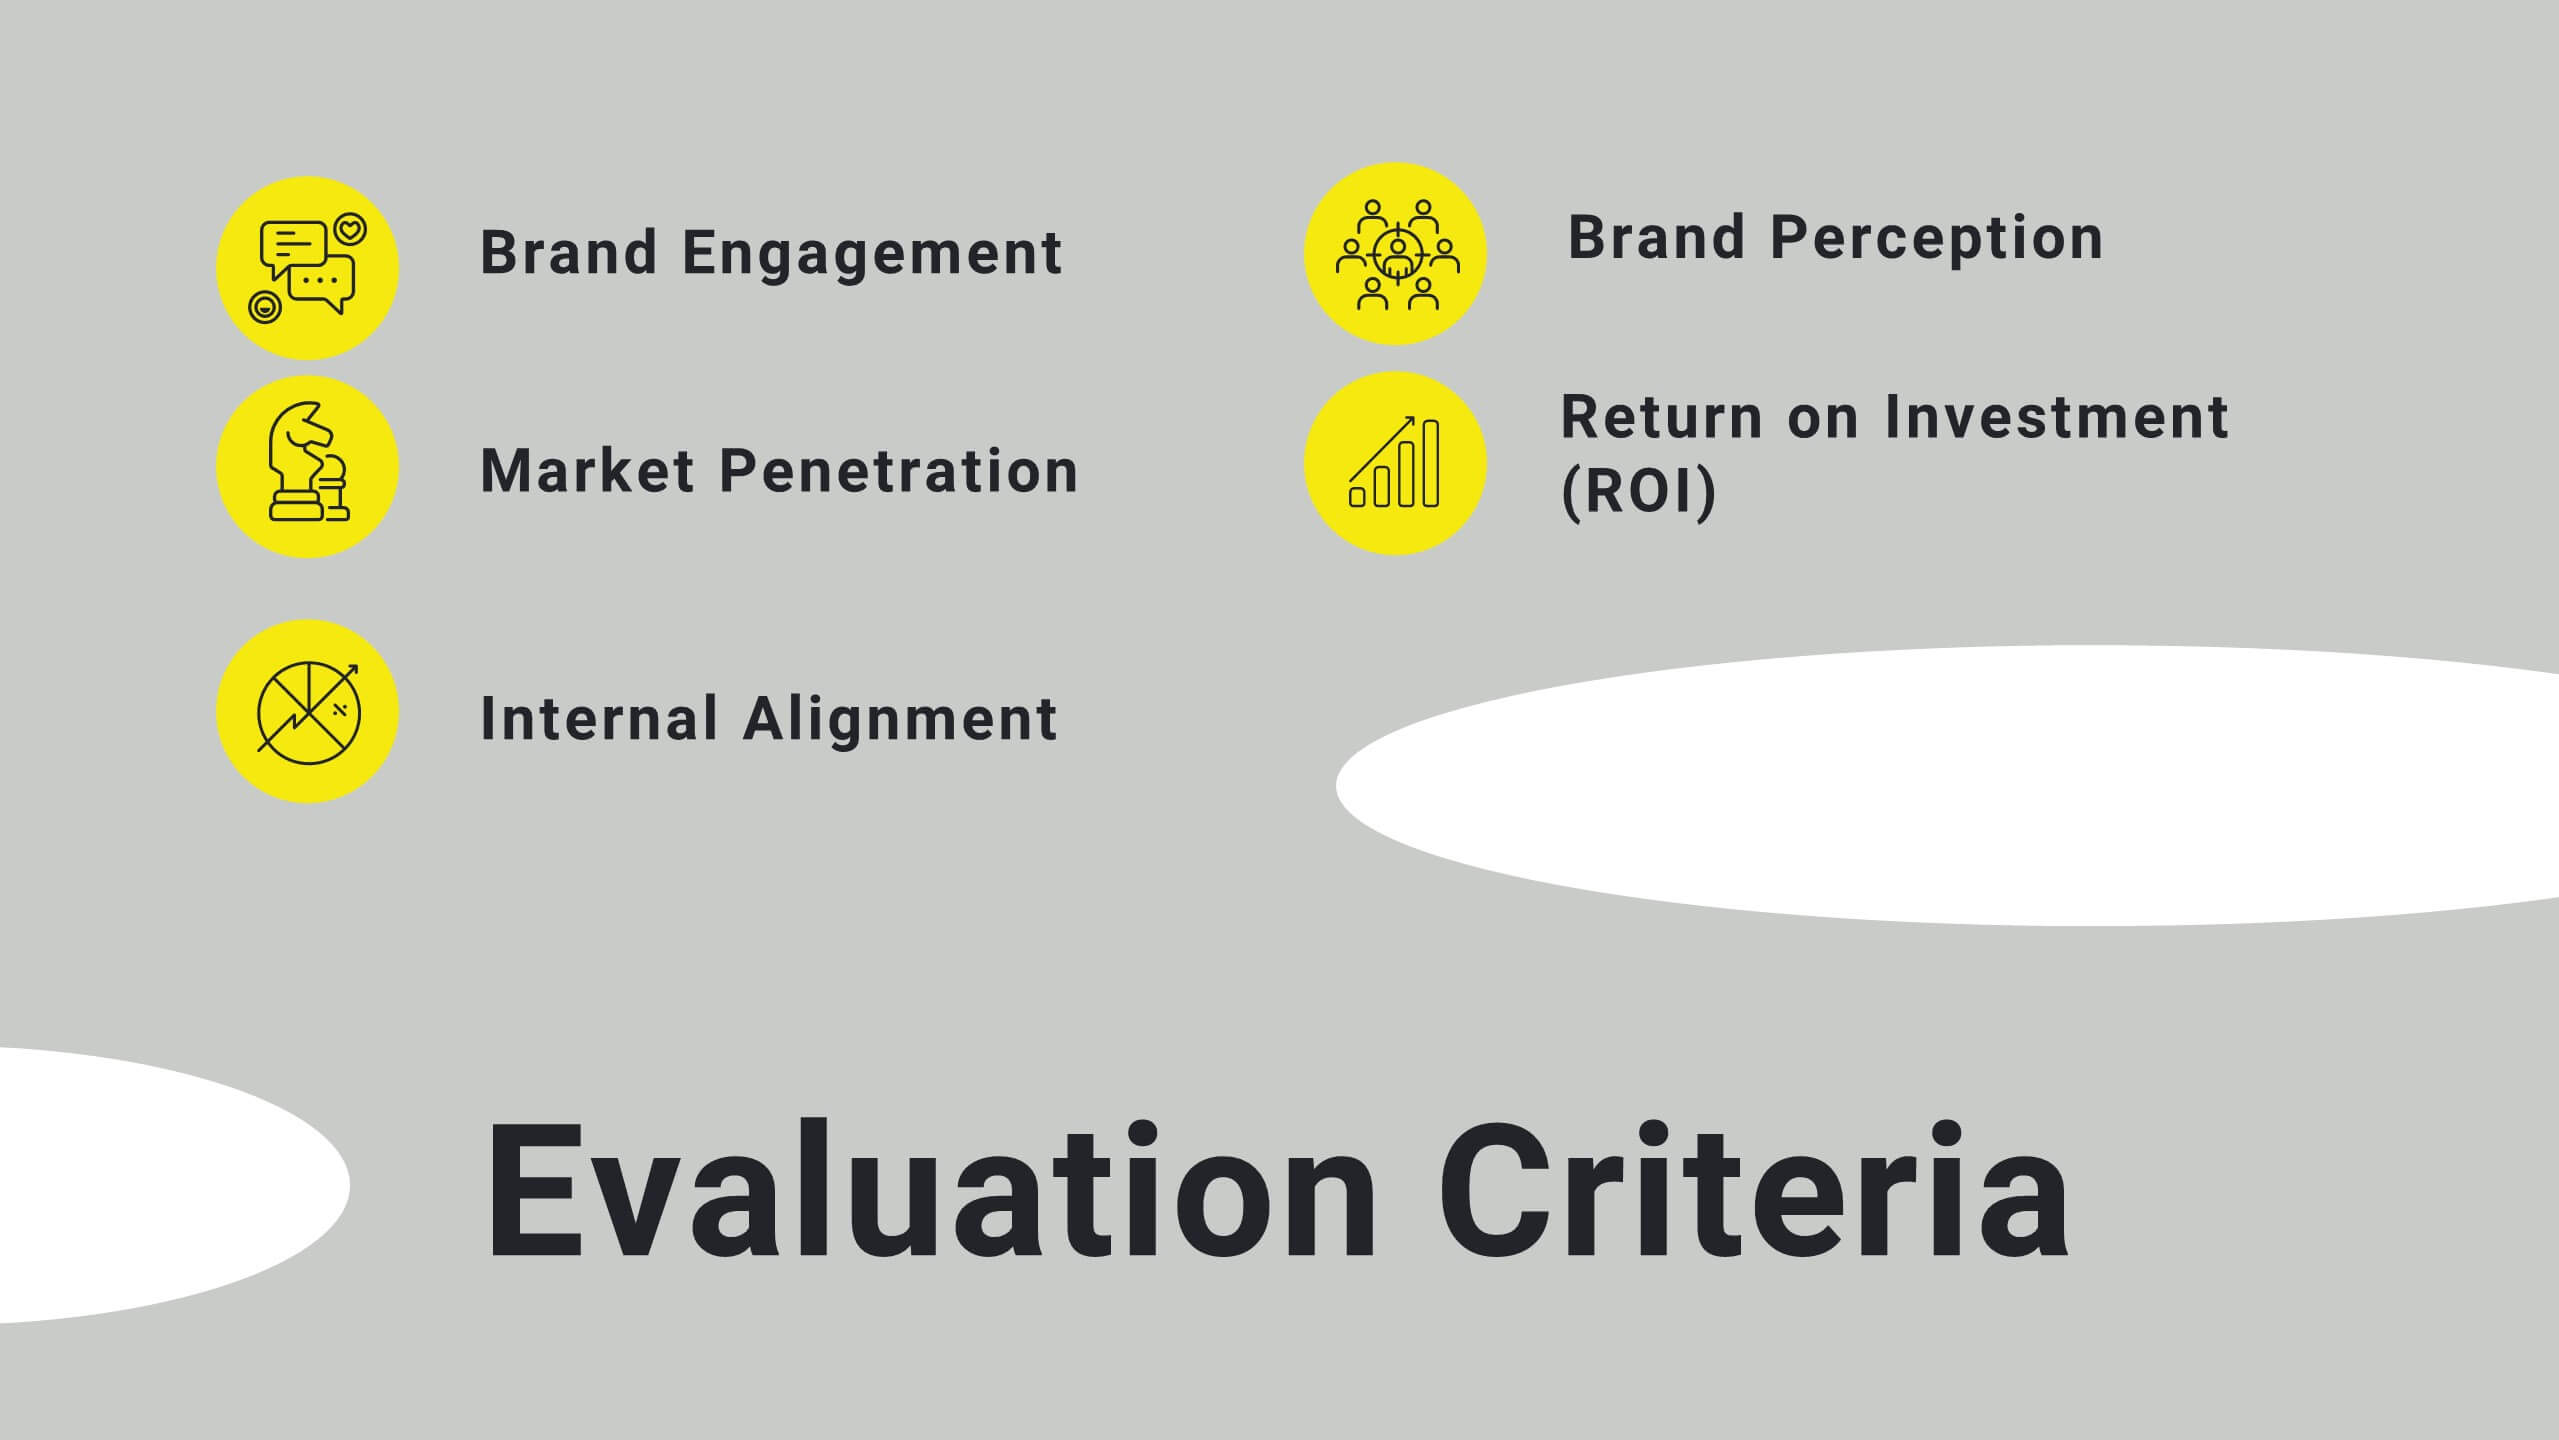
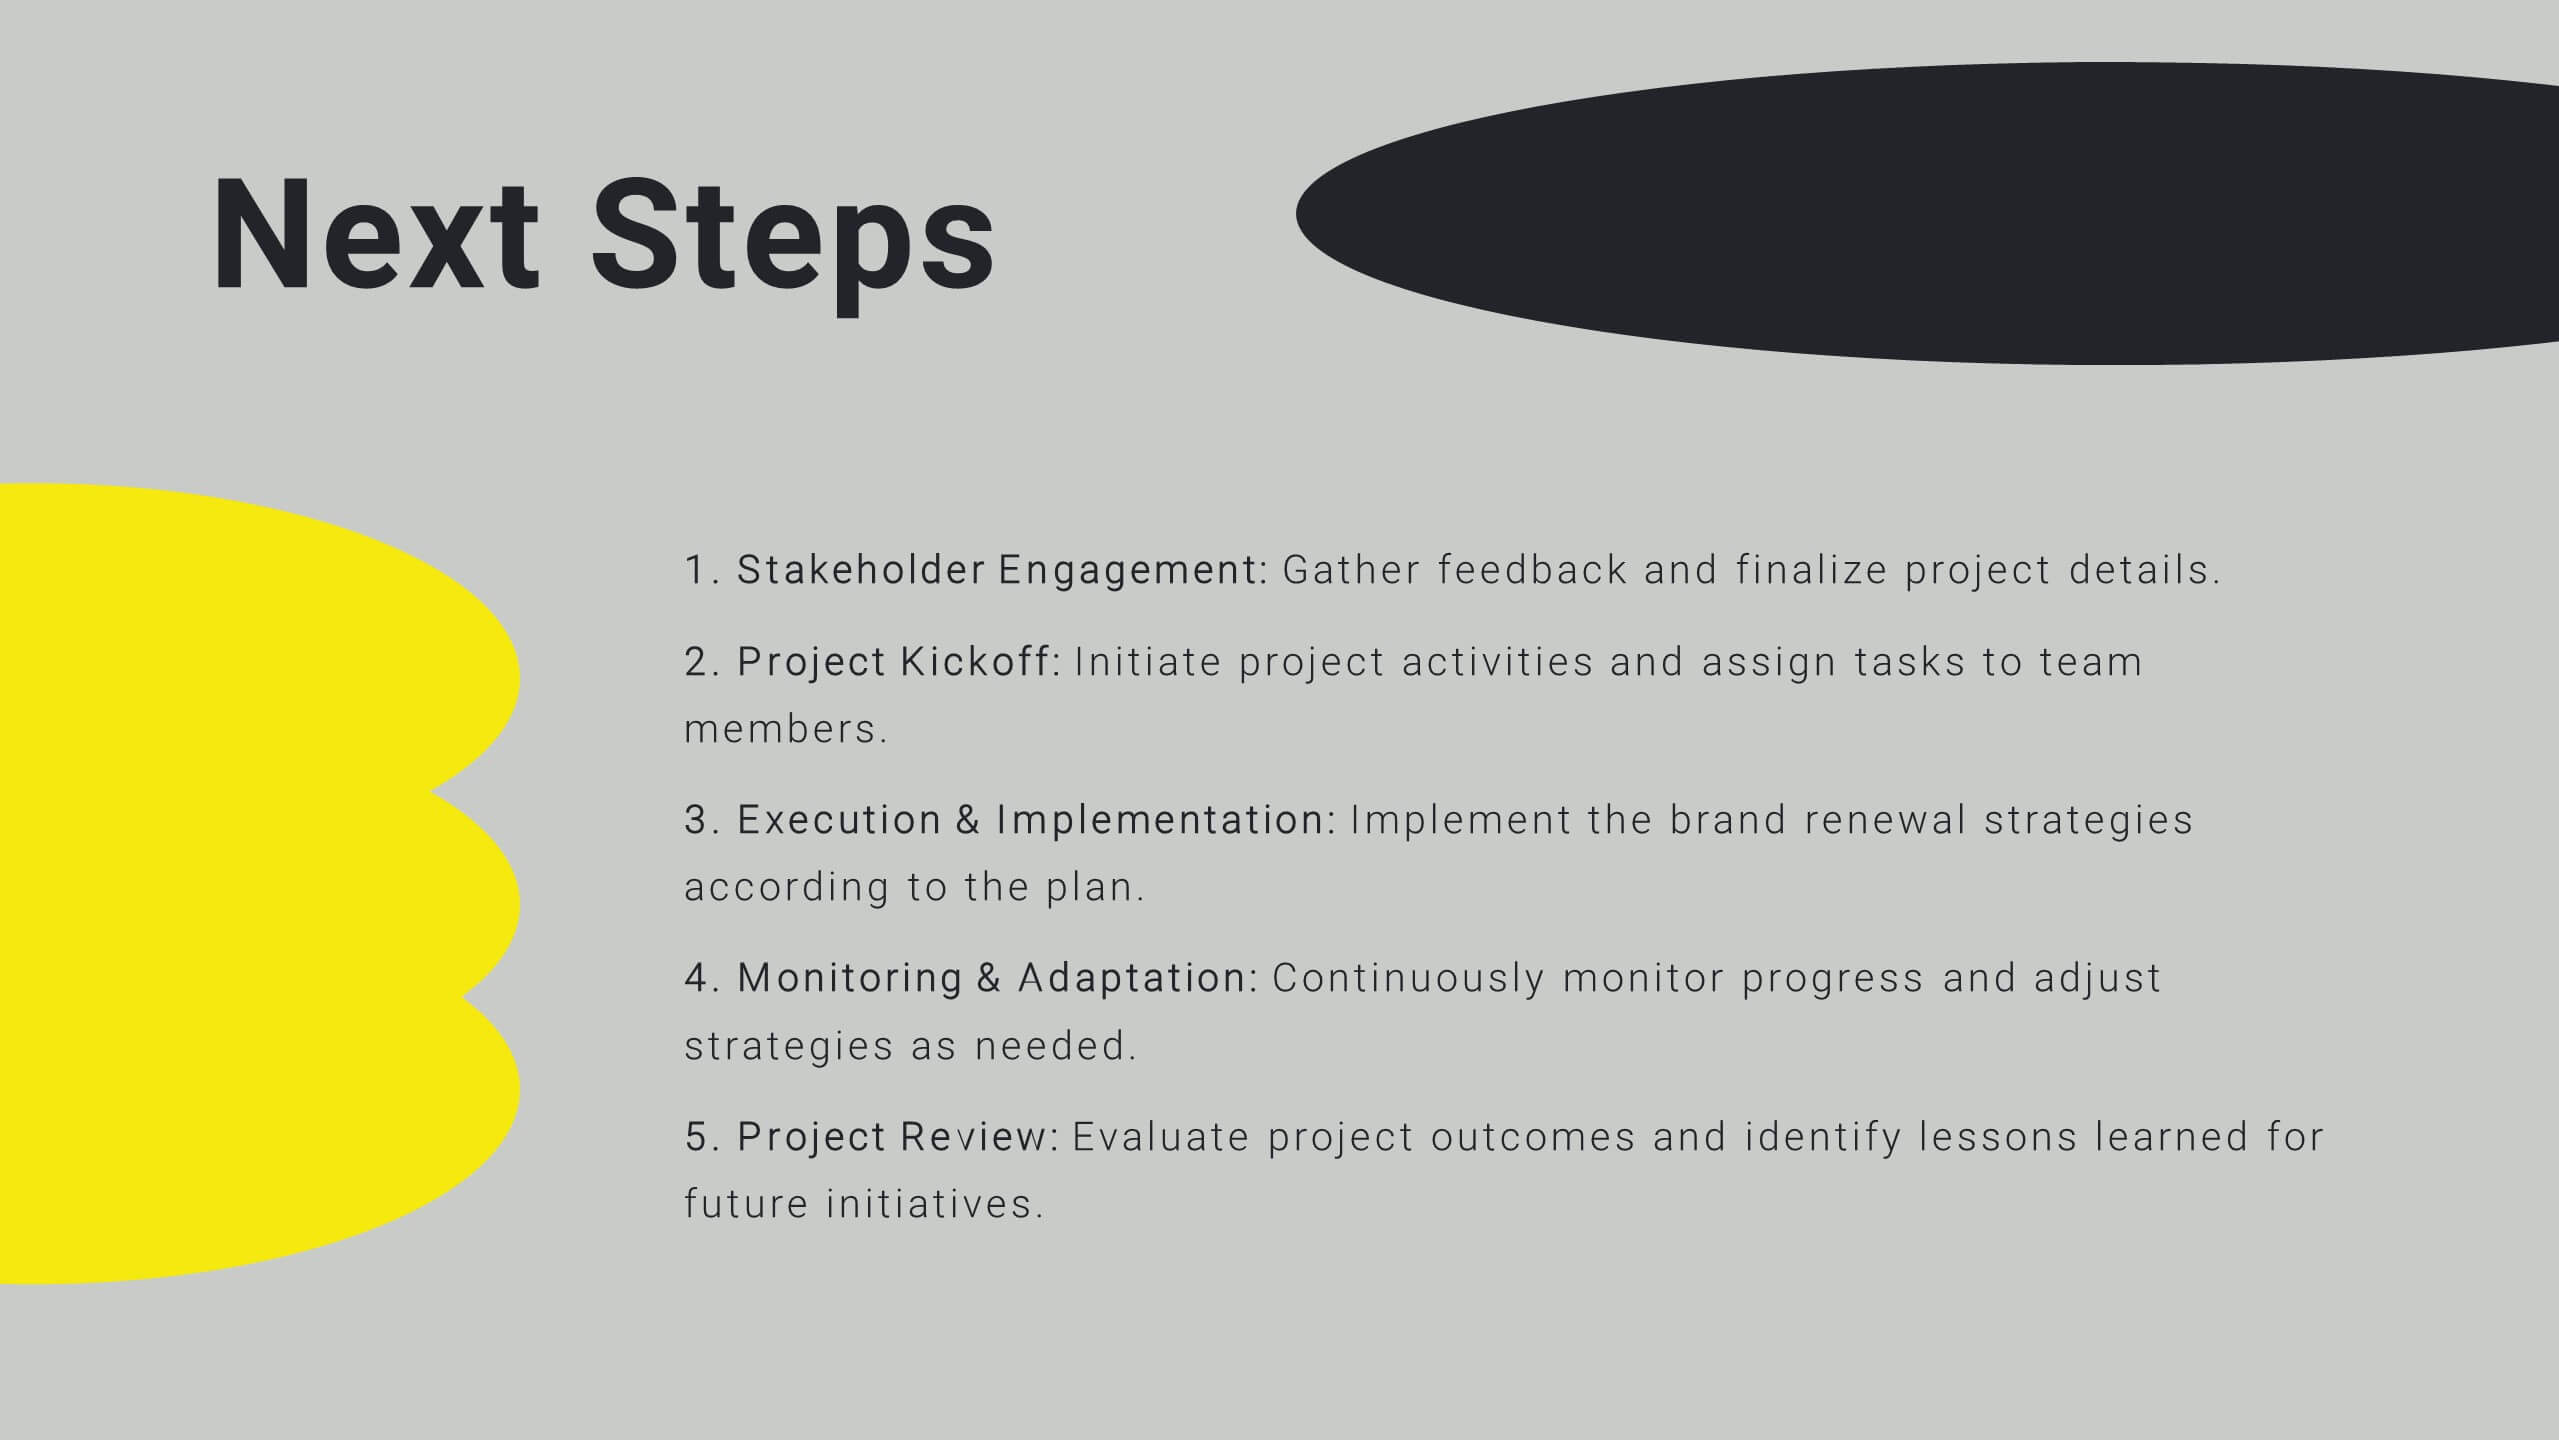
Master your project planning with this comprehensive execution plan template! Perfect for detailing project overviews, objectives, and timelines, it includes slides for budget breakdowns, resource allocation, and risk management. Ensure every detail is covered with structured content and clear visuals. Compatible with PowerPoint, Keynote, and Google Slides for seamless presentations on any platform.


5 slides
5-Level Smile Rating Presentation
Give your audience a fun, visual way to understand sentiment with this colorful rating slide. Perfect for feedback summaries, project reviews, or performance insights, it displays five clear emotion levels in a simple, engaging format. Easy to customize and fully compatible with PowerPoint, Keynote, and Google Slides.


4 slides
Business Challenge Overview Presentation
Kick off your message with a dynamic overview that makes complex challenges feel clear, visual, and manageable. This presentation helps you break down obstacles, compare factors, and guide teams toward smarter decisions with an organized, flowing layout. Fully compatible with PowerPoint, Keynote, and Google Slides.


4 slides
ABC Learning Slide Deck Presentation
Kickstart your ideas with a playful, rocket-shaped layout that turns simple ABC steps into a clear, engaging story. This presentation helps break down processes, lessons, or concepts in a way that feels intuitive and dynamic. Fully customizable and compatible with PowerPoint, Keynote, and Google Slides.


5 slides
Identifying Problems in Projects Presentation
Kickstart your analysis with a bold, colorful layout that makes uncovering project issues feel clear and structured. This presentation helps you outline challenges, compare causes, and guide teams toward practical solutions using a simple, organized flow. Fully compatible with PowerPoint, Keynote, and Google Slides.


5 slides
SMART Objectives Slide Presentation
Kick your planning into gear with a bold, structured layout that makes goal-setting feel energetic and achievable. This presentation helps you outline clear objectives, track progress, and communicate strategy with a clean, organized flow designed for teams and leaders. Fully compatible with PowerPoint, Keynote, and Google Slides.


5 slides
Clear Business Objectives Slide Presentation
Spark clarity and direction with a slide built to showcase key objectives in a straightforward, visually engaging way. This presentation helps teams define priorities, outline expected outcomes, and communicate strategic intent with ease. Perfect for planning, reporting, and leadership updates. Fully compatible with PowerPoint, Keynote, and Google Slides.


6 slides
Executive Summary Slide Deck Presentation
Kick off your message with a slide that instantly pulls everything together in a clean, engaging flow. This presentation helps you highlight key insights, outline major updates, and present essential takeaways with clarity and structure. Ideal for meetings, reports, and leadership briefs. Fully compatible with PowerPoint, Keynote, and Google Slides.


3 slides
Business Report Summary Slides Presentation
Kick off your report with a slide that feels clean, modern, and effortlessly clear. This presentation helps you summarize key insights, highlight performance updates, and present essential findings in a structured, visual format. It’s ideal for monthly reviews, strategy reports, and stakeholder updates. Fully compatible with PowerPoint, Keynote, and Google Slides.


6 slides
Key Points Overview Presentation
Bring your message to life with a slide that makes every key point feel clear, organized, and easy to follow. This presentation helps you highlight essential ideas, compare insights, and simplify complex information for any audience. Perfect for meetings, reports, or strategy updates. Fully compatible with PowerPoint, Keynote, and Google Slides.


4 slides
AIDA Marketing Funnel Slide Presentation
Capture attention from the very first slide with a bold, structured layout that turns each stage of your message into a clear, engaging flow. This presentation helps simplify complex decision paths and guide viewers through each step with ease. Fully editable and compatible with PowerPoint, Keynote, and Google Slides.
5 slides
Feedback Rating Smile Icons Presentation
Light up your presentation with a playful visual that turns audience feedback into clear, colorful insights. This slide helps you compare ratings, highlight sentiment patterns, and present review data in a friendly, memorable way. Perfect for surveys, reports, and performance reviews. Fully compatible with PowerPoint, Keynote, and Google Slides.


10 slides
AIDA Model Explained with Graphics Presentation
Bring your message to life with a dynamic visual flow that guides viewers through each stage of your communication strategy in a clear, compelling way. This presentation breaks complex concepts into simple steps, helping audiences follow your narrative effortlessly. Fully customizable and compatible with PowerPoint, Keynote, and Google Slides.


5 slides
A to Z Slide Concept Presentation
Bring your ideas to life with a bold, block-style visual that makes complex concepts feel simple and structured. This slide is perfect for breaking down processes, frameworks, or step-by-step explanations in a clear, memorable way. Fully editable and compatible with PowerPoint, Keynote, and Google Slides.


6 slides
Numeric Data Slide Layout Presentation
Bring your numbers to life with a clean, flowing visual that turns data into an easy-to-follow story. This presentation guides viewers through each step of your process, helping them understand key insights without overwhelm. Ideal for analytics, reporting, and planning. Fully compatible with PowerPoint, Keynote, and Google Slides.


5 slides
Problem Statement Slide Presentation
Kick off your presentation with a bold, curiosity-driven slide that clearly defines the challenge your team aims to solve. This layout helps you outline key points, clarify project direction, and focus decision-making with clarity and impact. Fully compatible with PowerPoint, Keynote, and Google Slides.


5 slides
Project Goals and Objectives Presentation
Bring clarity and momentum to your planning with a slide that highlights goals and aligns them with clear, actionable objectives. This presentation helps teams define priorities, communicate expectations, and track progress with a clean, structured layout built for any project. Fully compatible with PowerPoint, Keynote, and Google Slides.


6 slides
Customer Satisfaction Smile Chart Presentation
Bring your data to life with a slide that instantly shows how customers feel, blending clean visuals with an intuitive emotion scale. This presentation helps you communicate feedback trends, highlight satisfaction levels, and support decision-making with clarity. Ideal for reports, reviews, and strategy updates. Fully compatible with PowerPoint, Keynote, and Google Slides.


12 slides
Attention Interest Desire Actions Presentation
Spark curiosity from the very first slide with a bold, layered visual that turns complex ideas into a clear, memorable journey. This presentation walks viewers through each stage of your message, helping you build momentum and guide decisions with ease. Fully editable and compatible with PowerPoint, Keynote, and Google Slides.


6 slides
Numbered Steps Diagram Presentation
Watch your workflow come to life as each step rises in a clean, structured path that makes progress easy to follow. This presentation guides audiences through sequential actions with clarity, helping simplify processes, plans, or instructions. Perfect for business, training, or project teams. Fully compatible with PowerPoint, Keynote, and Google Slides.


5 slides
Innovation Framework Presentation
Turn bold ideas into structured success with this engaging presentation design. Perfect for mapping creative processes, innovation systems, and project development stages, it helps present ideas clearly and visually. Fully editable and easy to customize, this presentation is compatible with PowerPoint, Keynote, and Google Slides for effortless use.


5 slides
Circular Wheel for Process Flow
Visualize five interconnected stages or phases in a clean, circular layout. Ideal for presenting workflows, continuous cycles, or recurring business processes with clarity and structure. Easily customizable in PowerPoint, Keynote, and Google Slides to match your project needs.
- 1
- 2
- 3
- 4
- 5
- 6
- 176