


Features
- 22 Unique slides
- Fully editable and easy to edit in Microsoft Powerpoint, Keynote and Google Slides
- 16:9 widescreen layout
- Clean and professional designs
- Export to JPG, PDF or send by email


Do you have any questions?
Recommend


4 slides
Human Resources Strategy and Talent Plan Presentation
Enhance workforce planning and recruitment efforts with the Human Resources Strategy and Talent Plan template. Featuring a circular infographic layout, this design is ideal for showcasing hiring stages, talent development, and HR strategies. Fully customizable in Canva, PowerPoint, and Google Slides to align with organizational goals and brand identity.


5 slides
Population Segmentation by Demographic Factors Presentation
Break down audience demographics with this segmented infographic slide. Featuring a vertical figure illustration divided into color-coded percentage bars, it’s ideal for showcasing traits like age, gender, or location. This layout offers a clear visual summary, making it perfect for reports, marketing briefs, or investor presentations. Fully editable in Canva.


6 slides
Professional Company Portfolio Presentation
Showcase Your Business Success with a Sleek Portfolio! The Professional Company Portfolio template is designed to highlight key achievements, performance metrics, and strategic insights with a modern, image-driven layout. Featuring three visually appealing sections, this template allows you to present KPIs, revenue growth, and business milestones in a compelling and structured way. Fully customizable in PowerPoint, Keynote, and Google Slides, this portfolio template is perfect for presentations, investor updates, and corporate showcases.


5 slides
Company Origin and Growth History Presentation
Showcase your company’s journey with the Company Origin and Growth History Presentation. This visual step diagram is ideal for illustrating key milestones, business expansion, or historical achievements. Perfect for pitch decks, annual reports, or investor updates. Fully editable in Canva, PowerPoint, Keynote, and Google Slides for seamless customization.


5 slides
Business Travel Logistics Plan Presentation
Plan and present business travel operations with clarity using this Business Travel Logistics Plan Presentation. Designed around a global layout with visual transport icons, this slide helps outline travel modes, routes, and logistics points. Ideal for corporate travel managers, event organizers, and logistics teams. Fully editable in PowerPoint, Keynote, and Google Slides.


6 slides
Major World History Milestones Presentation
Highlight significant events in a visually engaging way with this horizontal timeline template. Featuring clean icons, color-coded markers, and spacious text areas, it’s ideal for showcasing historical sequences, educational lectures, or research summaries. Fully editable in PowerPoint, Keynote, and Google Slides for customized storytelling and clear chronological impact.


5 slides
Industry Competition Assessment with Porter’s Forces Presentation
Present your competitive landscape with this Porter’s Five Forces slide. Designed for strategic analysis, it visually maps key industry forces—New Entrants, Supplier Power, Buyer Power, Substitutes, and Competitive Rivalry—around a central business icon. Fully customizable and ideal for PowerPoint, Keynote, or Google Slides to elevate professional presentations.


6 slides
Business Process Improvement via Six Sigma Presentation
Present your process improvement journey with clarity using the Business Process Improvement via Six Sigma Presentation. This linear DMAIC layout guides your audience through each essential phase—Define, Measure, Analyze, Improve, and Control—making it perfect for Lean Six Sigma professionals and operational efficiency teams. Fully editable in PowerPoint, Keynote, Canva, and Google Slides.


6 slides
Business Value Chain Strategy Presentation
Optimize Business Processes with a Seamless Flow using this Business Value Chain Strategy presentation template. Designed to visualize key activities in a structured, interconnected format, this template helps highlight value-adding processes, strategic improvements, and operational efficiencies. Featuring a chain-linked design, dynamic colors, and customizable text placeholders, this template is perfect for business strategists, process analysts, and executive teams. Fully editable and compatible with PowerPoint, Keynote, and Google Slides, making it an essential tool for clear, impactful presentations.


10 slides
Modern Healthcare Technology Trends Presentation
Highlight innovations in healthcare with the Modern Healthcare Technology Trends Presentation. This slide features a central device graphic connected to four key icons, perfect for showcasing digital tools, emerging trends, or medical tech strategies. Fully customizable in Canva, PowerPoint, Keynote, and Google Slides—ideal for medical tech briefings and strategic presentations.


20 slides
Feronia Marketing Proposal Presentation
Present your marketing strategy with this visually engaging proposal deck, featuring sections on objectives, methodology, budget breakdown, and client testimonials. Ideal for structured presentations, it’s compatible with PowerPoint, Keynote, and Google Slides, offering a flexible format to captivate and convince clients or stakeholders.


25 slides
Jasper Rebranding Project Plan Presentation
Elevate your brand transformation with this sleek rebranding presentation template! It covers everything from mission and values to market analysis and brand positioning. Perfect for showcasing your brand guidelines and touchpoints. Fully customizable, and compatible with PowerPoint, Keynote, and Google Slides, making your rebranding process seamless and professional.


4 slides
Economic Trends and Analysis of North America Map Presentation
Present key regional insights with this North America economic analysis map. Compare up to four locations using percentage stats and customizable titles. Ideal for showcasing market trends, financial metrics, or growth data. Fully editable in PowerPoint, Keynote, and Google Slides—perfect for economic forecasts, business reports, or strategy meetings.


20 slides
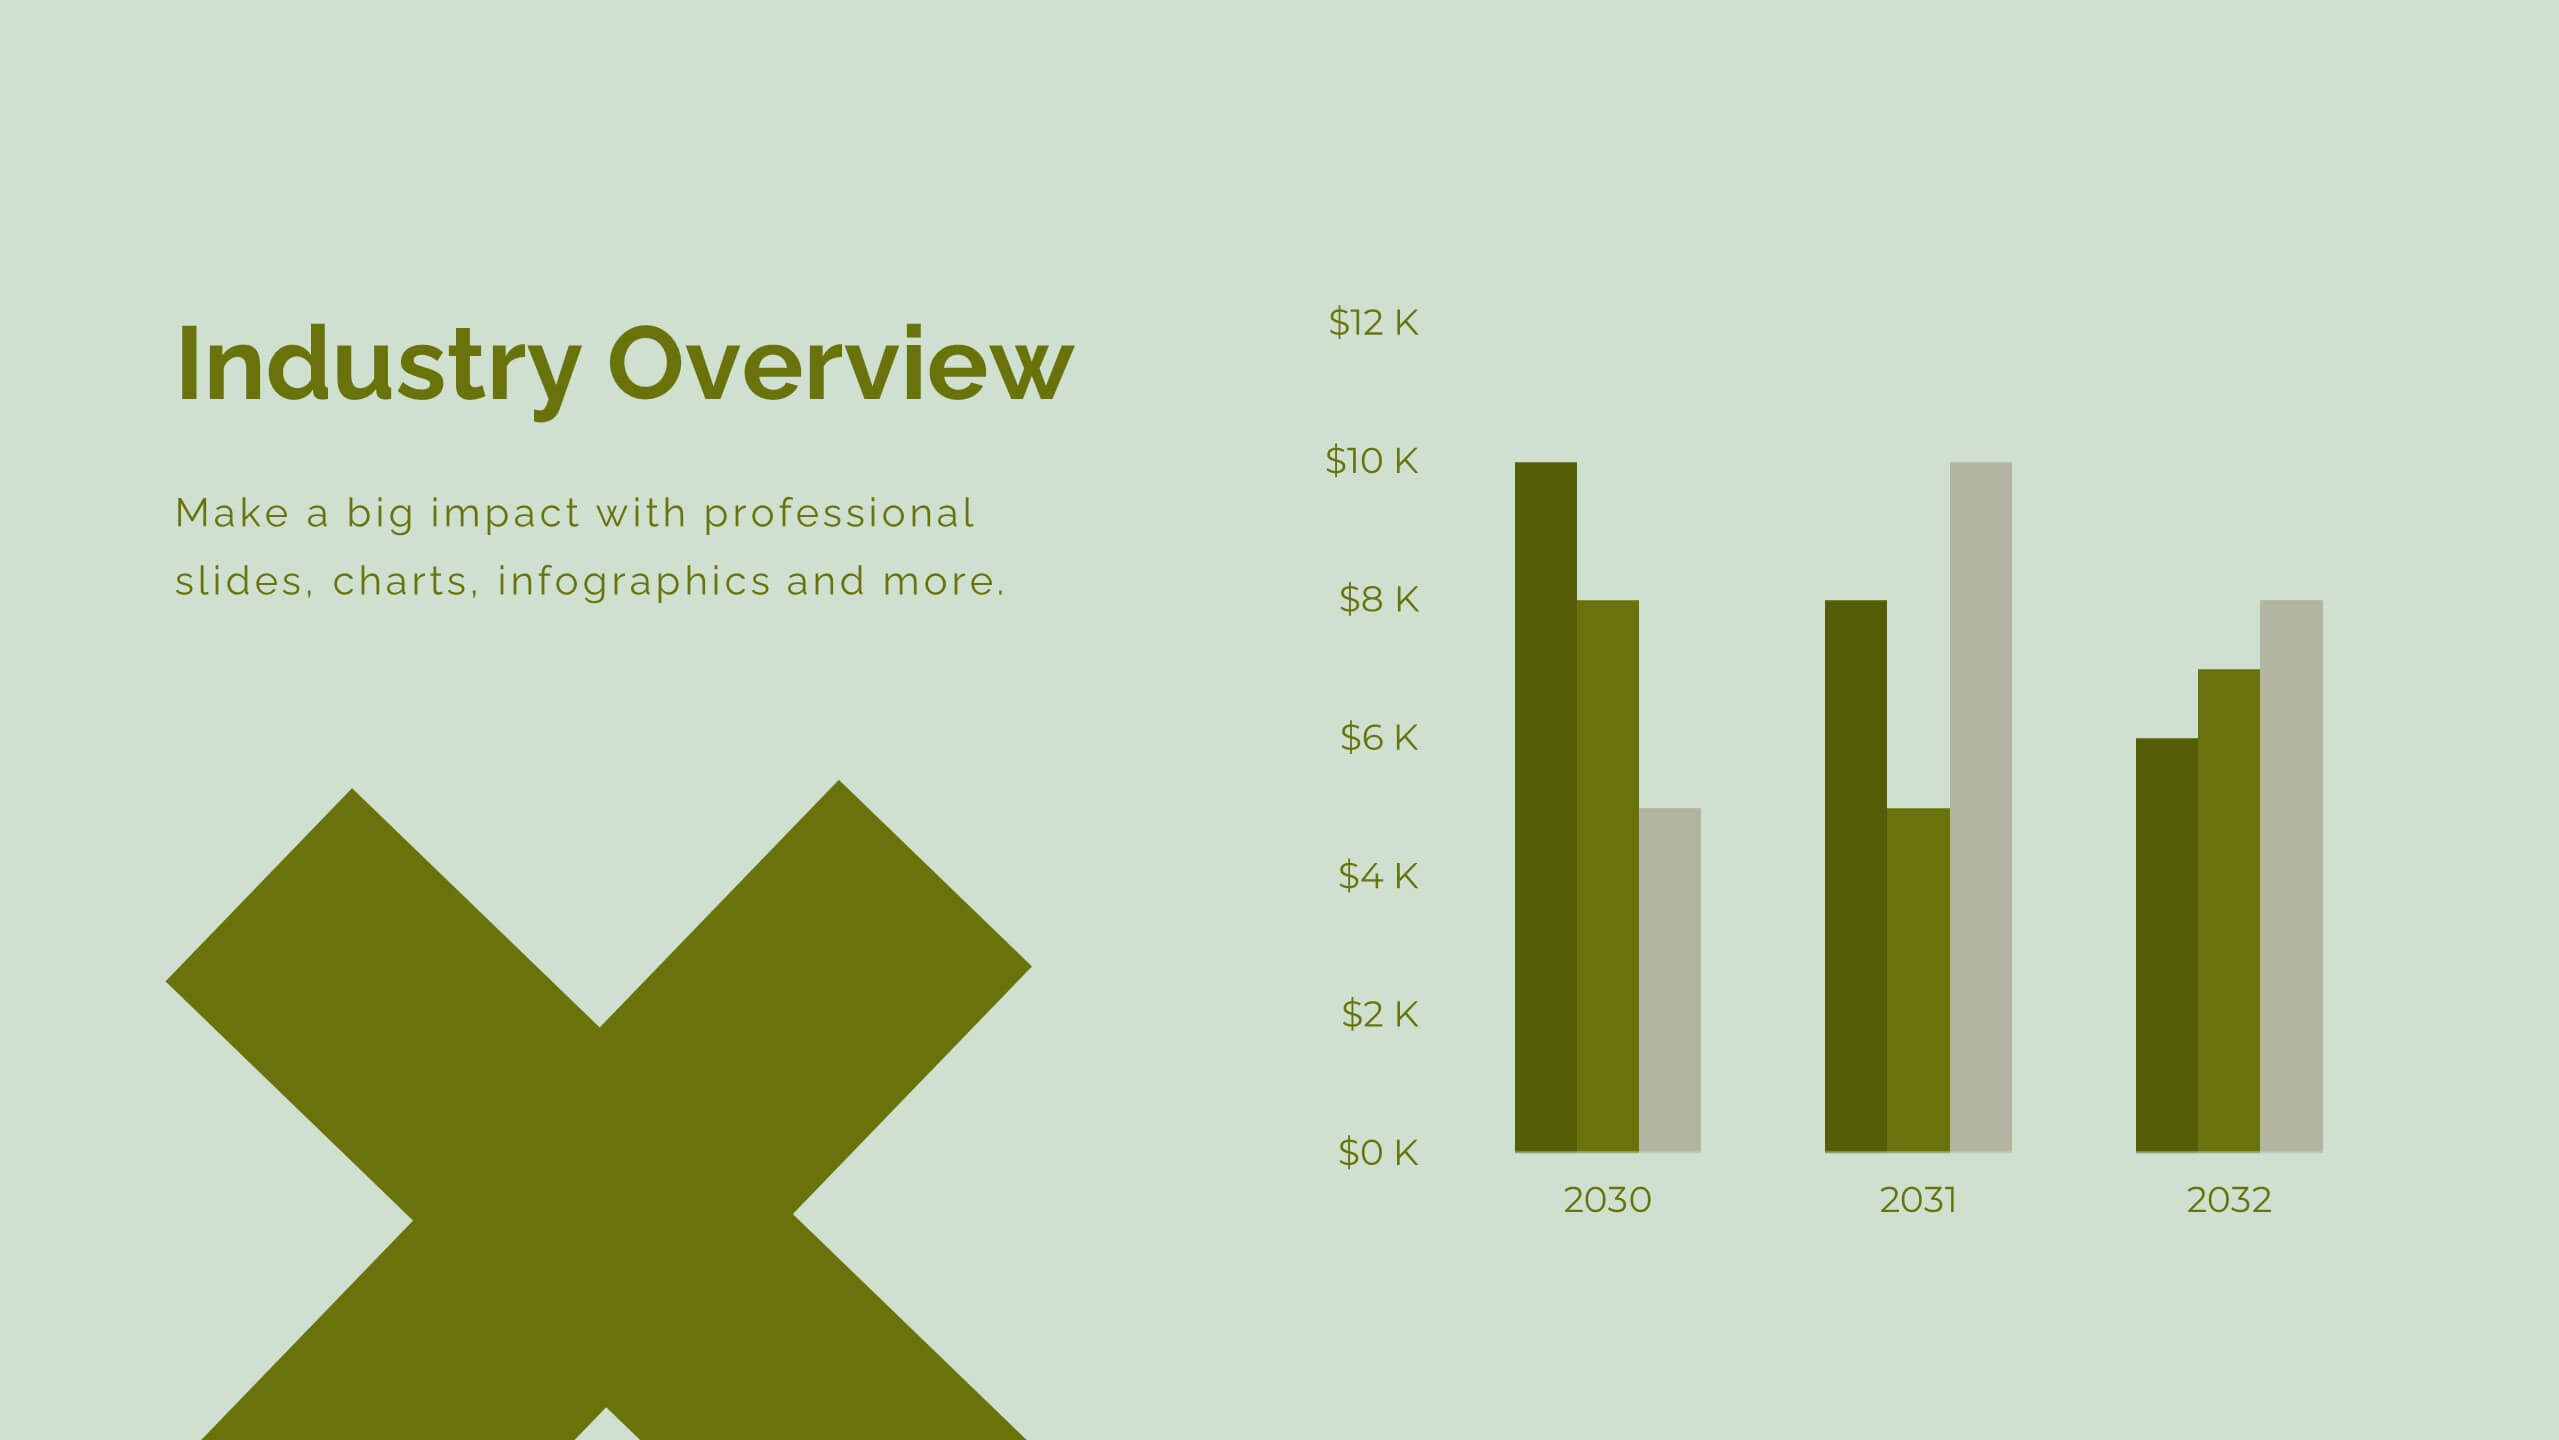
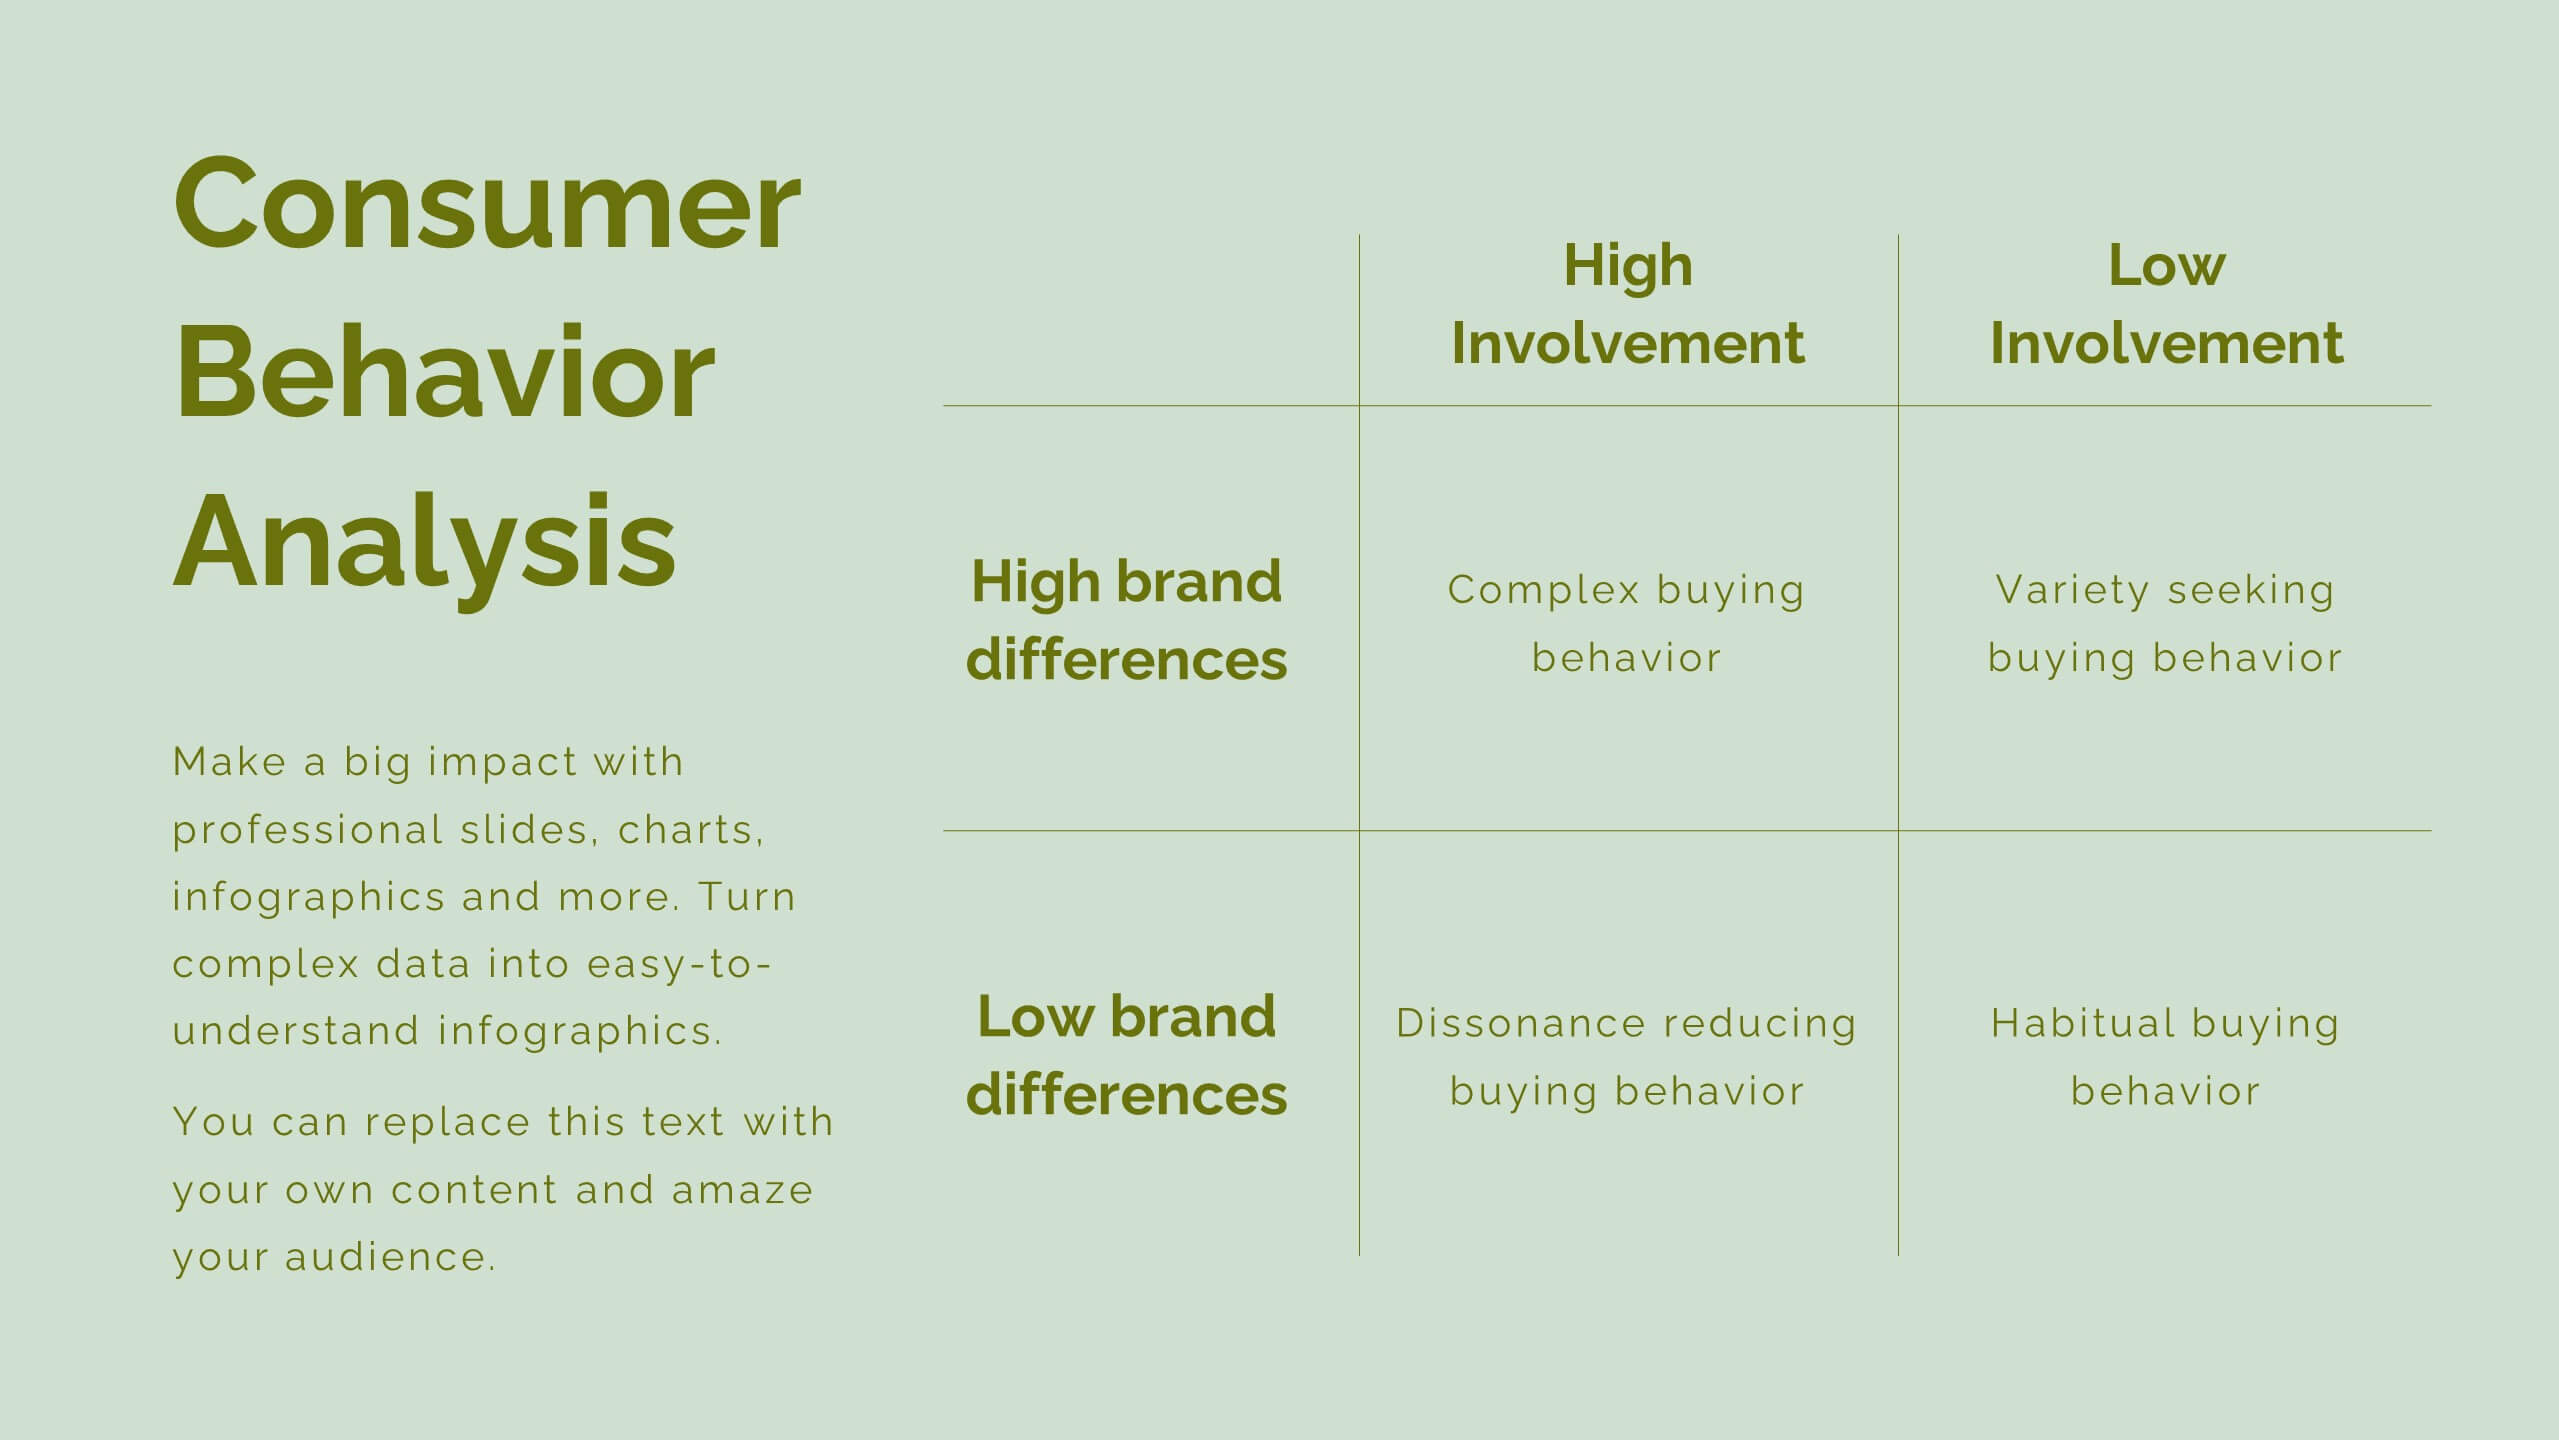
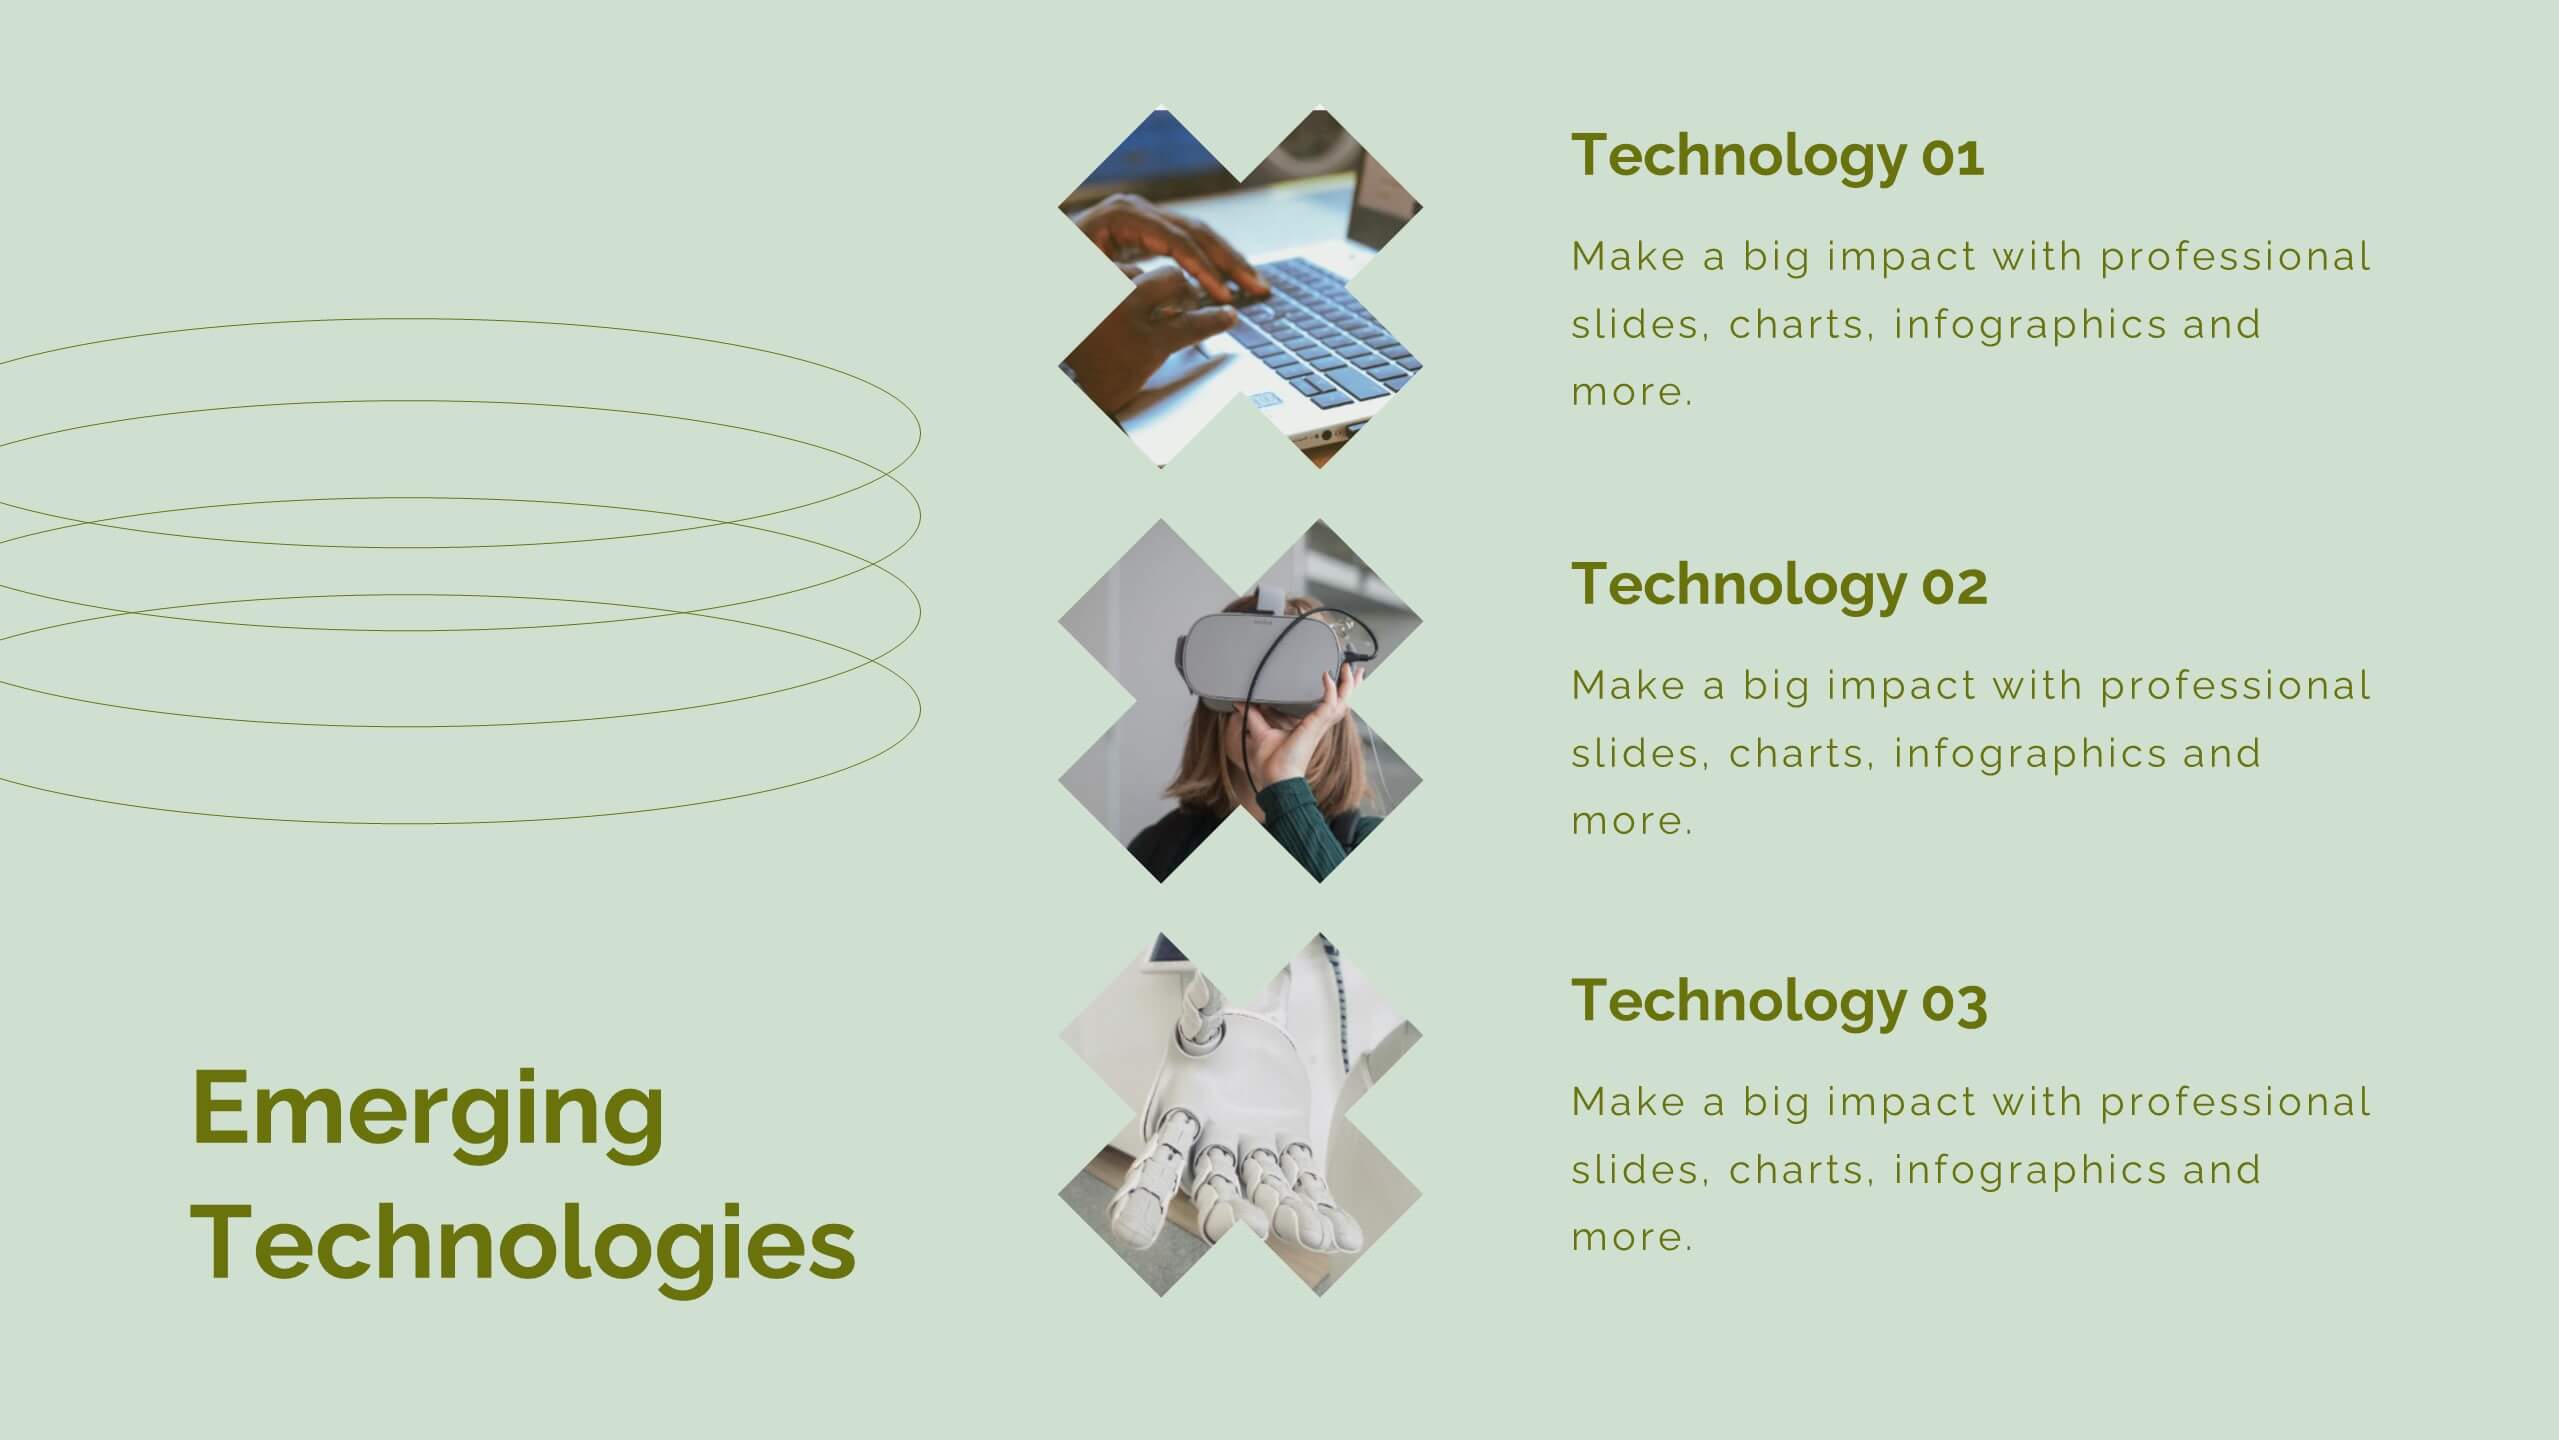
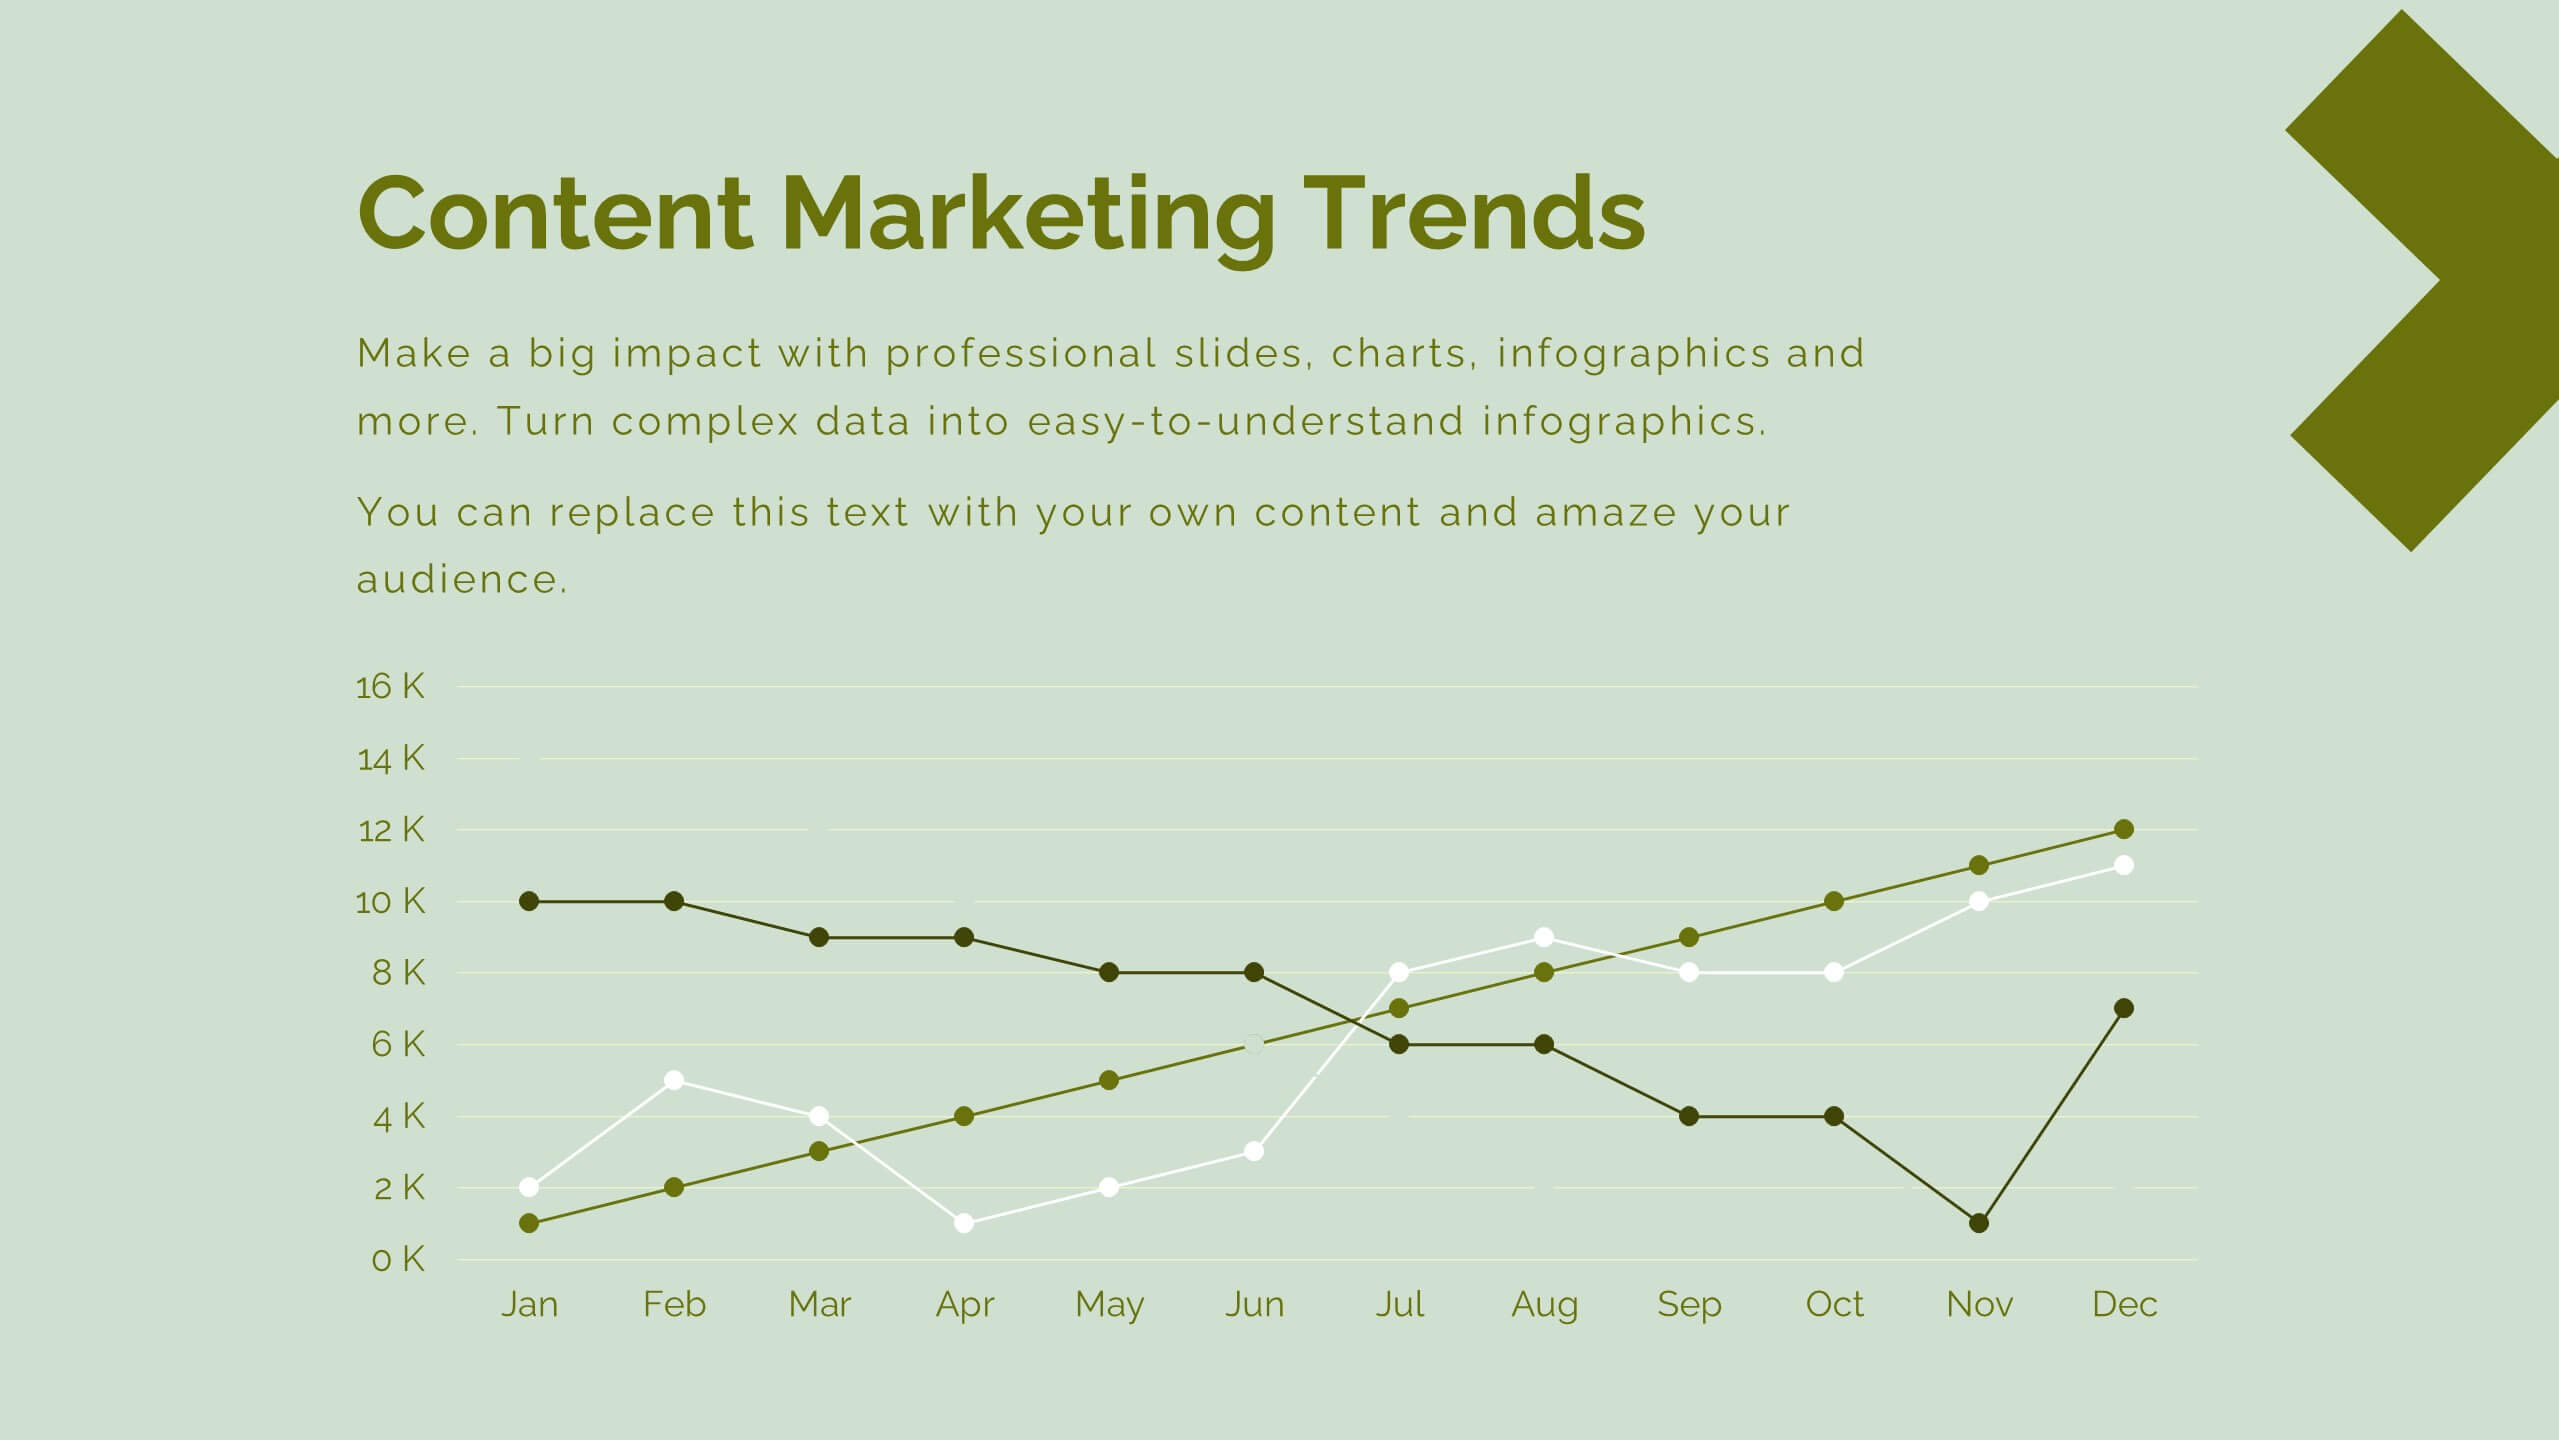
Aura Digital Marketing Strategy Plan Presentation
Revamp your digital marketing strategies with this dynamic template! Covering everything from industry overviews and consumer behavior analysis to emerging technologies and social media strategies, this template has it all. Perfect for creating compelling presentations that highlight data-driven marketing and brand storytelling. Compatible with PowerPoint, Keynote, and Google Slides.


26 slides
Shooting Star Brand Identity Presentation
Step into the world of brand identity with this dynamic presentation that brings your brand story to life! From vision and mission statements to audience personas, this template covers all key elements essential for brand development. Easily customizable, it’s perfect for PowerPoint, Keynote, and Google Slides, making your branding pitch a breeze.


6 slides
Project Roadmap with Strategic Phases Presentation
Visually guide your team through every phase with the Project Roadmap with Strategic Phases Presentation. This template features a curved arrow layout to illustrate project milestones, making it perfect for planning, strategy, or progress updates. Fully customizable in PowerPoint, Google Slides, and Canva for seamless integration into any workflow.


6 slides
Employee Welcome and Orientation Guide Presentation
Welcome new hires with clarity using the Employee Welcome and Orientation Guide Presentation. Featuring a timeline-style layout with flag icons, this design helps outline key onboarding stages—from introductions and training to policies and first-week expectations. Easy to customize in Canva, PowerPoint, Keynote, or Google Slides for a smooth employee experience.