Search results for technology
Explora 545 plantillas


5 diapositivas
Cloud Technology Architecture Presentation
Visualize the power of modern connectivity with this clean and professional template designed to explain digital systems, cloud layers, and data flow. Ideal for tech teams and IT presentations, it simplifies complex information into clear visuals. Fully editable and compatible with PowerPoint, Keynote, and Google Slides for effortless customization.


6 diapositivas
Technology Trends Overview Presentation
Step into the future with a sleek visual that maps out emerging ideas in a way anyone can follow. This presentation helps you break down key innovations, highlight major shifts, and explain how new technologies influence your strategy. Ideal for reports and trend discussions. Fully compatible with PowerPoint, Keynote, and Google Slides.


4 diapositivas
Technology Device Mockup Presentation
Bring your ideas to life with a sleek, modern slide that showcases your digital product in a clean smartphone mockup. This presentation explains key features or app benefits with clear, structured text that keeps your message focused and professional. Fully compatible with PowerPoint, Keynote, and Google Slides for easy editing and use.


4 diapositivas
5G Technology and Network Rollout Presentation
Level up your tech story with a clear, engaging visual that shows the evolution of mobile networks in a simple, forward-moving flow. This presentation helps you explain upgrades, timelines, and deployment plans with clarity and confidence. Fully compatible with PowerPoint, Keynote, and Google Slides.


6 diapositivas
5G Technology Rollout and Future Vision Presentation
From 1G to 5G, tell the story of progress with this visually engaging infographic slide. Perfect for showcasing mobile network evolution, telecom innovation, or digital transformation strategies, each stage is clearly marked for simple, informative storytelling. Fully compatible with PowerPoint, Keynote, and Google Slides for easy editing and seamless presentation.


4 diapositivas
Service Plan Pricing Matrix Presentation
Present your pricing options clearly with this Service Plan Pricing Matrix Presentation. Designed for easy comparison, this layout highlights four tiers—Basic, Standard, Professional, and Expert—with bold pricing, checklists, and CTA buttons. Ideal for service providers, SaaS, and agencies. Fully editable in Canva, PowerPoint, Keynote, and Google Slides.


6 diapositivas
Credit Card Comparison and Features Presentation
Make your decision-making effortless with this bright and visual template that helps you break down features, perks, and details of different cards in one glance. Perfect for financial presentations or product comparisons, it clearly illustrates credit card benefits side by side. Fully compatible with PowerPoint, Keynote, and Google Slides.


5 diapositivas
Employee Onboarding Training Roadmap Presentation
Visualize your training journey with the Employee Onboarding Training Roadmap Presentation. This layout uses a road-style timeline with trucks to represent each step of the onboarding process—perfect for outlining key milestones, training modules, or departmental introductions. Fully editable in PowerPoint, Keynote, Google Slides, or Canva.


5 diapositivas
User Experience Empathy Map Strategy Presentation
Step into the user’s mindset with the User Experience Empathy Map Strategy Presentation. This template helps you visualize your audience’s thoughts, feelings, behaviors, and perceptions using a structured empathy map format. Ideal for UX workshops, customer journey analysis, or product design strategy sessions. Fully customizable in PowerPoint, Keynote, Canva, and Google Slides.


7 diapositivas
Strategic Highlights Executive Summary Presentation
Showcase your business priorities with the Strategic Highlights Executive Summary Presentation. This layout features up to seven colorful, clearly labeled content blocks—perfect for summarizing goals, KPIs, initiatives, or focus areas. Easy to edit in PowerPoint, Keynote, Google Slides, or Canva for quick customization and clean executive reporting.


6 diapositivas
Big Data Insights Visual Presentation
Transform complex analytics into clear, engaging visuals that tell a compelling story. This modern layout is perfect for showcasing data connections, performance metrics, and analytical insights in a visually balanced way. Fully editable and compatible with PowerPoint, Keynote, and Google Slides for seamless customization and professional presentations.


6 diapositivas
Business Network Diagram Presentation
Bring your digital ecosystem to life with this modern presentation design. Ideal for showcasing system connections, IT workflows, or organizational networks, it helps visualize how key components interact seamlessly. Clean, structured, and fully customizable—compatible with PowerPoint, Keynote, and Google Slides for a professional and cohesive presentation every time.
5 diapositivas
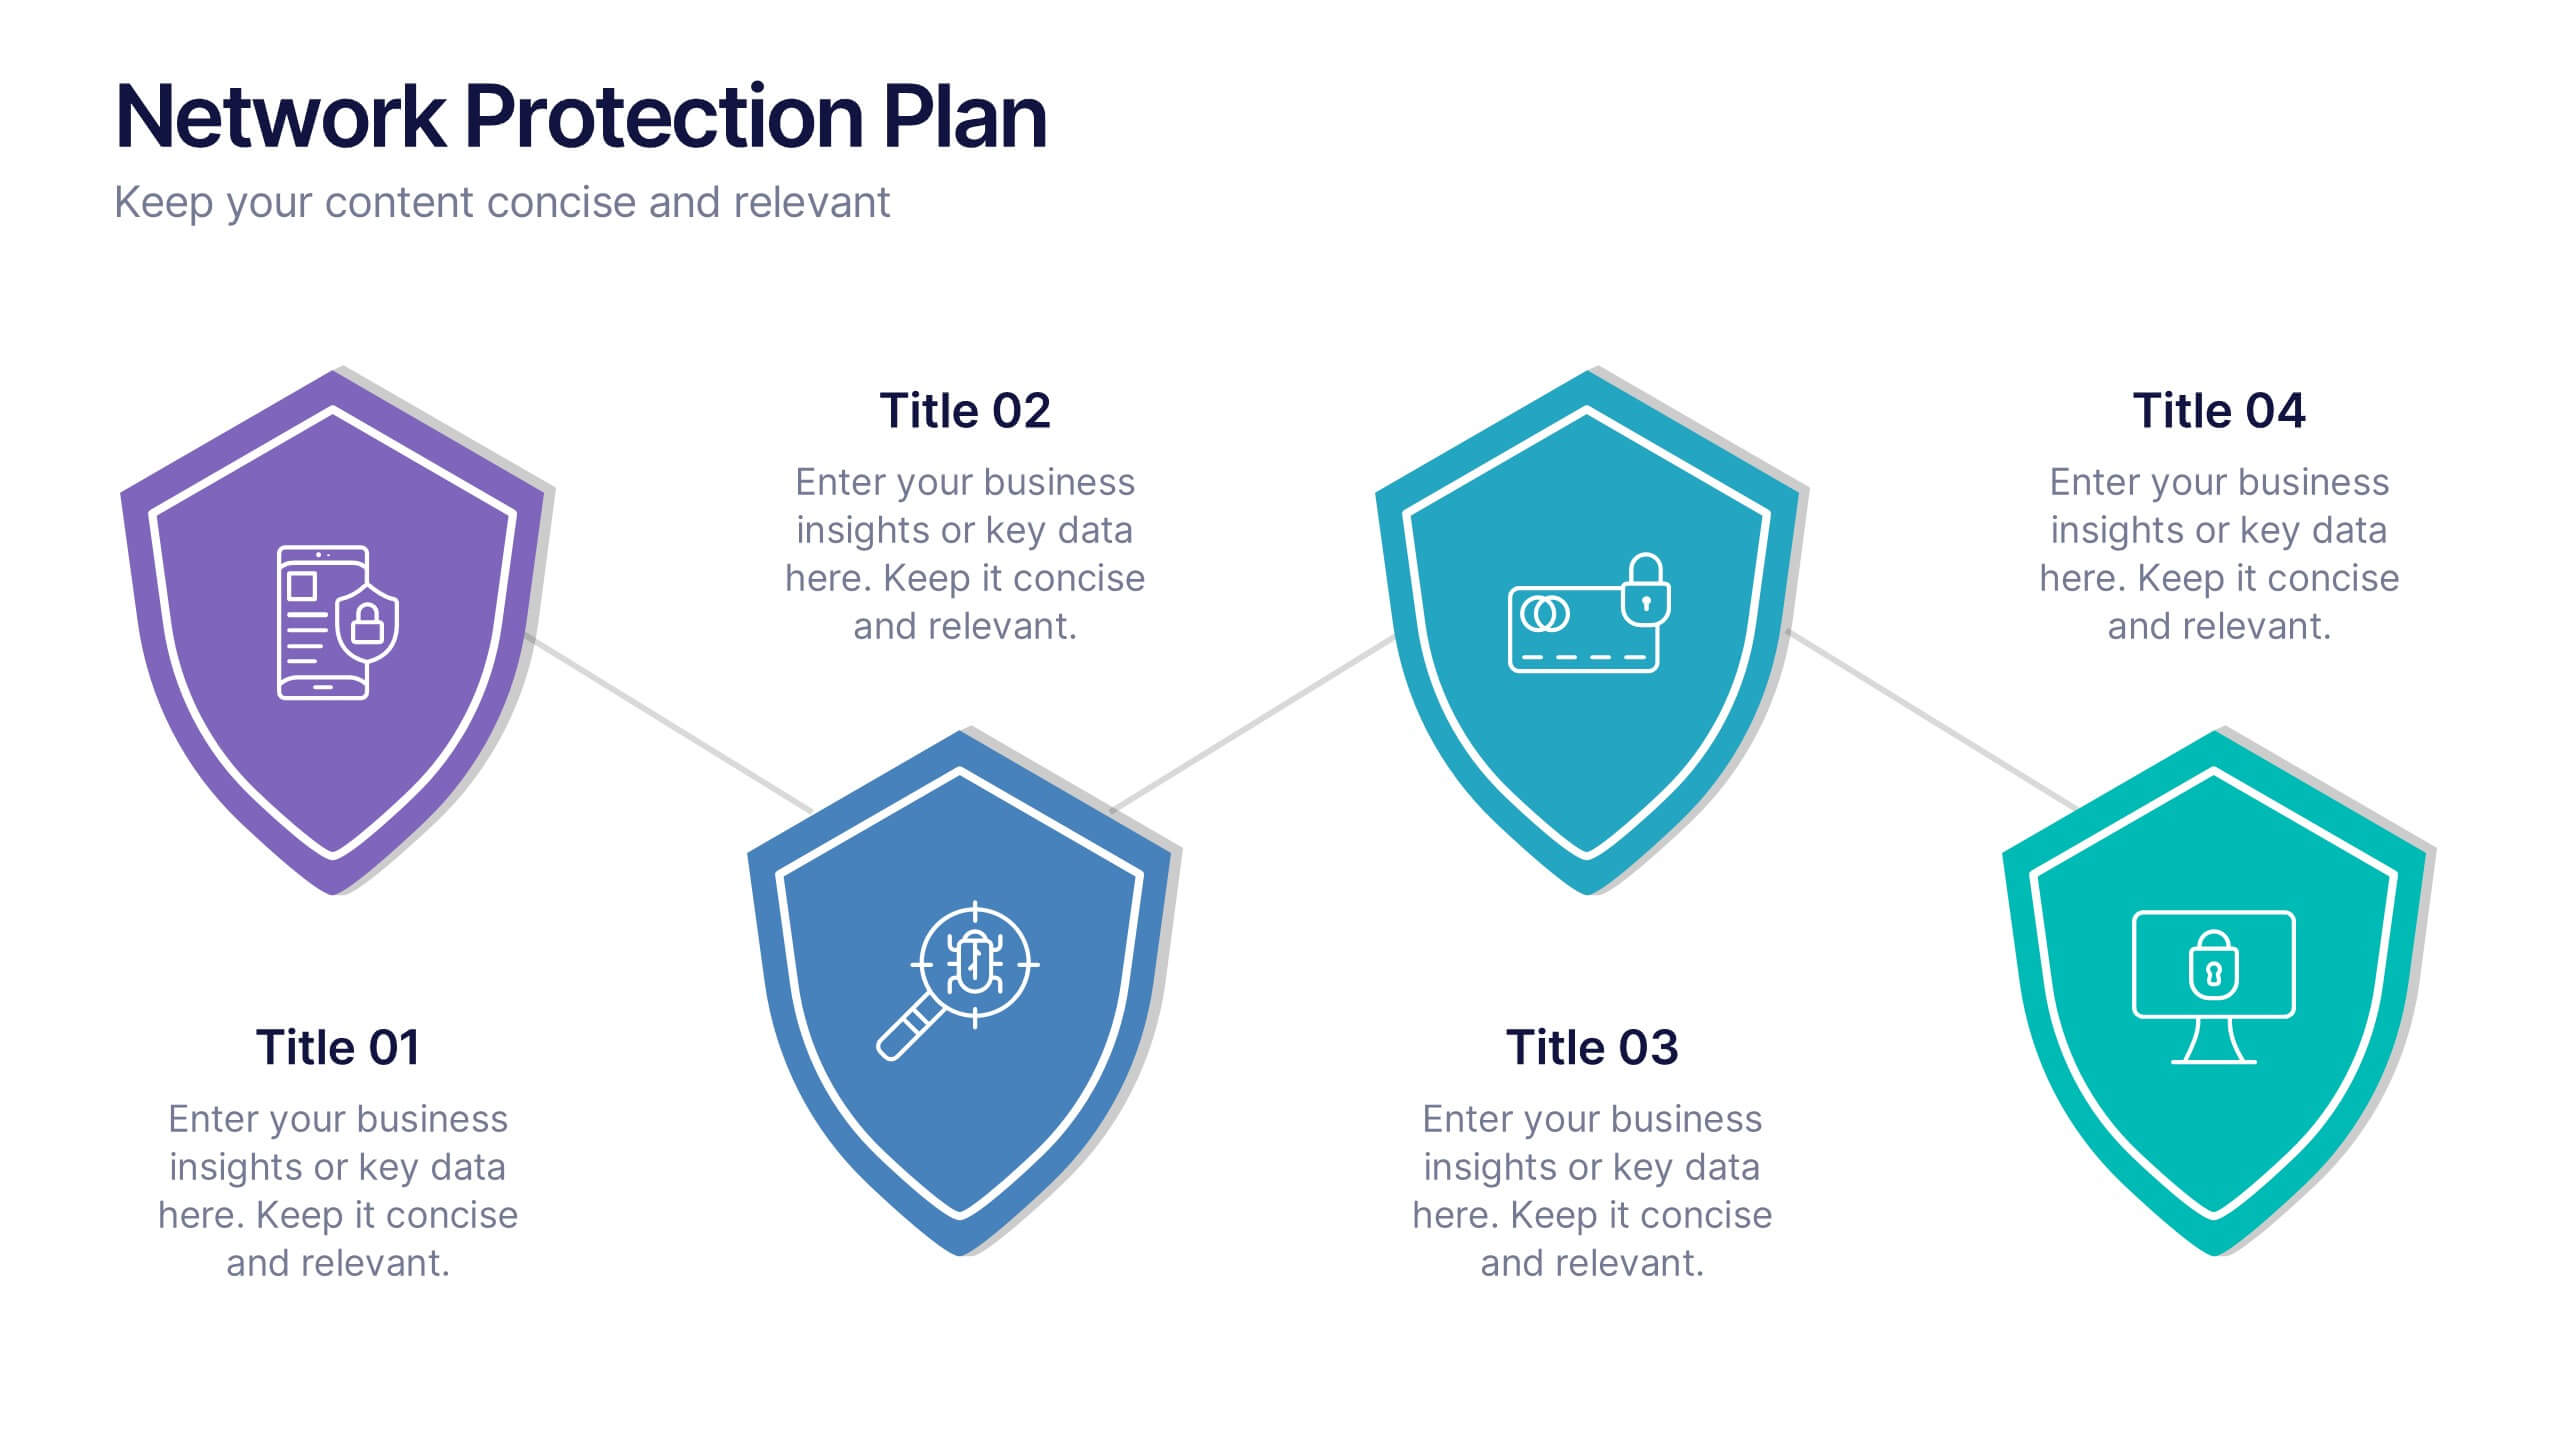
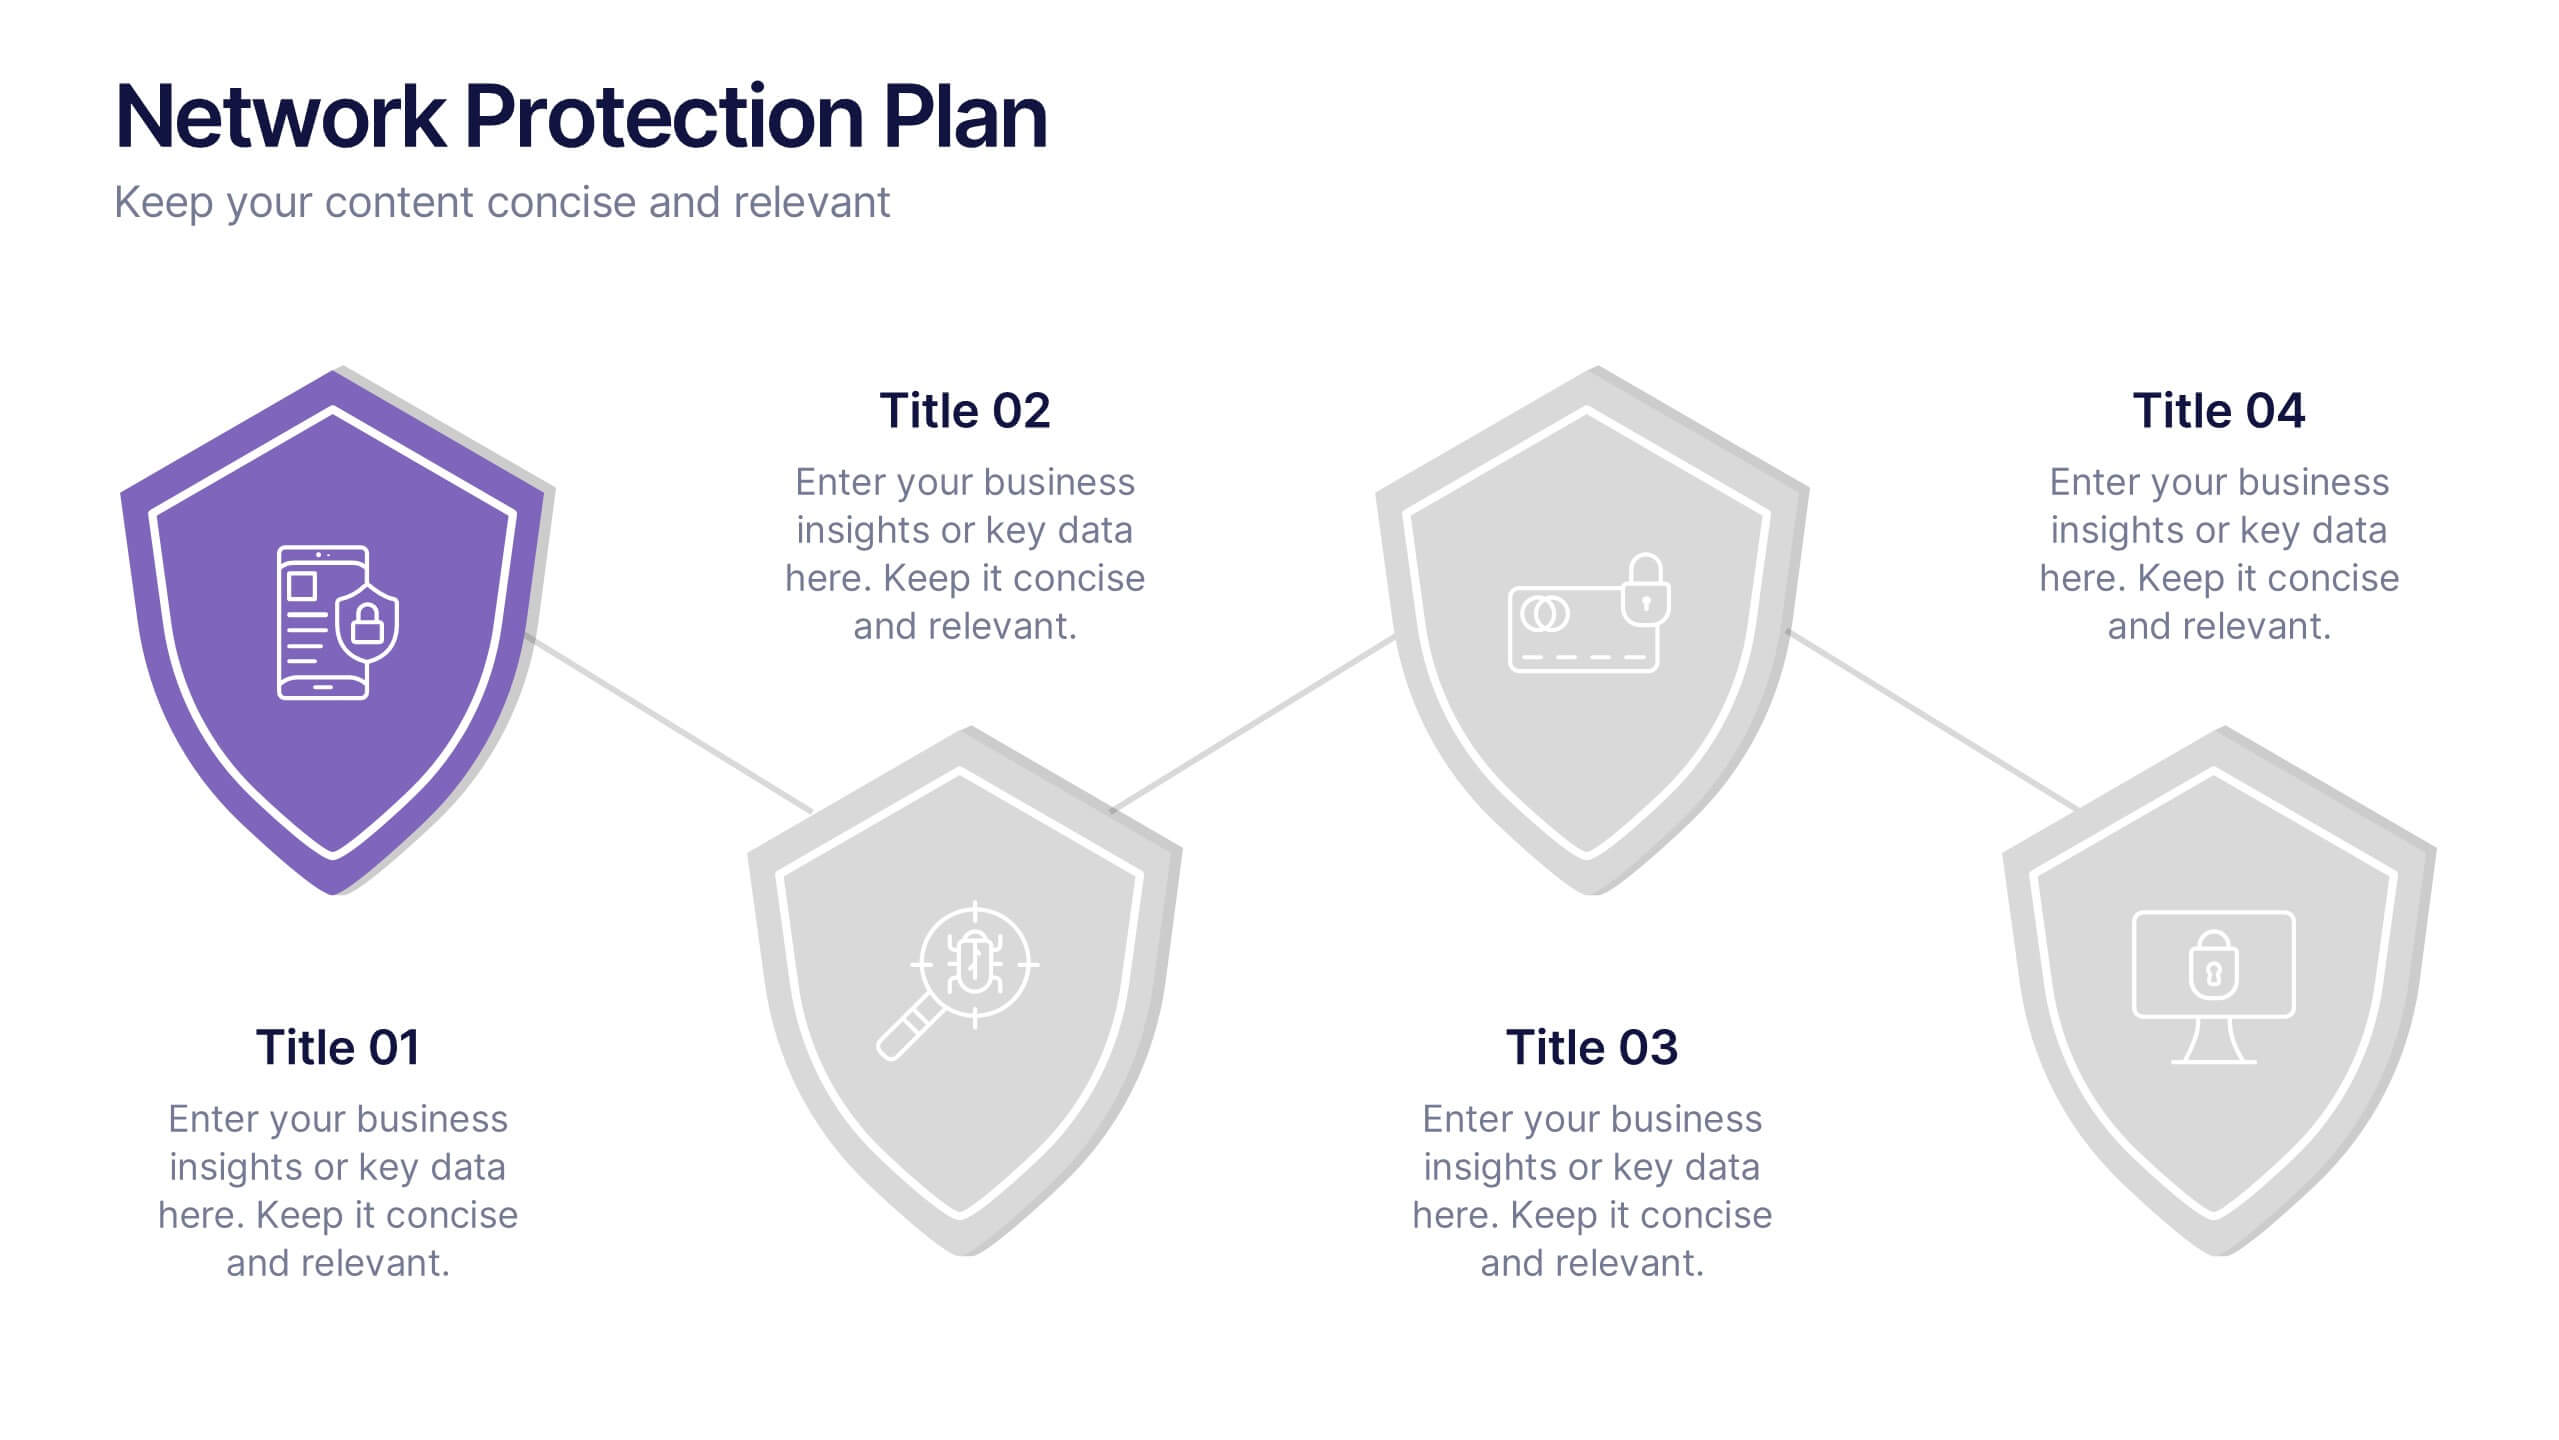
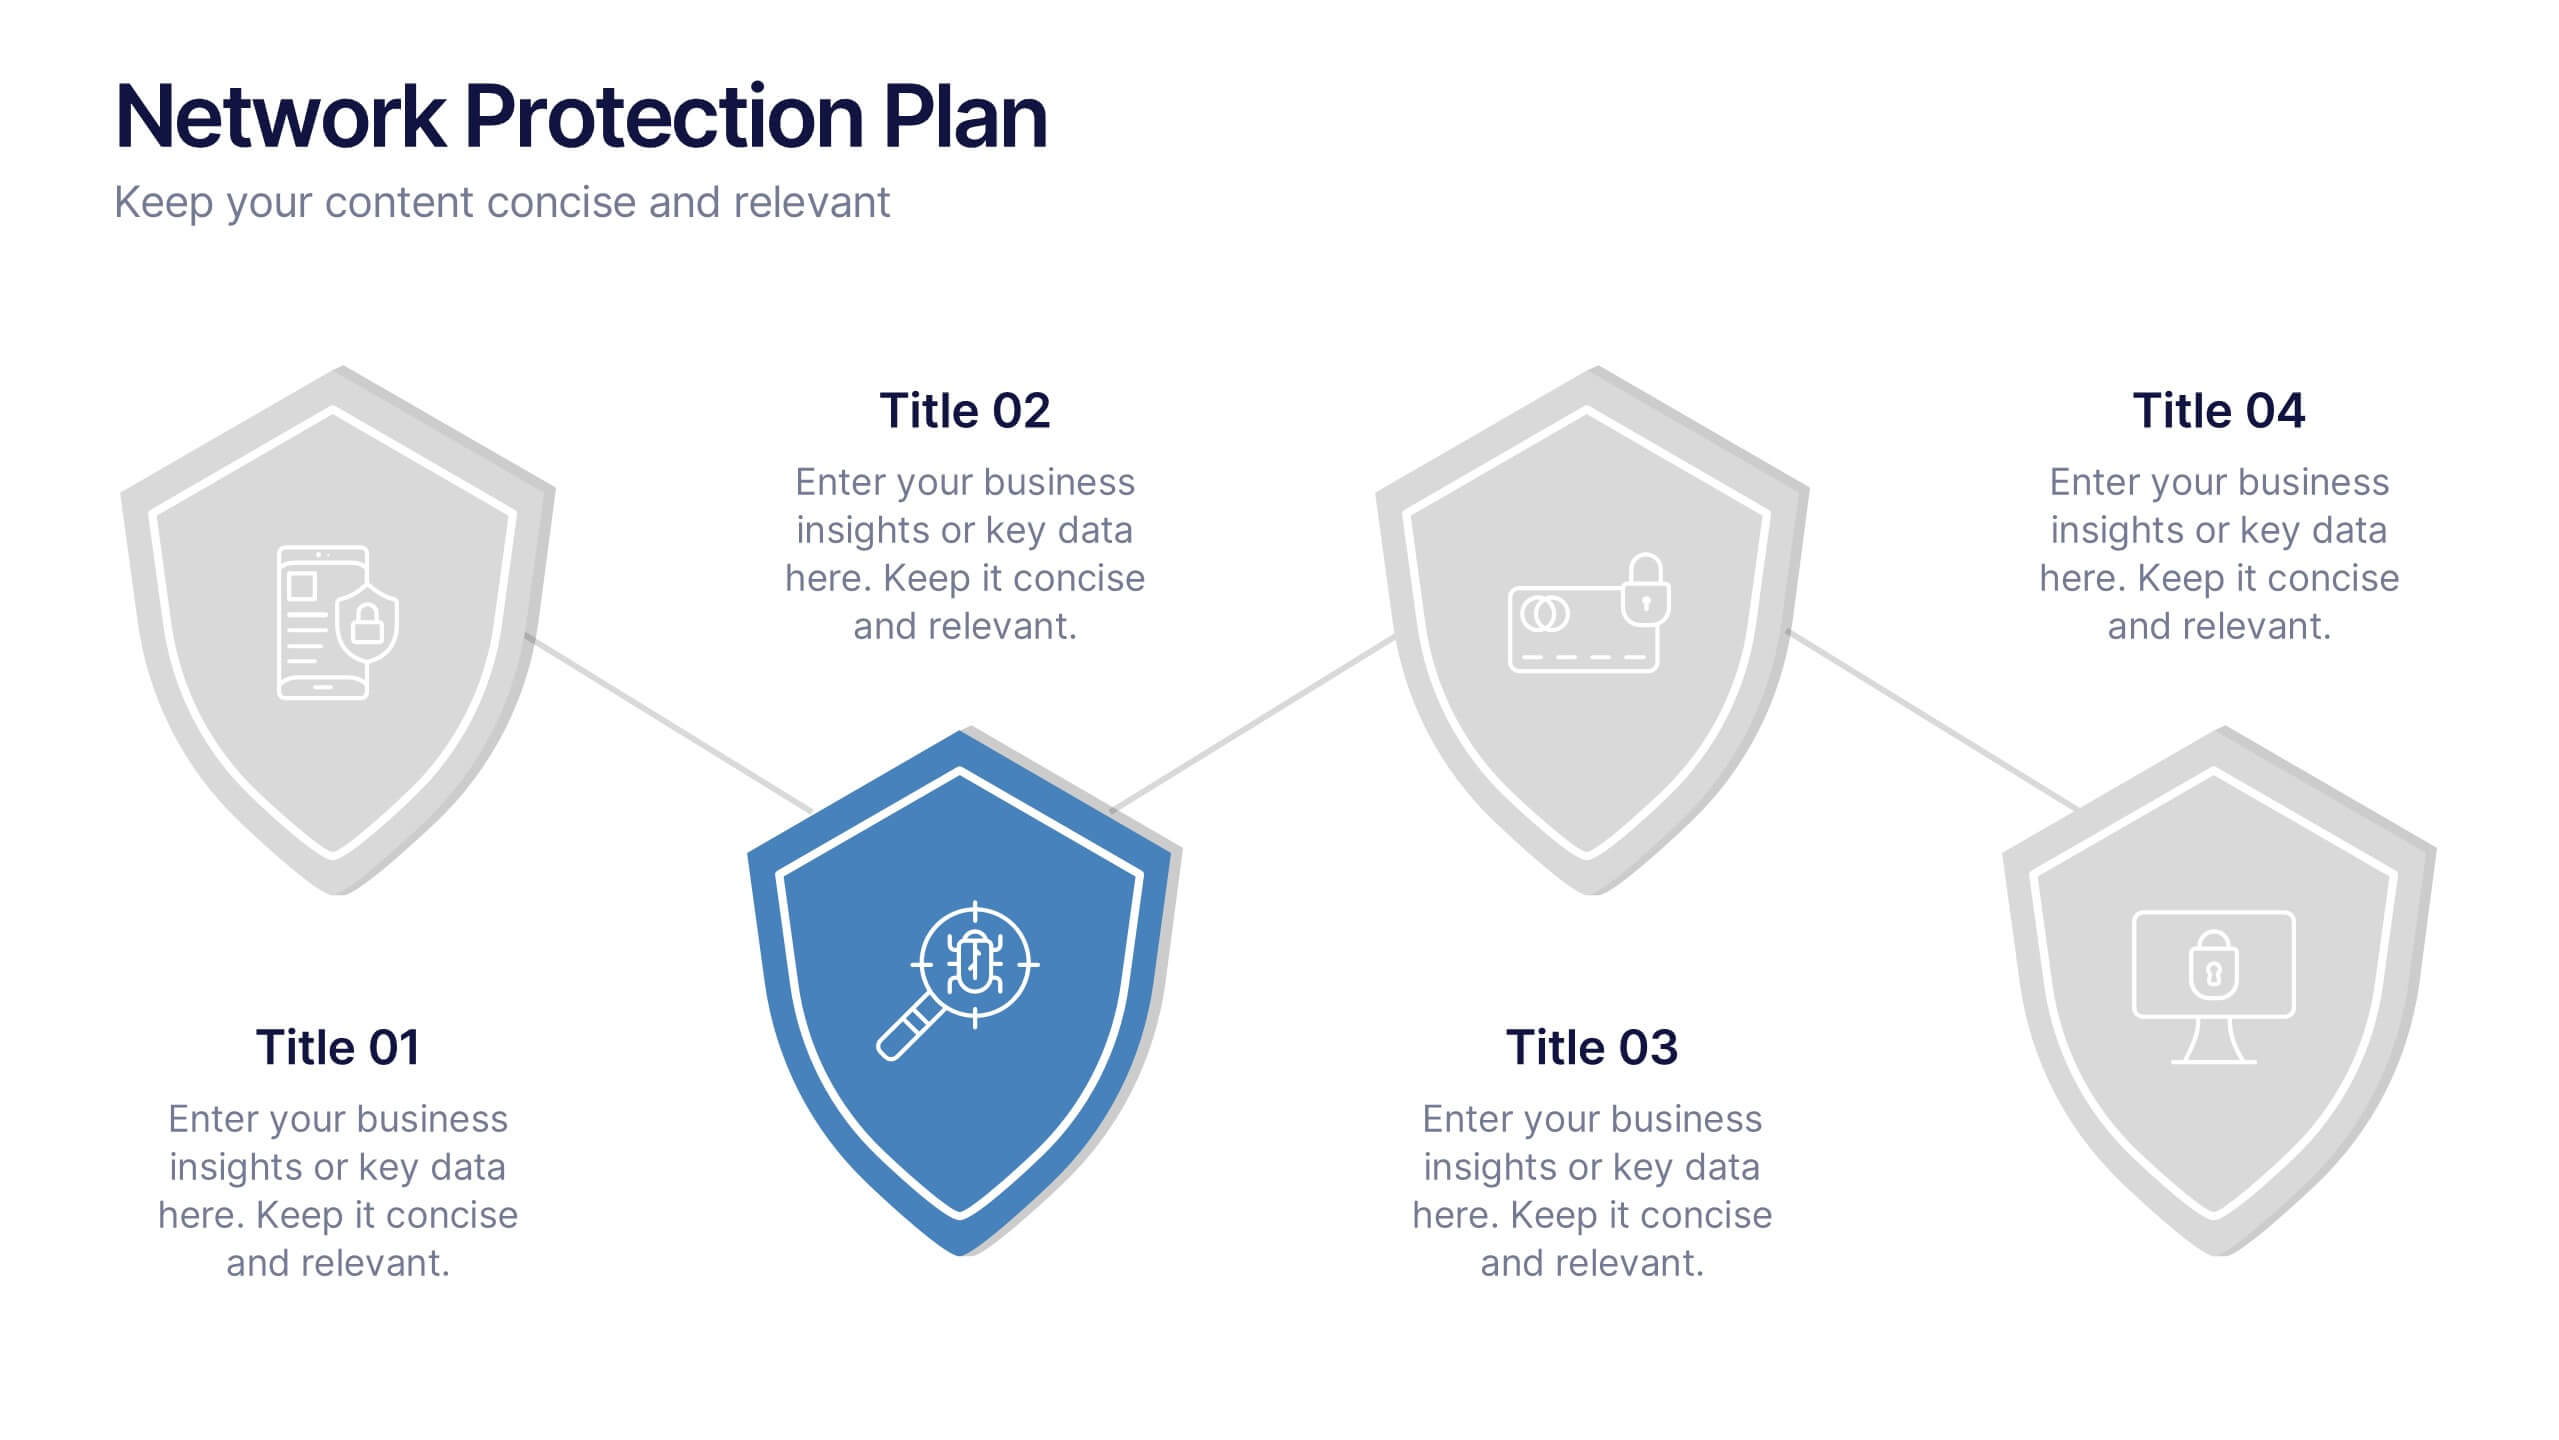
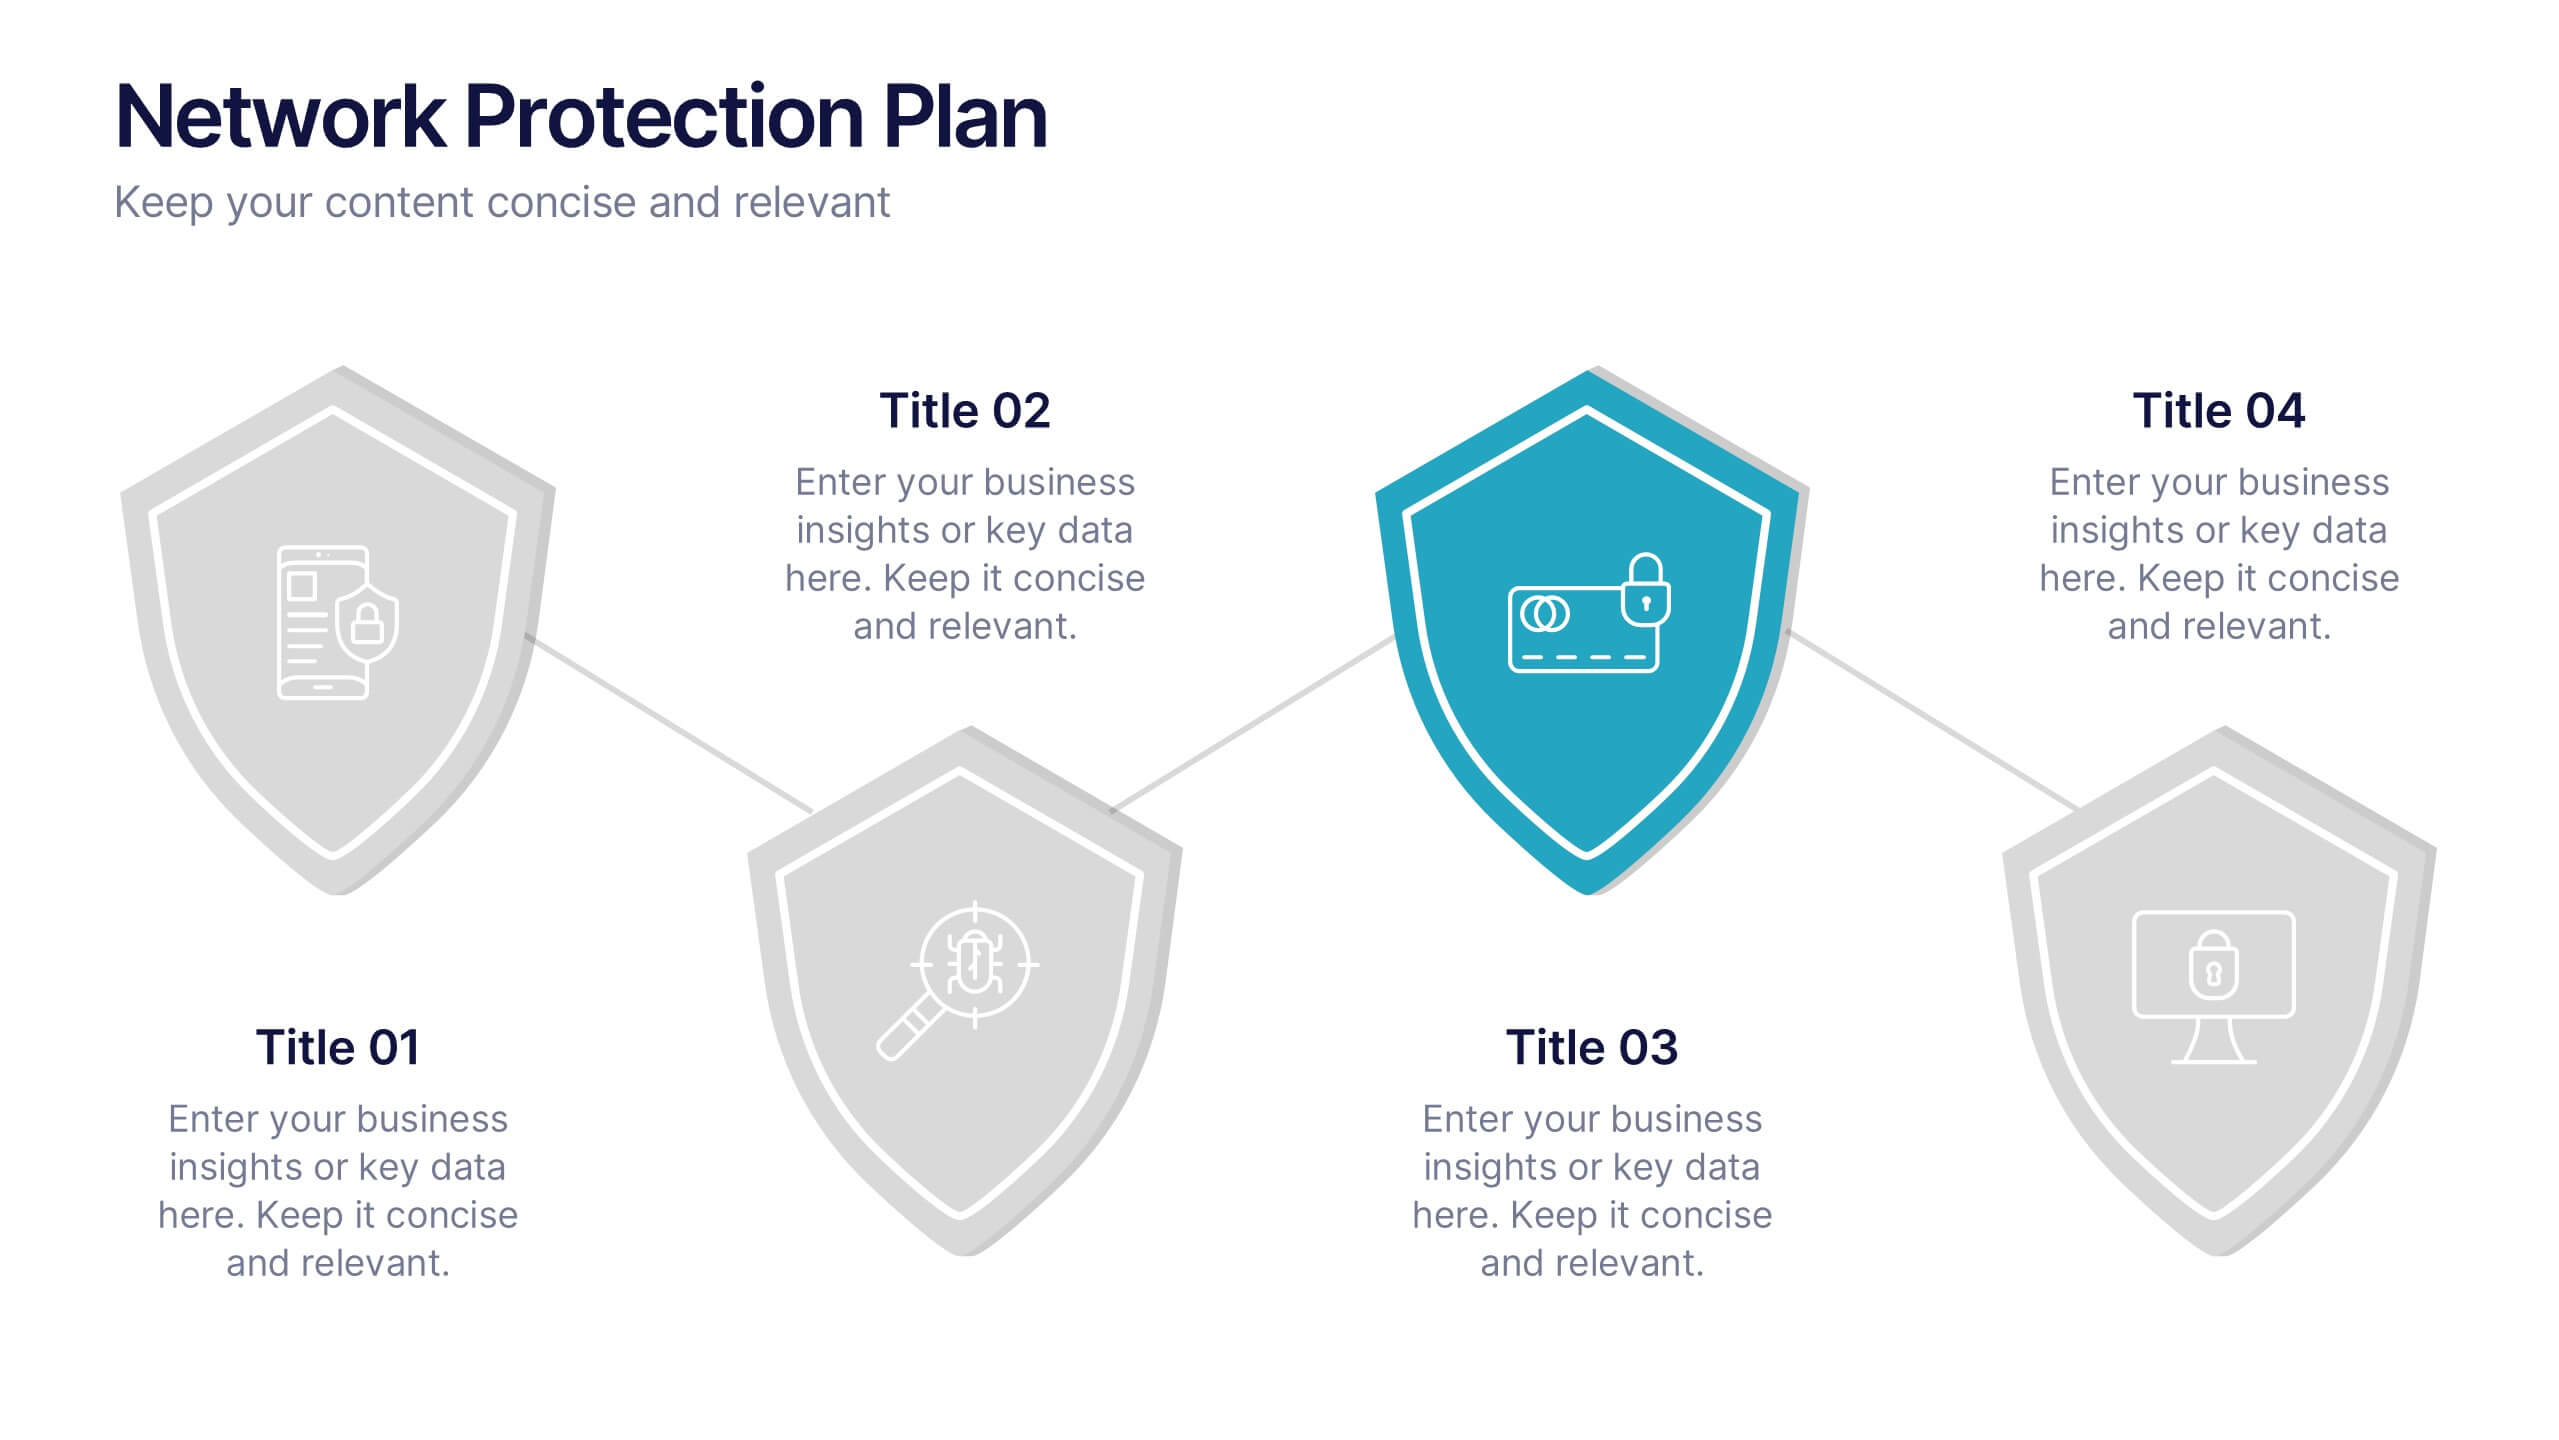
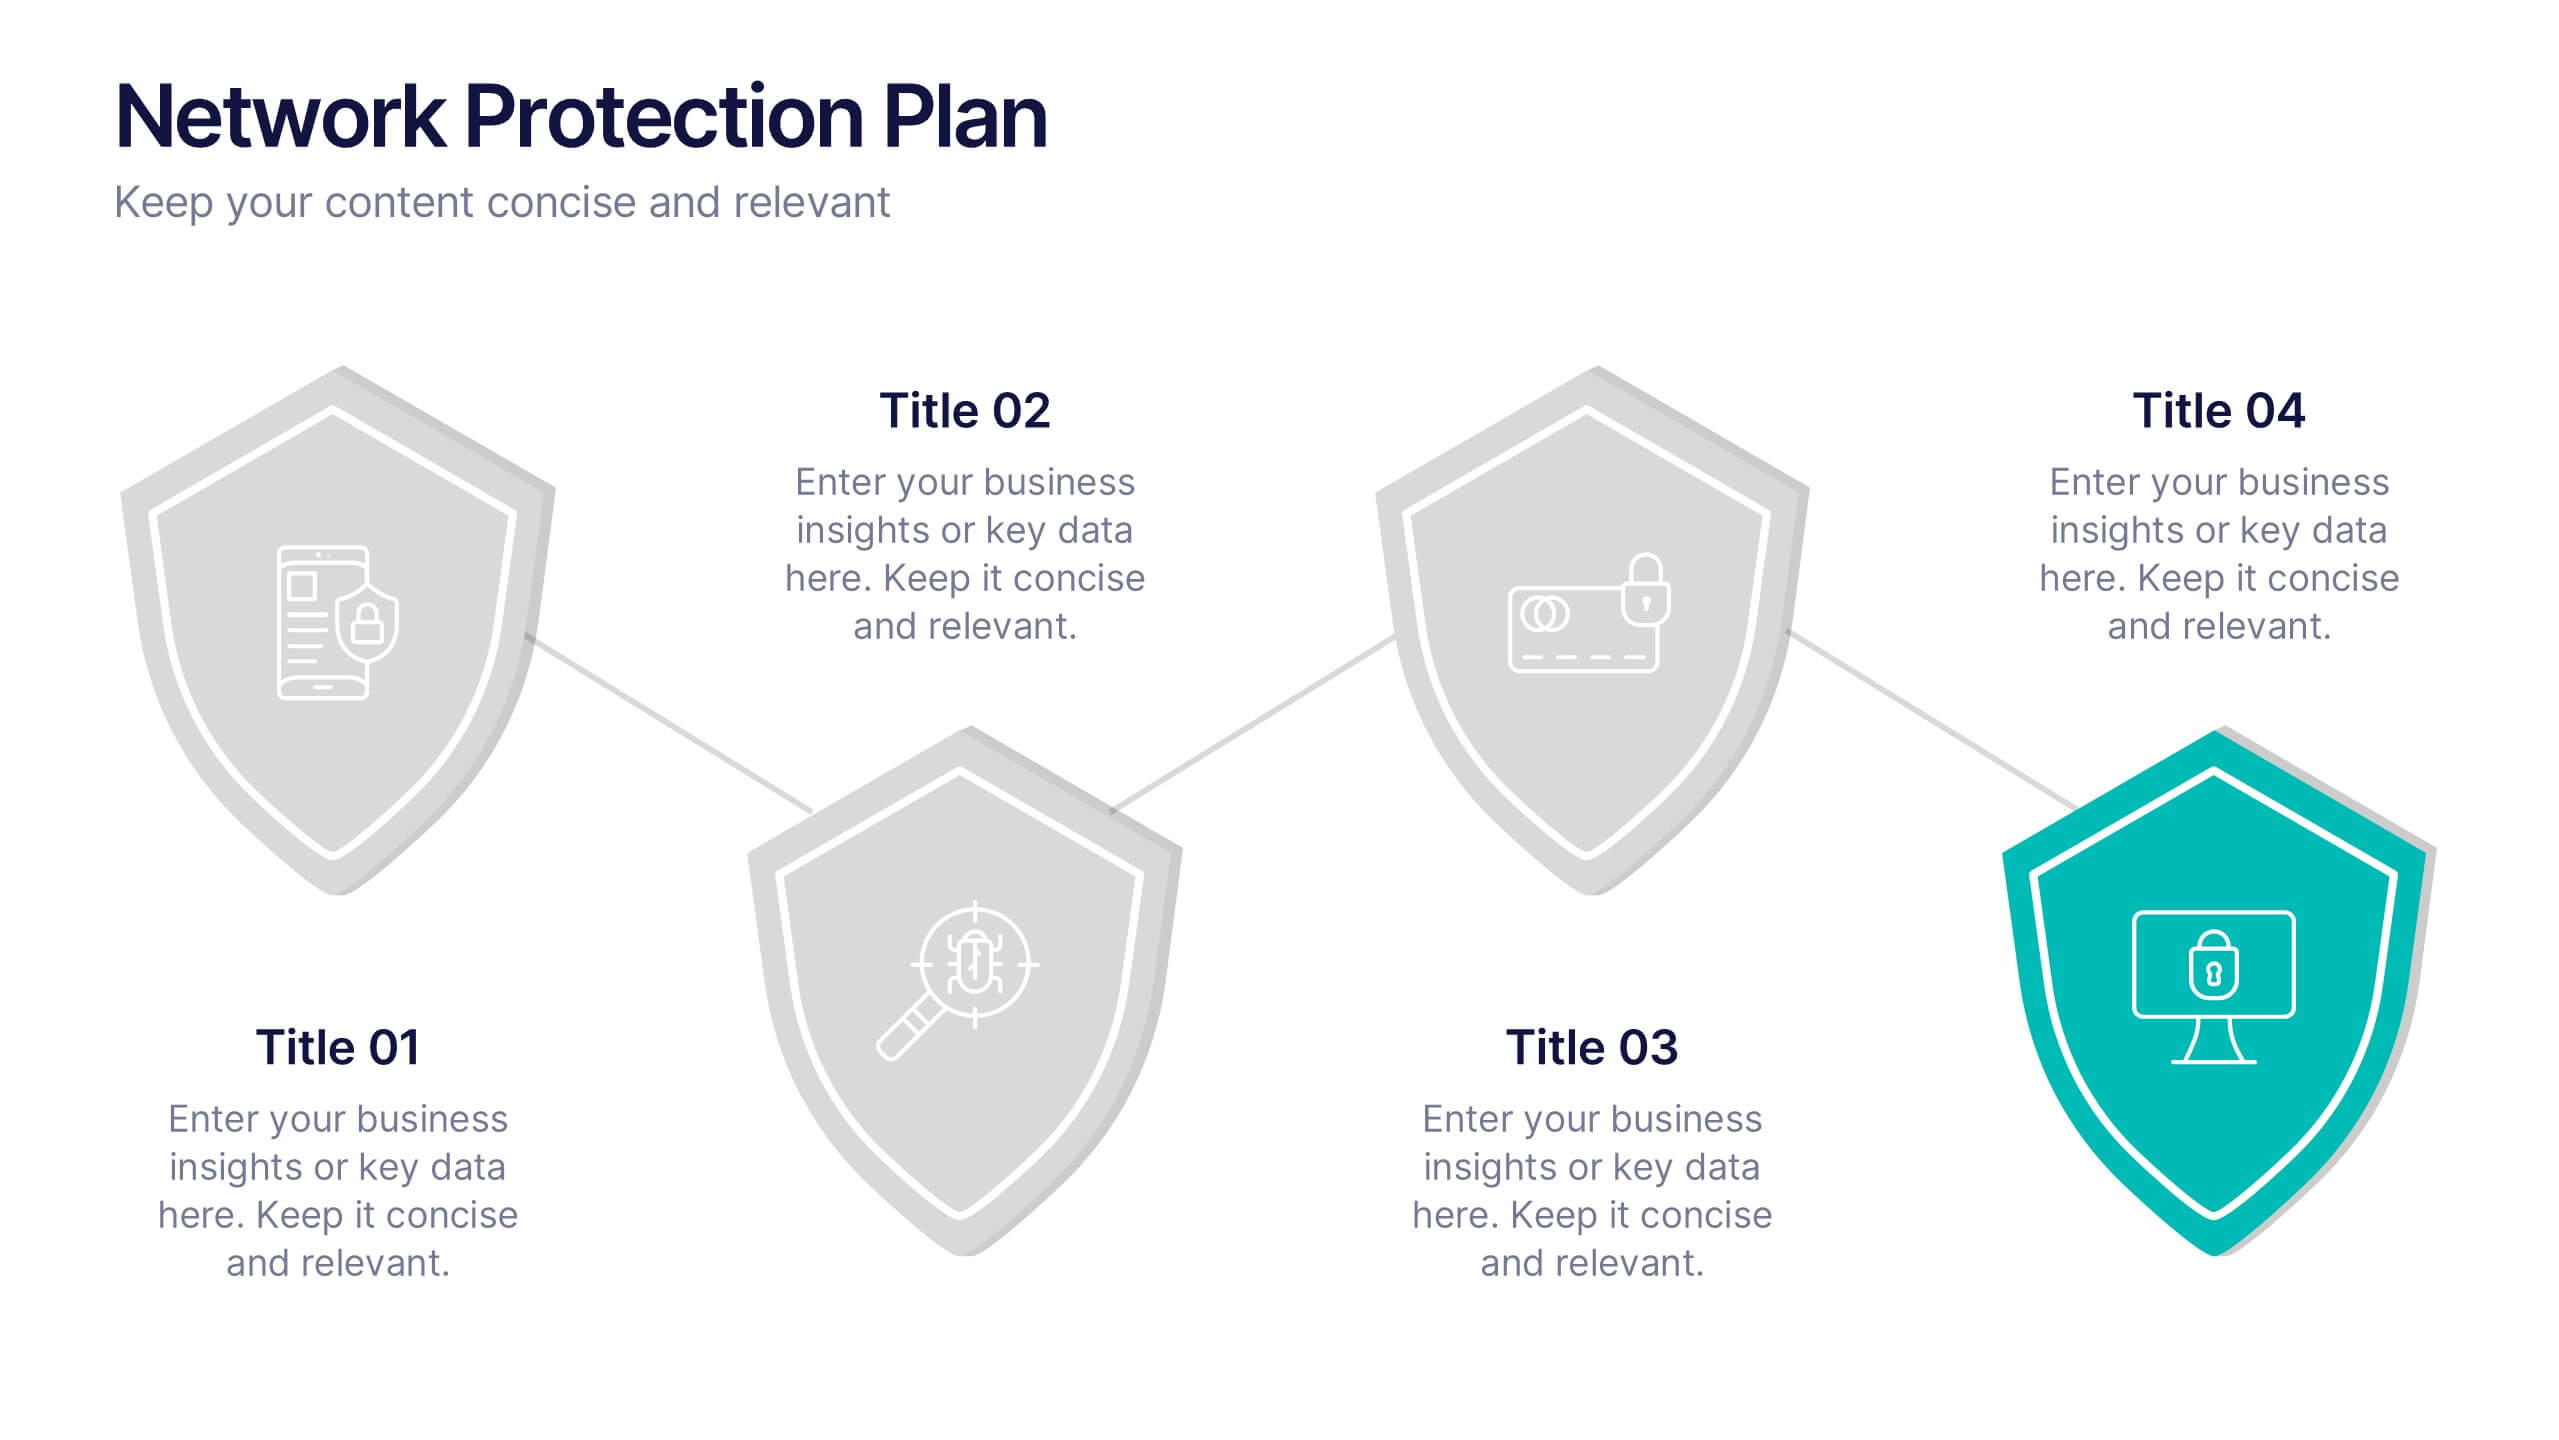
Network Protection Plan Presentation
Bold visuals and clean structure make this presentation a powerful way to communicate your protection strategy with clarity and confidence. It helps you break down key security stages, outline responsibilities, and show how each layer strengthens overall network resilience. Fully compatible with PowerPoint, Keynote, and Google Slides.


4 diapositivas
Machine Learning Overviews Presentation
Bring your audience into the world of intelligent automation with a bold, visual layout that makes complex concepts feel simple and engaging. This presentation breaks down key processes, workflows, and insights using clear graphics that support your message. Fully customizable and compatible with PowerPoint, Keynote, and Google Slides.


8 diapositivas
Inbound and Outbound Value Chain Strategy Presentation
Streamline your supply chain insights with the Inbound and Outbound Value Chain Strategy Presentation. This structured layout highlights the key components of internal and external logistics—from sourcing and procurement to product delivery. Use this template to showcase strategic operations, process optimization, and value-adding activities. Fully editable in PowerPoint, Keynote, Canva, and Google Slides.


4 diapositivas
Psychological Drivers in Consumer Behavior Presentation
Unlock deeper insights into buyer motivations with the Psychological Drivers in Consumer Behavior Presentation. This visually compelling template highlights four key drivers influencing decision-making, from logic to emotion. Perfect for marketing strategies, brand positioning, and behavioral research. Fully editable in Canva, PowerPoint, Google Slides, and Keynote.


3 diapositivas
Financial Planning and Budget Forecast Presentation
Present your financial goals with clarity using the Financial Planning and Budget Forecast Presentation. This modern, minimalist layout helps you break down percentage allocations, forecast future spending, and visualize budget insights with eye-catching graphics. Perfect for finance teams, startups, and consultants. Fully customizable in PowerPoint, Google Slides, Keynote, and Canva.


4 diapositivas
Empathy Mapping for Product Development Presentation
Strengthen user understanding with the Empathy Mapping for Product Development Presentation. This template helps teams visualize what users think, feel, say, and do—essential for creating intuitive products and experiences. Ideal for design sprints, UX workshops, and product planning sessions. Fully editable in PowerPoint, Keynote, Canva, and Google Slides.


10 diapositivas
Workforce Learning & Training Module Presentation
Visualize your team’s learning journey with the Workforce Learning & Training Module Presentation. This hexagonal layout clearly maps training pillars or module stages, helping you present development plans in a structured, engaging way. Ideal for HR professionals, corporate trainers, and consultants. Fully editable in PowerPoint, Keynote, Google Slides, and Canva.


4 diapositivas
Artificial Intelligence Strategy Map Presentation
Step into the future with a clean, modern layout that makes complex technology easy to grasp and exciting to explore. This presentation helps you break down emerging innovations, real-world applications, and industry opportunities using clear visuals and structured sections. Fully customizable and compatible with PowerPoint, Keynote, and Google Slides.


12 diapositivas
Editable Chart Presentation
Present your data with impact using the Editable Chart Presentation. This versatile slide set includes colorful bar and line charts designed for performance metrics, sales growth, or budget comparisons. Easily swap out values and labels to match your story. Fully editable in PowerPoint, Keynote, Google Slides, and Canva.


3 diapositivas
Designing a Loyalty Program Presentation
Build stronger customer connections with a sleek, modern layout that highlights how reward systems drive retention and engagement. This design is perfect for visualizing loyalty strategies, program tiers, and user benefits with clarity and style. Fully editable and compatible with PowerPoint, Keynote, and Google Slides for effortless customization.


4 diapositivas
Sustainability Report Slide Deck Presentation
Bring your sustainability story to life with a bright, modern layout that turns complex environmental data into a clear visual narrative. This presentation helps you outline key initiatives, performance metrics, and long-term goals in a clean, structured format. Fully editable and compatible with PowerPoint, Keynote, and Google Slides.
- 1
- 2
- 3
- 4
- 5
- 6
- 24